You are not logged in.
This means you
CAN ONLY VIEW reports that were published prior to Tuesday, April 1, 2025.
You
MUST UPGRADE YOUR MEMBERSHIP if you want to see any current reports.
AFTER MARKET UPDATE - MONDAY, SEPTEMBER 26TH, 2022
Previous After Market Report Next After Market Report >>>
|
|
|
|
DOW |
-329.60 |
29,260.81 |
-1.11% |
|
Volume |
1,068,455,824 |
-4% |
|
Volume |
4,659,672,400 |
-9% |
|
NASDAQ |
-65.00 |
10,802.92 |
-0.60% |
|
Advancers |
507 |
16% |
|
Advancers |
1,327 |
30% |
|
S&P 500 |
-38.19 |
3,655.04 |
-1.03% |
|
Decliners |
2,589 |
84% |
|
Decliners |
3,157 |
70% |
|
Russell 2000 |
-23.71 |
1,655.88 |
-1.41% |
|
52 Wk Highs |
11 |
|
|
52 Wk Highs |
24 |
|
|
S&P 600 |
-16.47 |
1,064.45 |
-1.52% |
|
52 Wk Lows |
1,083 |
|
|
52 Wk Lows |
1,007 |
|
|
The market (M criteria) is in a correction. A caution flag has been raised by the technical damage in the major indices coupled with a shrinking list of stocks hitting new highs. Disciplined investors know to raise cash by selling weakening stocks on a case-by-case basis, and to protect that cash by avoiding any new buys until a new rally is confirmed with a follow-through day.
|
 |
Sentiment Suffers as Market Correction Continues
Kenneth J. Gruneisen - Passed the CAN SLIM® Master's Exam
The Dow lost 329 points, while the Nasdaq Composite reversed earlier gains to shed 0.6%. The S&P 500 declined 1%, slipping below its mid-June level to notch a new low for 2022. The volume totals reported were lighter than the prior session on the NYSE and on the Nasdaq exchange, indicative of less institutional selling pressure. Breadth was negative as decliners led advancers by more than a 5-1 margin on the NYSE and more than 2-1 on the Nasdaq exchange. There were zero high-ranked companies from the Leaders List that hit new 52-week highs and were listed on the BreakOuts Page for a 2nd consecutive session. New 52-week lows totals again solidly outnumbered new 52-week highs on both the NYSE and the Nasdaq exchange. The market is now in a correction (M criteria).
Chart courtesy of www.stockcharts.com%20on%20Tuesday.%20Yesterday,%20the%20broad%20benchmark%20eclipsed%20the%204,300%20level%20for%20the%20first%20time%20since%20late%20April.%20The%20Nasdaq%20Composite%20fell%201.3%%20amid%20weakness%20in%20mega-cap%20tech%20shares.%20The%20volume%20totals%20reported%20were%20mixed,%20lighter%20than%20the%20prior%20session%20on%20the%20NYSE%20and%20higher%20on%20the%20Nasdaq%20exchange.%20Decliners%20led%20advancers%20by%20a%204-1%20margin%20on%20the%20NYSE%20ad%20by%20a%203-1%20margin%20on%20the%20Nasdaq%20exchange.%20There%20were%2017%20high-ranked%20companies%20from%20the%20Leaders%20List%20that%20hit%20new%2052-week%20highs%20and%20were%20listed%20on%20the%20BreakOuts%20Page,%20down%20from%20the%20total%20of%2045%20on%20the%20prior%20session.%20New%2052-week%20highs%20outnumbered%20new%2052-week%20lows%20on%20the%20NYSE,%20but%20new%20lows%20outnumbered%20new%20highs%20on%20the%20Nasdaq%20exchange.%20The%20market%20is%20in%20a%20confirmed%20uptrend%20(M%20criteria).%20Any%20sustainable%20rally%20requires%20a%20healthy%20crop%20of%20leading%20stocks%20hitting%20new%20highs,%20so%20the%20recent%20improvement%20in%20leadership%20was%20a%20reassuring%20sign.) 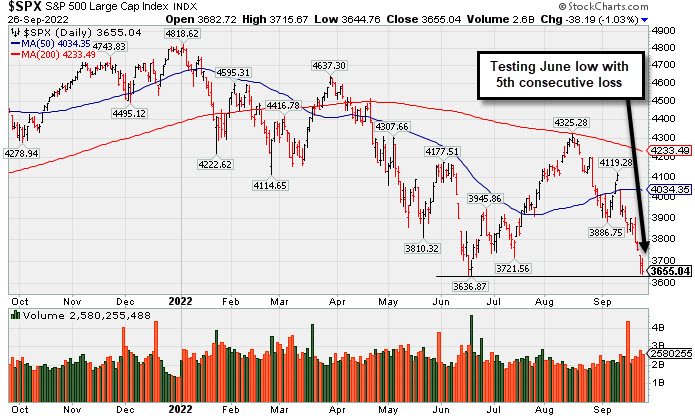 PICTURED: The S&P 500 Index suffered a 5th consecutive loss as it tested the June low.
U.S. equities finished lower for the fifth-straight day on Monday as hawkish commentary from central bank officials weighed on investor sentiment. Boston Federal Reserve (Fed) President Susan Collins said additional rate hikes are needed to curb inflation, even though it may result in economic pain, while Atlanta Fed President Raphael Bostic reiterated the fight to curb inflation was the Fed’s first priority. Internationally, Bank of England Governor Andrew Bailey said the central bank is monitoring recent market turmoil closely and will “act accordingly” at their next scheduled meeting.
Further pressuring sentiment was turmoil in currency markets. A gauge of the U.S. dollar soared 0.8% to a two-decade high, while the British pound sterling notched an all-time low against the greenback. Treasury yields continued their ascent, with the yield on the policy-sensitive two-year note adding 12 basis points (0.12%) to 4.31%. The benchmark 10-year note yield climbed 22 basis points (0.22%) to 3.90%, its highest level since April 2010, while the yield on the 30-year bond advanced 11 basis points (0.11%) to 3.72%. In commodities, West Texas Intermediate (WTI) crude shed 2.7% to $76.62/barrel to its lowest level since early January amid a surging U.S. dollar.
On the data front, the Chicago Fed National Activity Index came in at 0 (a neutral reading) for August, down from the prior month’s 0.29 print. The Dallas Fed’s Manufacturing Activity Index fell to -17.2 in September, down from August’s -12.9 figure.
|
 Kenneth J. Gruneisen started out as a licensed stockbroker in August 1987, a couple of months prior to the historic stock market crash that took the Dow Jones Industrial Average down -22.6% in a single day. He has published daily fact-based fundamental and technical analysis on high-ranked stocks online for two decades. Through FACTBASEDINVESTING.COM, Kenneth provides educational articles, news, market commentary, and other information regarding proven investment systems that work in good times and bad.
Comments contained in the body of this report are technical opinions only and are not necessarily those of Gruneisen Growth Corp. The material herein has been obtained from sources believed to be reliable and accurate, however, its accuracy and completeness cannot be guaranteed. Our firm, employees, and customers may effect transactions, including transactions contrary to any recommendation herein, or have positions in the securities mentioned herein or options with respect thereto. Any recommendation contained in this report may not be suitable for all investors and it is not to be deemed an offer or solicitation on our part with respect to the purchase or sale of any securities. |
|
 |
Tech, Financial, and Commodity-Linked Groups Fell
Kenneth J. Gruneisen - Passed the CAN SLIM® Master's Exam
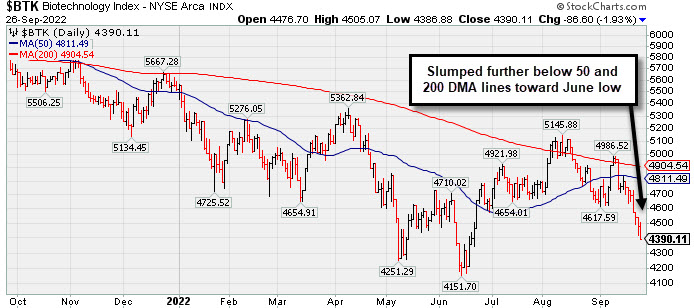
Commodity-linked groups were standout decliners on Monday as the Gold & Silver Index ($XAU -2.57%), Oil Services Index ($OSX -2.72%), and Integrated Oil Index ($XOI -2.61%) each suffered a large loss. The Biotech Index ($BTK -1.93%) and Semiconductor Index ($SOX -1.47%) both outpaced the Networking Index ($NWX -0.72%) to the downside. Financials also created a drag on the major averages as the Broker/Dealer Index ($XBD -1.62%) and Bank Index ($BKX -1.83%) both lost ground. The Retail Index ($RLX -0.00%) finished flat.
PICTURED: The Biotech Index ($BTK -1.93%) slumped further below its 50-day and 200-day moving average (DMA) lines toward the June low.
| Oil Services |
$OSX |
56.08 |
-1.57 |
-2.72% |
+6.38% |
| Integrated Oil |
$XOI |
1,415.61 |
-37.98 |
-2.61% |
+20.15% |
| Semiconductor |
$SOX |
2,373.47 |
-35.43 |
-1.47% |
-39.85% |
| Networking |
$NWX |
716.43 |
-5.22 |
-0.72% |
-26.22% |
| Broker/Dealer |
$XBD |
412.26 |
-6.78 |
-1.62% |
-15.32% |
| Retail |
$RLX |
2,978.57 |
-0.09 |
-0.00% |
-29.53% |
| Gold & Silver |
$XAU |
91.40 |
-2.41 |
-2.57% |
-30.99% |
| Bank |
$BKX |
97.08 |
-1.81 |
-1.83% |
-26.58% |
| Biotech |
$BTK |
4,390.11 |
-86.60 |
-1.93% |
-20.45% |
|
|
|
 |
Damaging Slump Below 50-Day Moving Average Hurt Outlook
Kenneth J. Gruneisen - Passed the CAN SLIM® Master's Exam
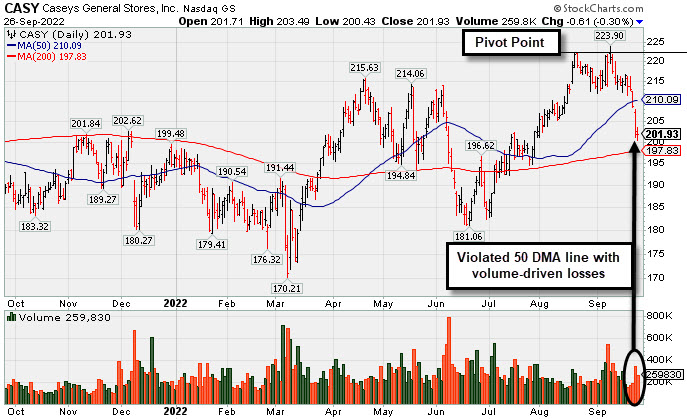
Casey's General Stores (CASY -$0.61 or -0.30% to $201.93) ended the session lower. It violated its 50-day moving average (DMA) line ($210) decisively last week as above average volume was behind damaging losses triggering a technical sell signal. Only a prompt rebound above the 50 DMA line would help its outlook improve.
CASY was highlighted in yellow in the 9/09/22 mid-day report (read here) with pivot point cited based on its 8/22/22 high. It was perched within close striking distance of its all-time high. Disciplined investors may note that it did not produce subsequent gains above the pivot point backed by at least +40% above average volume, so it failed to trigger a technical buy signal.
CASY reported earnings +28% on +40% sales revenues for the Jul '22 quarter versus the year ago period, its 3rd strong quarterly comparison above the +25% minimum earnings guideline (C criteria). Its annual earnings (A criteria) history has been strong and it has an earnings Per Share Rating of 96. It hails from the RETAIL - Super/Mini Markets group which is currently ranked 6th on the 197 Industry Groups list (L criteria).
There are 37.3 million shares outstanding (S criteria) which can contribute to greater price volatility in the event of institutional buying or selling. The number of top-rated funds owning its shares rose from 565 in Mar '22 to 601 in Jun '22, a reassuring sign concerning the I criteria. Its current Up/Down Volume Ratio of 1.1 is an unbiased indication its shares have been under accumulation over the past 50 days.
|
|
|
Color Codes Explained :
Y - Better candidates highlighted by our
staff of experts.
G - Previously featured
in past reports as yellow but may no longer be buyable under the
guidelines.
***Last / Change / Volume data in this table is the closing quote data***
Symbol/Exchange
Company Name
Industry Group |
PRICE |
CHANGE
(%Change) |
Day High |
Volume
(% DAV)
(% 50 day avg vol) |
52 Wk Hi
% From Hi |
Featured
Date |
Price
Featured |
Pivot Featured |
|
Max Buy |
 CI
-
NYSE
CI
-
NYSE
Cigna Corp
Medical-Managed Care
|
$276.80
|
-0.97
-0.35% |
$278.60
|
1,993,395
104.26% of 50 DAV
50 DAV is 1,912,000
|
$296.29
-6.58%
|
7/7/2022
|
$276.55
|
PP = $273.68
|
|
MB = $287.36
|
 Most Recent Note - 9/26/2022 12:41:02 PM
G - Slumped below its 50 DMA line ($283) during a streak of 6 consecutive losses, raising concerns while retreating from near its all-time high. Reported earnings for the Jun '22 quarter rose +19% on +5% sales revenues versus the year ago period, breaking a streak of 3 quarterly earnings increases above the +25% minimum guideline (C criteria), raising fundamental concerns.
>>> FEATURED STOCK ARTICLE : Found Support Above 50-Day Moving Average Line This Week - 9/16/2022 |
View all notes |
Set NEW NOTE alert |
Company Profile |
SEC
News |
Chart |
Request a new note
C
A
S
I |
ESQ
-
NASDAQ
Esquire Financial Hldgs
Finance-Commercial Loans
|
$38.32
|
-0.38
-0.98% |
$38.85
|
7,942
29.41% of 50 DAV
50 DAV is 27,000
|
$41.68
-8.06%
|
7/26/2022
|
$37.74
|
PP = $39.19
|
|
MB = $41.15
|
Most Recent Note - 9/26/2022 5:40:49 PM
Y - Still finding support above its 50 DMA line ($37.78). Gains back above the pivot point were a reassuring sign of fresh institutional buying. The market is in a correction (M criteria) and disciplined investors know to avoid new buying efforts until a new rally confirmed with a follow-through day.
>>> FEATURED STOCK ARTICLE : Thinly-Traded Esquire Still Perched Near High - 9/20/2022 |
View all notes |
Set NEW NOTE alert |
Company Profile |
SEC
News |
Chart |
Request a new note
C
A
S
I |
ENPH
-
NASDAQ
Enphase Energy Inc
Energy-Solar
|
$274.92
|
-4.57
-1.64% |
$288.95
|
3,354,050
89.25% of 50 DAV
50 DAV is 3,758,000
|
$324.84
-15.37%
|
7/28/2022
|
$276.66
|
PP = $282.55
|
|
MB = $296.68
|
Most Recent Note - 9/26/2022 5:40:01 PM
G - Color code is changed to green while sputtering below its 50 DMA line ($282.87) and testing near lows in the $271-272 area noted as important near-term support. More damaging losses would raise greater concerns. Fundamentals remain strong. The market is in a correction (M criteria) and disciplined investors know to avoid new buying efforts until a new rally confirmed with a follow-through day.
>>> FEATURED STOCK ARTICLE : High-Ranked Solar Energy Firm Hovering Near All-Time High - 9/13/2022 |
View all notes |
Set NEW NOTE alert |
Company Profile |
SEC
News |
Chart |
Request a new note
C
A
S
I |
CLH
-
NYSE
Clean Harbors Inc
Pollution Control
|
$107.65
|
-1.97
-1.80% |
$109.81
|
404,769
108.23% of 50 DAV
50 DAV is 374,000
|
$124.49
-13.53%
|
8/10/2022
|
$111.78
|
PP = $115.10
|
|
MB = $120.86
|
Most Recent Note - 9/26/2022 5:37:36 PM
Slumped further today with its 5th consecutive loss after violating its 50 DMA line ($110.46) on the prior session raising concerns and triggering a technical sell signal. A rebound above the 50 DMA line is needed for its outlook to improve. It will be dropped from the Featured Stocks list tonight. Fundamentals remain strong.
>>> FEATURED STOCK ARTICLE : Tested Support Near Prior High in the $115 Area - 9/19/2022 |
View all notes |
Set NEW NOTE alert |
Company Profile |
SEC
News |
Chart |
Request a new note
C
A
S
I |
CASY
-
NASDAQ
Caseys General Stores
RETAIL - Super/Mini Markets
|
$201.93
|
-0.61
-0.30% |
$203.49
|
259,830
103.93% of 50 DAV
50 DAV is 250,000
|
$223.90
-9.81%
|
9/8/2022
|
$217.81
|
PP = $222.40
|
|
MB = $233.52
|
Most Recent Note - 9/26/2022 5:31:45 PM
G - Ended lower today. Violated its 50 DMA line ($210) decisively last week with above average volume behind damaging losses triggering a technical sell signal. Only a prompt rebound above the 50 DMA line would help its outlook improve. See the latest FSU analysis for more details and a new annotated graph.
>>> FEATURED STOCK ARTICLE : Damaging Slump Below 50-Day Moving Average Hurt Outlook - 9/26/2022 |
View all notes |
Set NEW NOTE alert |
Company Profile |
SEC
News |
Chart |
Request a new note
C
A
S
I |
Symbol/Exchange
Company Name
Industry Group |
PRICE |
CHANGE
(%Change) |
Day High |
Volume
(% DAV)
(% 50 day avg vol) |
52 Wk Hi
% From Hi |
Featured
Date |
Price
Featured |
Pivot Featured |
|
Max Buy |
CCRN
-
NASDAQ
Cross Country Healthcare
DIVERSIFIED SERVICES - Staffing and Outsourcing Service
|
$27.64
|
+0.47
1.73% |
$28.18
|
630,029
68.78% of 50 DAV
50 DAV is 916,000
|
$30.51
-9.41%
|
9/9/2022
|
$27.32
|
PP = $30.61
|
|
MB = $32.14
|
Most Recent Note - 9/26/2022 5:34:30 PM
Y - Its 50 DMA line ($26) defines important near-term support where a violation would raise concerns and trigger a technical sell signal. Volume totals have been cooling while still consolidating within striking distance of prior highs in the $30 area. Recently reported insider buying is a reassuring sign.The market is in a correction (M criteria) and disciplined investors know to avoid new buying efforts until a new rally confirmed with a follow-through day.
>>> FEATURED STOCK ARTICLE : Positive Reversal While Consolidating Above 50-Day Moving Average - 9/12/2022 |
View all notes |
Set NEW NOTE alert |
Company Profile |
SEC
News |
Chart |
Request a new note
C
A
S
I |
|
|
|
THESE ARE NOT BUY RECOMMENDATIONS!
Comments contained in the body of this report are technical
opinions only. The material herein has been obtained
from sources believed to be reliable and accurate, however,
its accuracy and completeness cannot be guaranteed.
This site is not an investment advisor, hence it does
not endorse or recommend any securities or other investments.
Any recommendation contained in this report may not
be suitable for all investors and it is not to be deemed
an offer or solicitation on our part with respect to
the purchase or sale of any securities. All trademarks,
service marks and trade names appearing in this report
are the property of their respective owners, and are
likewise used for identification purposes only.
This report is a service available
only to active Paid Premium Members.
You may opt-out of receiving report notifications
at any time. Questions or comments may be submitted
by writing to Premium Membership Services 665 S.E. 10 Street, Suite 201 Deerfield Beach, FL 33441-5634 or by calling 1-800-965-8307
or 954-785-1121.
|
|
|