You are not logged in.
This means you
CAN ONLY VIEW reports that were published prior to Wednesday, April 9, 2025.
You
MUST UPGRADE YOUR MEMBERSHIP if you want to see any current reports.
AFTER MARKET UPDATE - WEDNESDAY, SEPTEMBER 28TH, 2022
Previous After Market Report Next After Market Report >>>
|
|
|
|
DOW |
+548.75 |
29,683.74 |
+1.88% |
|
Volume |
1,041,776,723 |
+3% |
|
Volume |
4,551,914,800 |
+4% |
|
NASDAQ |
+222.13 |
11,051.64 |
+2.05% |
|
Advancers |
2,687 |
87% |
|
Advancers |
3,112 |
75% |
|
S&P 500 |
+71.75 |
3,719.04 |
+1.97% |
|
Decliners |
401 |
13% |
|
Decliners |
1,050 |
25% |
|
Russell 2000 |
+52.73 |
1,715.24 |
+3.17% |
|
52 Wk Highs |
12 |
|
|
52 Wk Highs |
31 |
|
|
S&P 600 |
+29.46 |
1,094.79 |
+2.77% |
|
52 Wk Lows |
294 |
|
|
52 Wk Lows |
368 |
|
|
The market (M criteria) is in a correction. A caution flag has been raised by the technical damage in the major indices coupled with a shrinking list of stocks hitting new highs. Disciplined investors know to raise cash by selling weakening stocks on a case-by-case basis, and to protect that cash by avoiding any new buys until a new rally is confirmed with a follow-through day.
|
 |
Breadth Positive as Major Averages Posted Solid Gains
Kenneth J. Gruneisen - Passed the CAN SLIM® Master's Exam
The Dow and S&P 500 snapped six-day losing streaks, adding 548 points and climbing 2%, respectively. The Nasdaq Composite advanced 2.1%. The volume totals reported were higher than the prior session on the NYSE and on the Nasdaq exchange. Advancers led decliners by a almost a 7-1 margin on the NYSE and 3-1 on the Nasdaq exchange. There were 2 high-ranked companies from the Leaders List that hit new 52-week highs and were listed on the BreakOuts Page, up from 1 on the prior session. New 52-week lows totals contracted yet still solidly outnumbered a short list of new 52-week highs on both the NYSE and the Nasdaq exchange. The market is now in a correction (M criteria).
Chart courtesy of www.stockcharts.com%20on%20Tuesday.%20Yesterday,%20the%20broad%20benchmark%20eclipsed%20the%204,300%20level%20for%20the%20first%20time%20since%20late%20April.%20The%20Nasdaq%20Composite%20fell%201.3%%20amid%20weakness%20in%20mega-cap%20tech%20shares.%20The%20volume%20totals%20reported%20were%20mixed,%20lighter%20than%20the%20prior%20session%20on%20the%20NYSE%20and%20higher%20on%20the%20Nasdaq%20exchange.%20Decliners%20led%20advancers%20by%20a%204-1%20margin%20on%20the%20NYSE%20ad%20by%20a%203-1%20margin%20on%20the%20Nasdaq%20exchange.%20There%20were%2017%20high-ranked%20companies%20from%20the%20Leaders%20List%20that%20hit%20new%2052-week%20highs%20and%20were%20listed%20on%20the%20BreakOuts%20Page,%20down%20from%20the%20total%20of%2045%20on%20the%20prior%20session.%20New%2052-week%20highs%20outnumbered%20new%2052-week%20lows%20on%20the%20NYSE,%20but%20new%20lows%20outnumbered%20new%20highs%20on%20the%20Nasdaq%20exchange.%20The%20market%20is%20in%20a%20confirmed%20uptrend%20(M%20criteria).%20Any%20sustainable%20rally%20requires%20a%20healthy%20crop%20of%20leading%20stocks%20hitting%20new%20highs,%20so%20the%20recent%20improvement%20in%20leadership%20was%20a%20reassuring%20sign.) 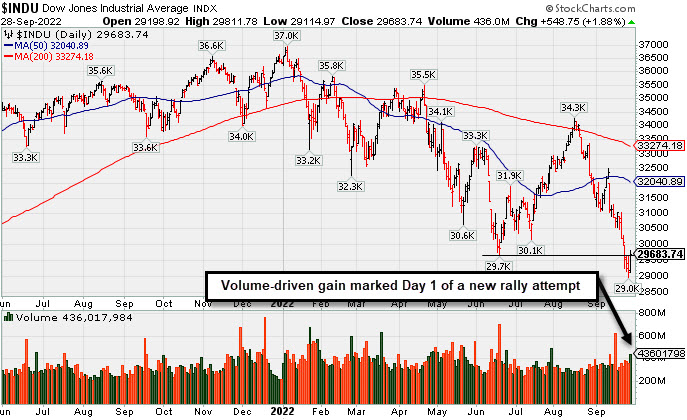 PICTURED: The Dow Jones Industrial Average posted a solid gain that marked Day 1 of a new rally attempt. Caution and patience remain paramount. Disciplined investors know to watch for a follow-through day of big gains on Day 4-7 of a new rally to confirm a new uptrend.
U.S. equities finished higher Wednesday as Wall Street recovered from the sell-off that has gripped markets since the U.S. Federal Reserve’s (Fed) 75-basis point (0.75%) rate hike last week. Also bolstering sentiment was a rally in Treasuries and the announcement that the Bank of England (BOE) will begin purchasing longer-dated U.K. government bonds to help stabilize markets.
On the data front, a first look at wholesale inventories for August showed a larger-than-anticipated 1.3% gain. Additionally, the advance goods trade balance showed the deficit narrowed to reflect a $87.3 billion shortfall. Pending home sales notched a larger-than-expected monthly decline of 2% in August.
Treasuries continued to rally after the BOE’s announcement. The yield on the benchmark 10-year note shed 25 basis points (0.25%) to 3.73%, notching its largest basis point drop since 2020. The 30-year bond yield declined 18 basis points (0.18%) to 3.68%. The yield on the policy-sensitive two-year note fell 19 basis points (0.19%) to 4.12% despite hawkish commentary from Fed officials. In commodities, West Texas Intermediate (WTI) crude added 4.5% to $82.03/barrel, rallying the most since July, amid tight supply conditions. U.S. oil production in the Gulf of Mexico shut down as Hurricane Ian made landfall in Florida as a category four storm this afternoon. Elsewhere, a report from the Energy Information Agency (EIA) showed domestic crude stockpiles unexpectedly fell by 215,000 barrels in the recent week, while gasoline inventories declined by 2.4 million barrels. A gauge of the U.S. dollar declined 1.2%, further boosting oil prices. |
 Kenneth J. Gruneisen started out as a licensed stockbroker in August 1987, a couple of months prior to the historic stock market crash that took the Dow Jones Industrial Average down -22.6% in a single day. He has published daily fact-based fundamental and technical analysis on high-ranked stocks online for two decades. Through FACTBASEDINVESTING.COM, Kenneth provides educational articles, news, market commentary, and other information regarding proven investment systems that work in good times and bad.
Comments contained in the body of this report are technical opinions only and are not necessarily those of Gruneisen Growth Corp. The material herein has been obtained from sources believed to be reliable and accurate, however, its accuracy and completeness cannot be guaranteed. Our firm, employees, and customers may effect transactions, including transactions contrary to any recommendation herein, or have positions in the securities mentioned herein or options with respect thereto. Any recommendation contained in this report may not be suitable for all investors and it is not to be deemed an offer or solicitation on our part with respect to the purchase or sale of any securities. |
|
 |
Commodity-Linked Groups Led Widespread Gains
Kenneth J. Gruneisen - Passed the CAN SLIM® Master's Exam
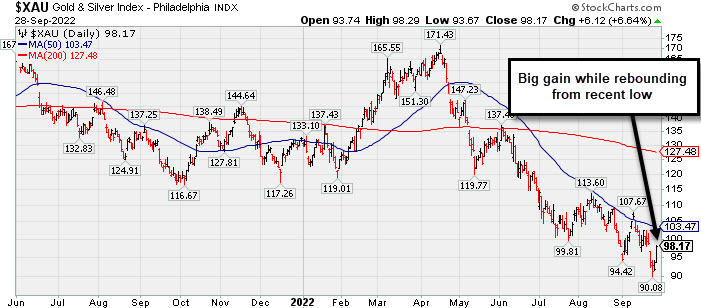
The Retail Index ($RLX +3.48%), Bank Index ($BKX +2.09%), and Broker/Dealer Index ($XBD +1.68%) posted influential gains that lifted the major averages. Commodity-linked groups were big standout gainers as the Gold & Silver Index ($XAU +6.64%), Oil Services Index ($OSX +5.53%), and Integrated Oil Index ($XOI +5.16%) each posted gains of greater than +5%. The Biotech Index ($BTK +3.87%) and Networking Index ($NWX +3.03%) led the tech sector higher while the Semiconductor Index ($SOX +1.22%) posted a smaller gain.
PICTURED: The Gold & Silver Index ($XAU +6.64%) posted a big gain today, rebounding from the recent low.
| Oil Services |
$OSX |
60.06 |
+3.15 |
+5.53% |
+13.93% |
| Integrated Oil |
$XOI |
1,511.29 |
+74.11 |
+5.16% |
+28.27% |
| Semiconductor |
$SOX |
2,427.26 |
+29.21 |
+1.22% |
-38.49% |
| Networking |
$NWX |
738.84 |
+21.76 |
+3.03% |
-23.92% |
| Broker/Dealer |
$XBD |
418.14 |
+6.91 |
+1.68% |
-14.12% |
| Retail |
$RLX |
3,078.14 |
+103.52 |
+3.48% |
-27.17% |
| Gold & Silver |
$XAU |
98.17 |
+6.12 |
+6.64% |
-25.88% |
| Bank |
$BKX |
98.17 |
+2.01 |
+2.09% |
-25.75% |
| Biotech |
$BTK |
4,595.93 |
+171.44 |
+3.87% |
-16.72% |
|
|
|
 |
Featured Stocks
Kenneth J. Gruneisen - Passed the CAN SLIM® Master's Exam
|
|
|
Color Codes Explained :
Y - Better candidates highlighted by our
staff of experts.
G - Previously featured
in past reports as yellow but may no longer be buyable under the
guidelines.
***Last / Change / Volume data in this table is the closing quote data***
Symbol/Exchange
Company Name
Industry Group |
PRICE |
CHANGE
(%Change) |
Day High |
Volume
(% DAV)
(% 50 day avg vol) |
52 Wk Hi
% From Hi |
Featured
Date |
Price
Featured |
Pivot Featured |
|
Max Buy |
 CI
-
NYSE
CI
-
NYSE
Cigna Corp
Medical-Managed Care
|
$282.55
|
+4.93
1.78% |
$284.26
|
1,561,762
81.60% of 50 DAV
50 DAV is 1,914,000
|
$296.29
-4.64%
|
7/7/2022
|
$276.55
|
PP = $273.68
|
|
MB = $287.36
|
 Most Recent Note - 9/28/2022 5:58:11 PM
G - Posted a 2nd consecutive gain today, rebounding near its 50 DMA line ($283.56) which may now act as resistance after a streak of 6 consecutive damaging losses. Reported earnings for the Jun '22 quarter rose +19% on +5% sales revenues versus the year ago period, breaking a streak of 3 quarterly earnings increases above the +25% minimum guideline (C criteria), raising fundamental concerns.
>>> FEATURED STOCK ARTICLE : Found Support Above 50-Day Moving Average Line This Week - 9/16/2022 |
View all notes |
Set NEW NOTE alert |
Company Profile |
SEC
News |
Chart |
Request a new note
C
A
S
I |
ESQ
-
NASDAQ
Esquire Financial Hldgs
Finance-Commercial Loans
|
$37.28
|
-0.54
-1.43% |
$37.93
|
24,322
93.55% of 50 DAV
50 DAV is 26,000
|
$41.68
-10.56%
|
7/26/2022
|
$37.74
|
PP = $39.19
|
|
MB = $41.15
|
Most Recent Note - 9/28/2022 6:00:51 PM
G - Color code is changed to green after slumping below its 50 DMA line ($37.90) today raising greater concerns while sputtering below the pivot point. The market is in a correction (M criteria) and disciplined investors know to avoid new buying efforts until a new rally confirmed with a follow-through day.
>>> FEATURED STOCK ARTICLE : Thinly-Traded Esquire Still Perched Near High - 9/20/2022 |
View all notes |
Set NEW NOTE alert |
Company Profile |
SEC
News |
Chart |
Request a new note
C
A
S
I |
ENPH
-
NASDAQ
Enphase Energy Inc
Energy-Solar
|
$292.31
|
+7.50
2.63% |
$294.39
|
2,738,842
74.18% of 50 DAV
50 DAV is 3,692,000
|
$324.84
-10.01%
|
7/28/2022
|
$276.66
|
PP = $282.55
|
|
MB = $296.68
|
Most Recent Note - 9/28/2022 5:59:04 PM
Y - Posted a quiet gain today. Found support near its 50 DMA line ($286) after briefly undercutting prior lows in the $271-272 area. More damaging losses would raise greater concerns. Fundamentals remain strong. The market is in a correction (M criteria) and disciplined investors know to avoid new buying efforts until a new rally confirmed with a follow-through day. See the latest FSU analysis for more details and a new annotated graph.
>>> FEATURED STOCK ARTICLE : Found Support After Undercutting 50 DMA and Prior Low - 9/27/2022 |
View all notes |
Set NEW NOTE alert |
Company Profile |
SEC
News |
Chart |
Request a new note
C
A
S
I |
CCRN
-
NASDAQ
Cross Country Healthcare
DIVERSIFIED SERVICES - Staffing and Outsourcing Service
|
$28.88
|
+1.12
4.03% |
$29.09
|
547,564
60.77% of 50 DAV
50 DAV is 901,000
|
$30.51
-5.34%
|
9/9/2022
|
$27.32
|
PP = $30.61
|
|
MB = $32.14
|
Most Recent Note - 9/28/2022 5:56:33 PM
Y - Posted a 3rd consecutive gain with below average volume. Its 50 DMA line ($26) defines important near-term support where a violation would raise concerns and trigger a technical sell signal. Volume totals have been cooling while still consolidating within striking distance of prior highs in the $30 area. Recently reported insider buying is a reassuring sign. The market is in a correction (M criteria) and disciplined investors know to avoid new buying efforts until a new rally confirmed with a follow-through day.
>>> FEATURED STOCK ARTICLE : Positive Reversal While Consolidating Above 50-Day Moving Average - 9/12/2022 |
View all notes |
Set NEW NOTE alert |
Company Profile |
SEC
News |
Chart |
Request a new note
C
A
S
I |
|
|
|
THESE ARE NOT BUY RECOMMENDATIONS!
Comments contained in the body of this report are technical
opinions only. The material herein has been obtained
from sources believed to be reliable and accurate, however,
its accuracy and completeness cannot be guaranteed.
This site is not an investment advisor, hence it does
not endorse or recommend any securities or other investments.
Any recommendation contained in this report may not
be suitable for all investors and it is not to be deemed
an offer or solicitation on our part with respect to
the purchase or sale of any securities. All trademarks,
service marks and trade names appearing in this report
are the property of their respective owners, and are
likewise used for identification purposes only.
This report is a service available
only to active Paid Premium Members.
You may opt-out of receiving report notifications
at any time. Questions or comments may be submitted
by writing to Premium Membership Services 665 S.E. 10 Street, Suite 201 Deerfield Beach, FL 33441-5634 or by calling 1-800-965-8307
or 954-785-1121.
|
|
|