You are not logged in.
This means you
CAN ONLY VIEW reports that were published prior to Friday, March 28, 2025.
You
MUST UPGRADE YOUR MEMBERSHIP if you want to see any current reports.
AFTER MARKET UPDATE - FRIDAY, SEPTEMBER 16TH, 2011
Previous After Market Report Next After Market Report >>>
|
|
|
|
DOW |
+75.91 |
11,509.09 |
+0.66% |
|
Volume |
1,813,528,240 |
+88% |
|
Volume |
2,121,615,540 |
+11% |
|
NASDAQ |
+15.24 |
2,622.31 |
+0.58% |
|
Advancers |
1,519 |
49% |
|
Advancers |
1,388 |
51% |
|
S&P 500 |
+6.90 |
1,216.01 |
+0.57% |
|
Decliners |
1,474 |
48% |
|
Decliners |
1,231 |
45% |
|
Russell 2000 |
+0.80 |
714.31 |
+0.11% |
|
52 Wk Highs |
39 |
|
|
52 Wk Highs |
30 |
|
|
S&P 600 |
-0.15 |
389.64 |
-0.04% |
|
52 Wk Lows |
20 |
|
|
52 Wk Lows |
50 |
|
|
 |
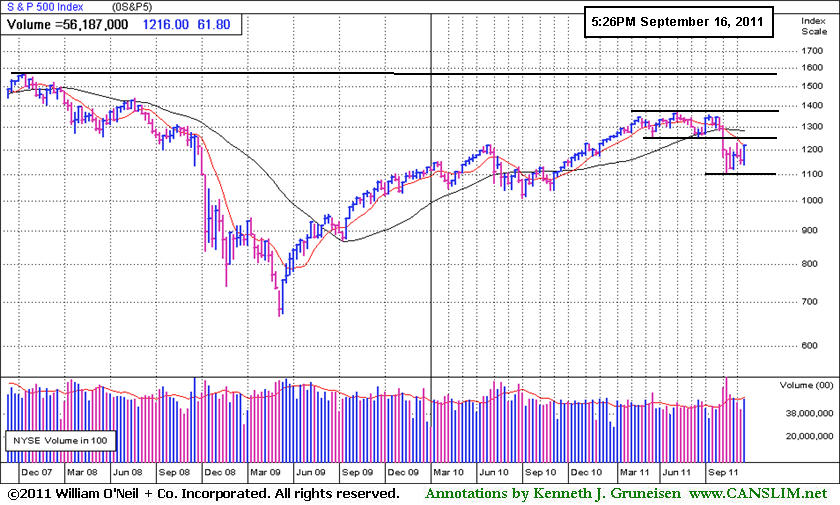
Major Averages Extend Winning Streak to Five Days
Kenneth J. Gruneisen - Passed the CAN SLIM® Master's Exam
For the week, the Dow Jones Industrial Average gained 516 points, or +4.7%. The S&P 500 Index was up 61 points, or +5.4%. And the Nasdaq Composite Index was up 154 for the week, or +6.3%. Friday's reported volume totals were heavier on the NYSE and on the Nasdaq exchange, inflated by options expirations, yet serving as an indication of better buying demand from the institutional crowd. Advancing issues beat decliners by 16-15 on the NYSE and by 7-6 on the Nasdaq exchange. New 52-week lows outnumbered new 52-week highs on the Nasdaq exchange while new highs led new lows on the NYSE. There were 28 high-ranked companies from the CANSLIM.net Leaders List that made new 52-week highs and appeared on the CANSLIM.net BreakOuts Page, up from the prior session total of 19 stocks. Any sustainable rally requires a healthy crop of strong leaders hitting new 52-week highs, so the improvement was an encouraging sign. There were gains from 6 of the 12 high-ranked companies currently included on the Featured Stocks Page.
The only economic report on Friday was the University of Michigan's initial reading of September consumer sentiment which rose to 57.8, better than the 56.9 that analysts forecast. European finance ministers turned aside a proposal by U.S. Treasury Secretary Timothy Geithner to increase the firepower of the debt crisis rescue fund.
Questions continue to plague the financial sector. Bank stocks dropped after European finance ministers gave no indication of providing further aid to lenders to go along with yesterday's lifeline by the European Central Bank. An official in Greece said the country may have to tap a bank fund for cash while it waits for its next segment of loan funding.
The major stock averages added to gains in the last few minutes on Friday as they ran their winning streaks to five. Retail and household product stocks took a turn at the head of the class after a report that consumer sentiment increased more than expected this month. Amazon.com (AMZN +5.3%). Procter & Gamble (PG +2.47%). Industrial stocks were also in the spotlight after a report that United Technologies (UTX -0.15%) is lining up as much as $20 billion for an acquisition. Research in Motion Ltd (RIMM -18.99%) dove after earnings disappointed investors.
The market environment (M criteria) remains in an uptrend despite recent pressure, and disciplined investors may carefully consider new buying efforts when all key criteria are satisfied. While it is encouraging that the major averages have been keeping the rally alive by staying well above their Day 1 (8/09/11) lows, a further expansion in leadership (new 52-week highs) remains crucial to any sustained advance.
The September 2011 issue of CANSLIM.net News will be available soon. The Q3 2011 Webcast has also been scheduled for Wednesday, September 28th at 8PM EST. Links to all prior reports and webcasts are available on the Premium Member Homepage.
PICTURED: Friday's session extended the S&P 500’s longest rally since July. The weekly graph above gives a longer-term perspective of where it stands versus the daily graph shown in yesterday's commentary (read here).
|
 Kenneth J. Gruneisen started out as a licensed stockbroker in August 1987, a couple of months prior to the historic stock market crash that took the Dow Jones Industrial Average down -22.6% in a single day. He has published daily fact-based fundamental and technical analysis on high-ranked stocks online for two decades. Through FACTBASEDINVESTING.COM, Kenneth provides educational articles, news, market commentary, and other information regarding proven investment systems that work in good times and bad.
Comments contained in the body of this report are technical opinions only and are not necessarily those of Gruneisen Growth Corp. The material herein has been obtained from sources believed to be reliable and accurate, however, its accuracy and completeness cannot be guaranteed. Our firm, employees, and customers may effect transactions, including transactions contrary to any recommendation herein, or have positions in the securities mentioned herein or options with respect thereto. Any recommendation contained in this report may not be suitable for all investors and it is not to be deemed an offer or solicitation on our part with respect to the purchase or sale of any securities. |
|
 |
RLX Rings Up Another Gain; Mixed Action as Financials Bounce From Lows
Kenneth J. Gruneisen - Passed the CAN SLIM® Master's Exam
The Retail Index ($RLX +1.64%) led the way with a solid gain that definitely underpinned the major averages' gains on Friday. An annotated graph of the RLX illustrating its bullish action was included in yesterday's "Industry Group Watch" section - (read here). Mixed action in the financial group resulted in a small loss for the Bank Index ($BKX -0.51%) while the Broker/Dealer Index ($XBD +0.32%) inched higher (more on the Financials below). The Networking Index ($NWX -1.24%) and the Biotechnology Index ($BTK -0.74%) suffered losses while the Semiconductor Index ($SOX +0.22%) and Internet Index ($IIX +0.35%) posted small gains. The Oil Services Index ($OSX -0.78%) and Integrated Oil Index ($XOI -0.25%) edged lower while the Healthcare Index ($HMO +0.86%) and Gold & Silver Index ($XAU +1.11%) posted gains.
Charts courtesy www.stockcharts.com
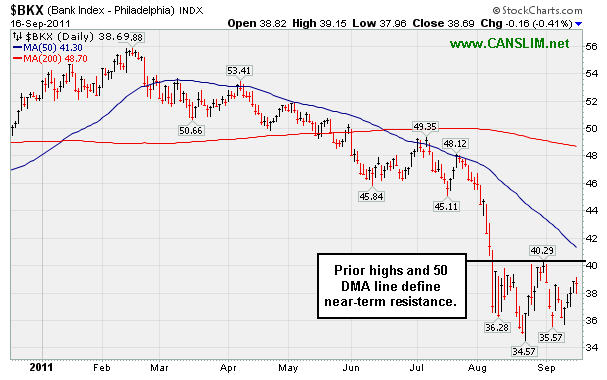
PICTURED 1: The Bank Index ($BKX -0.51%) faces near-term resistance at its recent high and its 50-day moving average line. Subsequent gains above those levels would be a very reassuring sign that the market's health is improving, while the outlook worsens and leads to a more ominous Bear Market if the August lows are violated.
Charts courtesy www.stockcharts.com
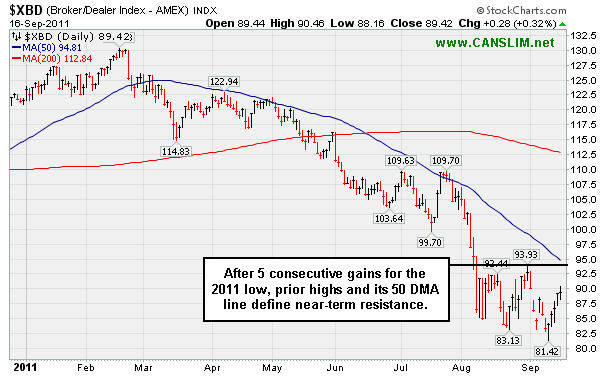
PICTURED 2: The Broker/Dealer Index ($XBD +0.32%) has strung together a streak of 5 consecutive gains from the low. Prior highs and its 50 DMA line define near-term resistance. Subsequent progress above those levels could lead to better upward momentum in the broader market.
| Oil Services |
$OSX |
235.87 |
-1.85 |
-0.78% |
-3.77% |
| Healthcare |
$HMO |
2,095.13 |
+17.89 |
+0.86% |
+23.83% |
| Integrated Oil |
$XOI |
1,148.84 |
-2.92 |
-0.25% |
-5.30% |
| Semiconductor |
$SOX |
381.91 |
+0.82 |
+0.22% |
-7.26% |
| Networking |
$NWX |
241.80 |
-3.03 |
-1.24% |
-13.81% |
| Internet |
$IIX |
290.30 |
+1.01 |
+0.35% |
-5.66% |
| Broker/Dealer |
$XBD |
89.42 |
+0.28 |
+0.32% |
-26.41% |
| Retail |
$RLX |
532.67 |
+8.57 |
+1.64% |
+4.78% |
| Gold & Silver |
$XAU |
217.56 |
+2.38 |
+1.11% |
-3.98% |
| Bank |
$BKX |
38.65 |
-0.20 |
-0.51% |
-25.97% |
| Biotech |
$BTK |
1,191.80 |
-8.83 |
-0.74% |
-8.16% |
|
|
|
 |
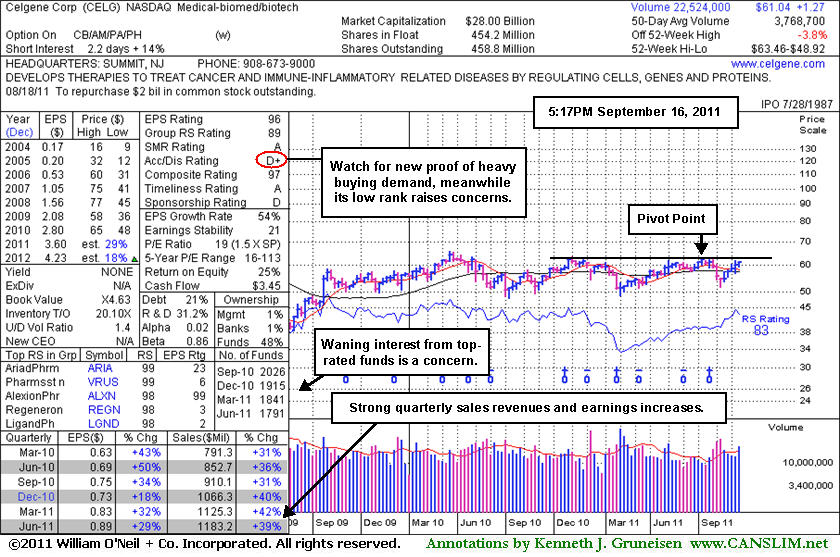
Fundamentals Are Strong While Technical Action Has Yet To Confirm
Kenneth J. Gruneisen - Passed the CAN SLIM® Master's Exam
Often, when a leading stock is setting up to breakout of a solid base, it is highlighted in CANSLIM.net's Mid-Day Breakouts Report. The most relevant factors are noted in the report which allows prudent CANSLIM oriented investors to place the issue in their watch list. After doing any necessary backup research, the investor is prepared to act if and when the stock triggers a technical buy signal (breaks above its pivot point on more than +50% average turnover). In the event the stock fails to trigger a technical buy signal and its price declines then it will simply be removed from the watch list.
Celgene Corp (CELG +$0.85 or +1.40% to $61.18) was highlighted in yellow in today's mid-day report with a pivot point cited based on its 52-week high plus 10 cents. It is perched within close striking distance of previously stubborn resistance in the $62 area. Quarterly and annual earnings history has remained strong while it survived but failed to impress since it was dropped from the Featured Stocks list on 10/06/08. Its Accumulation/Distribution Rating of D+ is a concern, as is waning ownership by top-rated funds as indicated on the annotated weekly graph below. This stock's past serves as a reminder again now that fresh proof of institutional buying demand is worth waiting for, and there is not an advantage to be gained by getting in "early" before a proper technical buy signal occurs.
Disciplined investors may note that CELG did not confirm a proper technical buy signal after it was featured in the August 2008 CANSLIM.net News, whereas the detailed report's "Technical Analysis" area included the note - "Confirming gains to all-time highs with great volume conviction would be a nice reassurance that it is capable of a meaningful advance" (read here).
|
|
|
Color Codes Explained :
Y - Better candidates highlighted by our
staff of experts.
G - Previously featured
in past reports as yellow but may no longer be buyable under the
guidelines.
***Last / Change / Volume data in this table is the closing quote data***
Symbol/Exchange
Company Name
Industry Group |
PRICE |
CHANGE
(%Change) |
Day High |
Volume
(% DAV)
(% 50 day avg vol) |
52 Wk Hi
% From Hi |
Featured
Date |
Price
Featured |
Pivot Featured |
|
Max Buy |
AAPL
-
NASDAQ
Apple Inc
COMPUTER HARDWARE - Personal Computers
|
$400.50
|
+7.54
1.92% |
$400.50
|
24,893,708
115.99% of 50 DAV
50 DAV is 21,462,600
|
$404.50
-0.99%
|
9/16/2011
|
$399.14
|
PP = $404.60
|
|
MB = $424.83
|
 Most Recent Note - 9/16/2011 12:12:38 PM
Y - Approaching its 52-week high with today's 5th consecutive gain after finding support near its 50 DMA line and prior chart highs during its 8-week consolidation. Color code is changed to yellow with pivot point based on its 52-week high plus 10 cents. Volume-driven gains above its pivot point may trigger a technical buy signal, but disciplined investors will watch for fresh proof of heavy buying demand before taking action. Recently rallied after reporting very strong earnings +122% on +82% sales revenues for the quarter ended June 30, 2011 versus the year ago period. Stellar earnings track record that solidly satisfies the C and A criteria. However, it is already heavily owned by the institutional crowd, and ownership by top-rated funds fell from 4,365 in Mar '11 to 4,347 in Jun '11.
>>> The latest Featured Stock Update with an annotated graph appeared on 8/9/2010. Click here.
View all notes |
Alert me of new notes |
CANSLIM.net Company Profile |
SEC |
Zacks Reports |
StockTalk |
News |
Chart |
Request a new note
C
A N
S L
I M


|
ALXN
-
NASDAQ
Alexion Pharmaceuticals
DRUGS - Drug Manufacturers - Other
|
$62.07
|
-2.01
-3.14% |
$63.74
|
2,319,318
146.01% of 50 DAV
50 DAV is 1,588,500
|
$64.17
-3.27%
|
9/15/2011
|
$63.20
|
PP = $60.81
|
|
MB = $63.85
|
Most Recent Note - 9/16/2011 12:17:12 PM
Y - Pulling back today after breaking out from a cup-with-high-handle as it gapped up on the prior session and triggered a technical buy signal. Its strong quarterly and annual earnings history satisfies the C and A criteria. See the latest FSU analysis for more details and a new annotated graph.
>>> The latest Featured Stock Update with an annotated graph appeared on 9/15/2011. Click here.
View all notes |
Alert me of new notes |
CANSLIM.net Company Profile |
SEC |
Zacks Reports |
StockTalk |
News |
Chart |
Request a new note
C
A N
S L
I M
|
ATHN
-
NASDAQ
Athenahealth Inc
DIVERSIFIED SERVICES - Business/Management Services
|
$68.69
|
+1.98
2.97% |
$68.92
|
850,549
118.35% of 50 DAV
50 DAV is 718,700
|
$67.87
1.21%
|
9/8/2011
|
$61.93
|
PP = $61.78
|
|
MB = $64.87
|
Most Recent Note - 9/16/2011 4:12:49 PM
G - A small gain today backed by above average volume led to yet another new all-time high, getting more extended from its prior base. Disciplined investors use a tactic called "pyramiding" to avoid chasing stocks more than +5% above prior highs. Always minimize losses by selling if any stock falls -7% from their buy point.
>>> The latest Featured Stock Update with an annotated graph appeared on 9/8/2011. Click here.
View all notes |
Alert me of new notes |
CANSLIM.net Company Profile |
SEC |
Zacks Reports |
StockTalk |
News |
Chart |
Request a new note
C
A N
S L
I M
|
CELG
-
NASDAQ
Celgene Corp
DRUGS - Drug Manufacturers - Major
|
$61.04
|
+0.71
1.18% |
$61.49
|
4,281,501
113.61% of 50 DAV
50 DAV is 3,768,700
|
$63.46
-3.81%
|
9/16/2011
|
$61.21
|
PP = $62.59
|
|
MB = $65.72
|
Most Recent Note - 9/16/2011 12:36:50 PM
Y - Color code is changed to yellow with pivot point cited based on its 52-week high plus 10 cents. It is perched within close striking distance of previously stubborn resistance in the $62 area. Quarterly and annual earnings history has remained strong while it survived but failed to impress since it was dropped from the Featured Stocks list on 10/06/08. See the Featured Stock Update section of the 9/23/08 CANSLIM.net After Market Update for analysis and an annotated graph (read here). Disciplined investors may note that CELG did not confirm a proper technical buy signal after it was featured in the August 2008 CANSLIM.net News, whereas the detailed report's "Technical Analysis" area included the note - "Confirming gains to all-time highs with great volume conviction would be a nice reassurance that it is capable of a meaningful advance" (read here).
>>> The latest Featured Stock Update with an annotated graph appeared on 9/16/2011. Click here.
View all notes |
Alert me of new notes |
CANSLIM.net Company Profile |
SEC |
Zacks Reports |
StockTalk |
News |
Chart |
Request a new note
C
A N
S L
I M
|
DMND
-
NASDAQ
Diamond Foods Inc
FOOD and; BEVERAGE - Processed and; Packaged Goods
|
$87.30
|
+9.07
11.59% |
$90.33
|
2,802,858
1,281.60% of 50 DAV
50 DAV is 218,700
|
$80.16
8.91%
|
9/13/2011
|
$75.57
|
PP = $80.16
|
|
MB = $84.17
|
Most Recent Note - 9/16/2011 12:53:22 PM
Y - Reported earnings +53% on +32% sales revenues for the quarter ended July 31, 2011 versus the year ago period. Today's considerable "breakaway gap" with heavy volume cleared its pivot point and triggered a technical buy signal. Breakaway gaps are one exception where chasing a stock more than 5% above prior highs may be permitted, but risk increases when doing so that an ordinary pullback may prompt investors to sell per the system's selling rules.
>>> The latest Featured Stock Update with an annotated graph appeared on 9/13/2011. Click here.
View all notes |
Alert me of new notes |
CANSLIM.net Company Profile |
SEC |
Zacks Reports |
StockTalk |
News |
Chart |
Request a new note
C
A N
S L
I M
|
Symbol/Exchange
Company Name
Industry Group |
PRICE |
CHANGE
(%Change) |
Day High |
Volume
(% DAV)
(% 50 day avg vol) |
52 Wk Hi
% From Hi |
Featured
Date |
Price
Featured |
Pivot Featured |
|
Max Buy |
EXLS
-
NASDAQ
Exlservice Holdings Inc
DIVERSIFIED SERVICES - Business/Management Services
|
$22.90
|
+0.10
0.44% |
$22.95
|
219,288
126.46% of 50 DAV
50 DAV is 173,400
|
$26.55
-13.75%
|
8/2/2011
|
$24.85
|
PP = $24.85
|
|
MB = $26.09
|
Most Recent Note - 9/15/2011 12:36:41 PM
G - Still holding its ground above its 200 DMA line after pricing its previously noted Secondary Offering at $23.00. News of the offering was followed by a damaging gap down on 9/13/11, and it violated its 50 DMA line, raising concerns and triggering a technical sell signal. It is -14.3% off its 52-week high hit last week, and only a prompt rebound above its short-term average would help its outlook.
>>> The latest Featured Stock Update with an annotated graph appeared on 9/7/2011. Click here.
View all notes |
Alert me of new notes |
CANSLIM.net Company Profile |
SEC |
Zacks Reports |
StockTalk |
News |
Chart |
Request a new note
C
A N
S L
I M
|
FCFS
-
NASDAQ
First Cash Financial Svs
SPECIALTY RETAIL - Specialty Retail, Other
|
$50.60
|
-0.16
-0.32% |
$51.73
|
512,920
139.04% of 50 DAV
50 DAV is 368,900
|
$52.06
-2.80%
|
5/31/2011
|
$42.00
|
PP = $40.23
|
|
MB = $42.24
|
Most Recent Note - 9/14/2011 3:55:33 PM
G - Spiking to a new all-time high today with above average volume behind its gain. It is extended from its prior base, and its 50 DMA line defines support to watch.
>>> The latest Featured Stock Update with an annotated graph appeared on 9/6/2011. Click here.
View all notes |
Alert me of new notes |
CANSLIM.net Company Profile |
SEC |
Zacks Reports |
StockTalk |
News |
Chart |
Request a new note
C
A N
S L
I M
|
JCOM
-
NASDAQ
J 2 Global Communication
INTERNET - Internet Software and Services
|
$31.84
|
-0.02
-0.06% |
$32.67
|
577,804
136.76% of 50 DAV
50 DAV is 422,500
|
$32.64
-2.45%
|
8/8/2011
|
$30.38
|
PP = $29.31
|
|
MB = $30.78
|
Most Recent Note - 9/16/2011 1:12:53 PM
G - Hovering near its 52-week high today with no resistance remaining due to overhead supply. Previous highs in the $30-31 area define initial chart support to watch above its closely coinciding 50 and 200 DMA lines.
>>> The latest Featured Stock Update with an annotated graph appeared on 8/29/2011. Click here.
View all notes |
Alert me of new notes |
CANSLIM.net Company Profile |
SEC |
Zacks Reports |
StockTalk |
News |
Chart |
Request a new note
C
A N
S L
I M
|
MA
-
NYSE
Mastercard Inc Cl A
DIVERSIFIED SERVICES - Business/Management Services
|
$346.95
|
-0.99
-0.28% |
$352.00
|
5,244,844
356.67% of 50 DAV
50 DAV is 1,470,500
|
$349.56
-0.75%
|
8/3/2011
|
$324.82
|
PP = $322.38
|
|
MB = $338.50
|
Most Recent Note - 9/16/2011 1:17:39 PM
G - Pulling back today from the new all-time high hit with the prior session's volume-driven gain and rally well above its "max buy" level.
>>> The latest Featured Stock Update with an annotated graph appeared on 9/12/2011. Click here.
View all notes |
Alert me of new notes |
CANSLIM.net Company Profile |
SEC |
Zacks Reports |
StockTalk |
News |
Chart |
Request a new note
C
A N
S L
I M
|
MG
-
NYSE
Mistras Group Inc
DIVERSIFIED SERVICES - Bulding and Faci;ity Management Services
|
$19.91
|
-0.18
-0.90% |
$20.37
|
100,611
56.40% of 50 DAV
50 DAV is 178,400
|
$20.82
-4.37%
|
8/10/2011
|
$17.89
|
PP = $17.58
|
|
MB = $18.46
|
Most Recent Note - 9/13/2011 7:36:22 PM
G - Still holding its ground stubbornly near its 52-week high. Prior resistance in the $18 area and its 50 DMA line define important chart support to watch on pullbacks.
>>> The latest Featured Stock Update with an annotated graph appeared on 9/9/2011. Click here.
View all notes |
Alert me of new notes |
CANSLIM.net Company Profile |
SEC |
Zacks Reports |
StockTalk |
News |
Chart |
Request a new note
C
A N
S L
I M
|
Symbol/Exchange
Company Name
Industry Group |
PRICE |
CHANGE
(%Change) |
Day High |
Volume
(% DAV)
(% 50 day avg vol) |
52 Wk Hi
% From Hi |
Featured
Date |
Price
Featured |
Pivot Featured |
|
Max Buy |
MKTX
-
NASDAQ
Marketaxess Holdings Inc
FINANCIAL SERVICES - Investment Brokerage - Nationa
|
$27.65
|
-1.88
-6.37% |
$28.29
|
1,006,782
388.12% of 50 DAV
50 DAV is 259,400
|
$30.95
-10.66%
|
7/29/2011
|
$25.87
|
PP = $26.35
|
|
MB = $27.67
|
Most Recent Note - 9/16/2011 11:43:17 AM
G - Gapped down today following news of a Secondary Offering of 950,000 shares priced at $28.65. Prior resistance in the $26 area and its 50 DMA line define important chart support to watch.
>>> The latest Featured Stock Update with an annotated graph appeared on 9/2/2011. Click here.
View all notes |
Alert me of new notes |
CANSLIM.net Company Profile |
SEC |
Zacks Reports |
StockTalk |
News |
Chart |
Request a new note
C
A N
S L
I M
|
PSMT
-
NASDAQ
Pricesmart Inc
RETAIL - Drug Stores
|
$73.28
|
+0.54
0.74% |
$73.93
|
984,876
329.17% of 50 DAV
50 DAV is 299,200
|
$73.19
0.12%
|
8/30/2011
|
$63.01
|
PP = $62.37
|
|
MB = $65.49
|
Most Recent Note - 9/14/2011 12:24:37 PM
G - Rallying even higher today, on track for a 7th consecutive gain backed by above average volume, getting more extended from its prior base. Prior highs and its 50 DMA line define support levels to watch on pullbacks.
>>> The latest Featured Stock Update with an annotated graph appeared on 9/14/2011. Click here.
View all notes |
Alert me of new notes |
CANSLIM.net Company Profile |
SEC |
Zacks Reports |
StockTalk |
News |
Chart |
Request a new note
C
A N
S L
I M
|
|
|
|
THESE ARE NOT BUY RECOMMENDATIONS!
Comments contained in the body of this report are technical
opinions only. The material herein has been obtained
from sources believed to be reliable and accurate, however,
its accuracy and completeness cannot be guaranteed.
This site is not an investment advisor, hence it does
not endorse or recommend any securities or other investments.
Any recommendation contained in this report may not
be suitable for all investors and it is not to be deemed
an offer or solicitation on our part with respect to
the purchase or sale of any securities. All trademarks,
service marks and trade names appearing in this report
are the property of their respective owners, and are
likewise used for identification purposes only.
This report is a service available
only to active Paid Premium Members.
You may opt-out of receiving report notifications
at any time. Questions or comments may be submitted
by writing to Premium Membership Services 665 S.E. 10 Street, Suite 201 Deerfield Beach, FL 33441-5634 or by calling 1-800-965-8307
or 954-785-1121.
|
|
|

