You are not logged in.
This means you
CAN ONLY VIEW reports that were published prior to Tuesday, April 15, 2025.
You
MUST UPGRADE YOUR MEMBERSHIP if you want to see any current reports.
AFTER MARKET UPDATE - THURSDAY, SEPTEMBER 15TH, 2011
Previous After Market Report Next After Market Report >>>
|
|
|
|
DOW |
+186.45 |
11,433.18 |
+1.66% |
|
Volume |
963,937,970 |
-11% |
|
Volume |
1,910,379,330 |
-18% |
|
NASDAQ |
+34.52 |
2,607.07 |
+1.34% |
|
Advancers |
2,283 |
74% |
|
Advancers |
1,695 |
64% |
|
S&P 500 |
+20.43 |
1,209.11 |
+1.72% |
|
Decliners |
730 |
24% |
|
Decliners |
852 |
32% |
|
Russell 2000 |
+9.39 |
713.51 |
+1.33% |
|
52 Wk Highs |
26 |
|
|
52 Wk Highs |
24 |
|
|
S&P 600 |
+5.09 |
389.79 |
+1.32% |
|
52 Wk Lows |
17 |
|
|
52 Wk Lows |
57 |
|
|
 |
Major Averages Tally 4th Consecutive Gain With Positive Breadth
Kenneth J. Gruneisen - Passed the CAN SLIM® Master's Exam
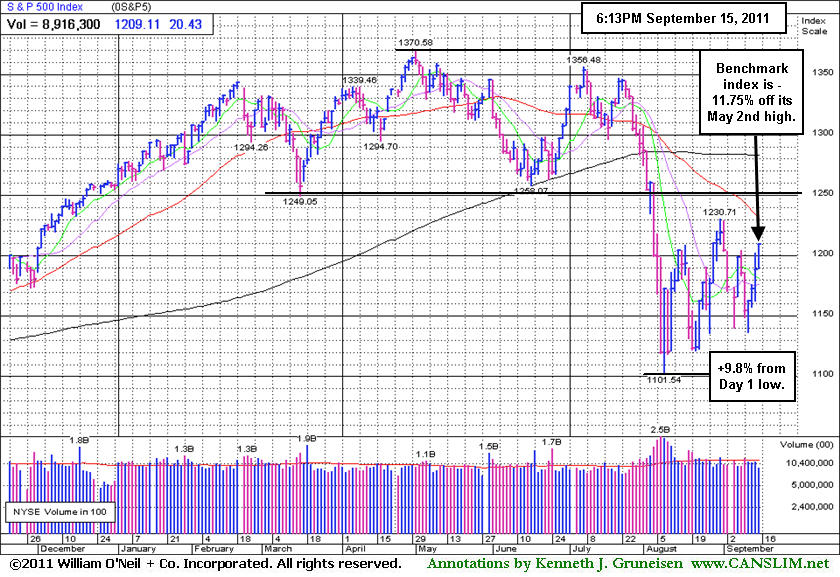
The major indices extended their winning streak for a 4th straight session on Thursday. Lighter volume totals were reported on the NYSE and on the Nasdaq exchange, Advancing issues beat decliners by 3-1 on the NYSE and by 2-1 on the Nasdaq exchange. The new 52-week lows totals still outnumbered rising new 52-week highs totals on the Nasdaq exchange, yet new 52-week highs outnumbered new lows on the NYSE. There were 19 high-ranked companies from the CANSLIM.net Leaders List that made new 52-week highs and appeared on the CANSLIM.net BreakOuts Page, up from the prior session total of 18 stocks. Any sustainable rally requires a healthy crop of strong leaders hitting new 52-week highs, as this commentary has repeated! High-ranked leadership, represented by the 10 companies currently included on the Featured Stocks Page, appeared to diverge from the session's broadly positive bias as there was an even mix of 5 gainers and 5 decliners.
Confidence grew that Europe will avoid disaster. Thursday's rally came after the European Central Bank led coordinated action to lend dollars to European banks. The announcement added to optimism that policy makers were containing the debt crisis after French and German leaders yesterday confirmed they will support Greece's continued participation in the euro.
Industrial production in the U.S. unexpectedly rose 0.8% in August. Analysts were expecting no change. That helped temper concerns about the labor market as initial jobless claims increased to the most since June. Manufacturing in the New York region contracted in September at a faster pace. The August consumer price index gained 0.4%, higher than expected. The annual increase in costs is now at the high end of the Fed's inflation target, which could limit the central bank's ability to take further steps to revive the economy.
Financial stocks were at the forefront of the advance after Europe took steps to support banks. UBS AG (UBS -10.02%) missed out on the rally. The Swiss bank said it could post a third quarter loss of $2 billion because of unauthorized trading. Netflix Inc (NFLX -18.91%) plunged after cutting its forecast for domestic subscribers.
The market environment (M criteria) remains in an uptrend despite recent pressure, and disciplined investors may carefully consider new buying efforts when all key criteria are satisfied. While it is encouraging that the major averages have been keeping the rally alive by staying well above their Day 1 (8/09/11) lows, a further expansion in leadership (new 52-week highs) remains crucial to any sustained advance.
The September 2011 issue of CANSLIM.net News will be available soon. The Q3 2011 Webcast has also been scheduled for Wednesday, September 28th at 8PM EST. Links to all prior reports and webcasts are available on the Premium Member Homepage.
PICTURED: The S&P 500 Index closed above 1,200, rallying back near the level where it was trading when Standard & Poor's downgraded U.S. debt. It is now +9.8% from its Day 1 low (8/09/11) yet still -11.75% from its May 2nd high.
|
 Kenneth J. Gruneisen started out as a licensed stockbroker in August 1987, a couple of months prior to the historic stock market crash that took the Dow Jones Industrial Average down -22.6% in a single day. He has published daily fact-based fundamental and technical analysis on high-ranked stocks online for two decades. Through FACTBASEDINVESTING.COM, Kenneth provides educational articles, news, market commentary, and other information regarding proven investment systems that work in good times and bad.
Comments contained in the body of this report are technical opinions only and are not necessarily those of Gruneisen Growth Corp. The material herein has been obtained from sources believed to be reliable and accurate, however, its accuracy and completeness cannot be guaranteed. Our firm, employees, and customers may effect transactions, including transactions contrary to any recommendation herein, or have positions in the securities mentioned herein or options with respect thereto. Any recommendation contained in this report may not be suitable for all investors and it is not to be deemed an offer or solicitation on our part with respect to the purchase or sale of any securities. |
|
 |
Financial, Retail, Tech, Healthcare, and Energy Groups Rose Again
Kenneth J. Gruneisen - Passed the CAN SLIM® Master's Exam
The Bank Index ($BKX +2.29%) and Broker/Dealer Index ($XBD +2.90%) posted solid gains on Thursday that underpinned the ongoing rally for the major averages. The Retail Index ($RLX +1.47%) and Healthcare Index ($HMO +2.67%) also charged higher. The tech sector had a positive bias as the Networking Index ($NWX +0.75%), Biotechnology Index ($BTK +1.05%), Internet Index ($IIX +1.18%), and Semiconductor Index ($SOX +1.43%) posted unanimous gains. Energy-related shares rose and boosted the Oil Services Index ($OSX +1.59%) and Integrated Oil Index ($XOI +2.27%) higher. The broad gains elsewhere made the Gold & Silver Index ($XAU +0.18%) a laggard as it barely inched higher.
Charts courtesy www.stockcharts.com
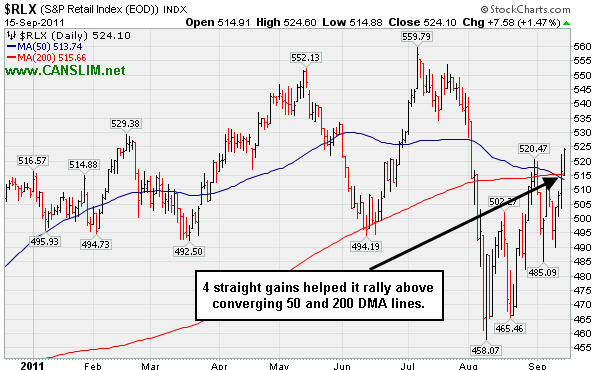
PICTURED: The Retail Index ($RLX +1.47%) has rallied above its converging 50-day and 200-day moving average (DMA) lines with a streak of 4 consecutive gains.
| Oil Services |
$OSX |
237.72 |
+3.72 |
+1.59% |
-3.02% |
| Healthcare |
$HMO |
2,077.25 |
+54.04 |
+2.67% |
+22.77% |
| Integrated Oil |
$XOI |
1,151.76 |
+25.61 |
+2.27% |
-5.06% |
| Semiconductor |
$SOX |
381.09 |
+5.36 |
+1.43% |
-7.46% |
| Networking |
$NWX |
244.83 |
+1.82 |
+0.75% |
-12.73% |
| Internet |
$IIX |
289.29 |
+3.36 |
+1.18% |
-5.99% |
| Broker/Dealer |
$XBD |
89.14 |
+2.51 |
+2.90% |
-26.64% |
| Retail |
$RLX |
524.10 |
+7.58 |
+1.47% |
+3.09% |
| Gold & Silver |
$XAU |
215.18 |
+0.38 |
+0.18% |
-5.03% |
| Bank |
$BKX |
38.85 |
+0.87 |
+2.29% |
-25.59% |
| Biotech |
$BTK |
1,200.63 |
+12.52 |
+1.05% |
-7.47% |
|
|
|
 |
Fundamentally Strong Leader Rises From Cup-With-High-Handle
Kenneth J. Gruneisen - Passed the CAN SLIM® Master's Exam
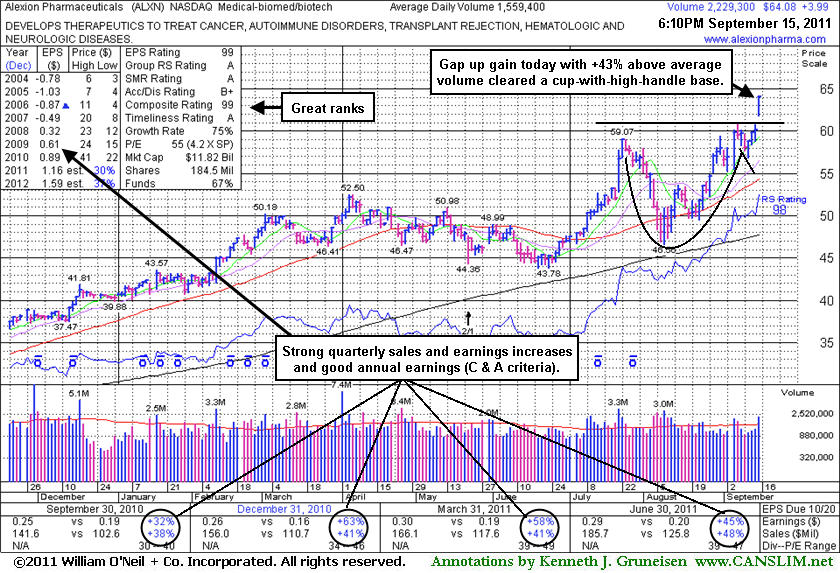
Alexion Pharmaceuticals (ALXN +$3.99 or +5.18% to $63.98 ) was featured in yellow in the earlier mid-day report (read here). Its strong quarterly and annual earnings history satisfies the C and A criteria. It recently found support above its 200 DMA line and rose from a consolidation resembling a cup-with-high-handle as it gapped up today and hit a new all-time high. Its strong finish above the new pivot point ($60.81) cited was backed by +43% above average volume that confirmed a technical buy signal. The number of top-rated funds owning its shares rose from 881 in Dec '10 to 1,051 in Jun '11, a reassuring sign concerning the I criteria of the fact-based investment system. Its current Up/Down Volume Ratio of 1.5 is a reassuring unbiased sign of institutional accumulation. Disciplined investors avoid chasing stocks more than +5% above their prior highs and always limit losses by selling if any stock falls more than -7% from their purchase price. Patience may allow investors to accumulate shares on pullbacks near prior highs rather than chasing it beyond the "max buy" level ($63.85).
|
|
|
Color Codes Explained :
Y - Better candidates highlighted by our
staff of experts.
G - Previously featured
in past reports as yellow but may no longer be buyable under the
guidelines.
***Last / Change / Volume data in this table is the closing quote data***
Symbol/Exchange
Company Name
Industry Group |
PRICE |
CHANGE
(%Change) |
Day High |
Volume
(% DAV)
(% 50 day avg vol) |
52 Wk Hi
% From Hi |
Featured
Date |
Price
Featured |
Pivot Featured |
|
Max Buy |
ALXN
-
NASDAQ
Alexion Pharmaceuticals
DRUGS - Drug Manufacturers - Other
|
$64.08
|
+3.99
6.64% |
$64.17
|
2,229,653
142.98% of 50 DAV
50 DAV is 1,559,400
|
$60.81
5.38%
|
9/15/2011
|
$63.20
|
PP = $60.81
|
|
MB = $63.85
|
 Most Recent Note - 9/15/2011 6:47:56 PM
Y - Its strong quarterly and annual earnings history satisfies the C and A criteria. It recently found support above its 200 DMA line and rose from a consolidation resembling a cup-with-high-handle as it gapped up today, hitting a new all-time high with +43% above average volume triggering a technical buy signal. See the latest FSU analysis for more details and a new annotated graph.
>>> The latest Featured Stock Update with an annotated graph appeared on 9/15/2011. Click here.
View all notes |
Alert me of new notes |
CANSLIM.net Company Profile |
SEC |
Zacks Reports |
StockTalk |
News |
Chart |
Request a new note
C
A N
S L
I M


|
ATHN
-
NASDAQ
Athenahealth Inc
DIVERSIFIED SERVICES - Business/Management Services
|
$66.71
|
-0.08
-0.12% |
$67.58
|
693,006
96.76% of 50 DAV
50 DAV is 716,200
|
$67.87
-1.71%
|
9/8/2011
|
$61.93
|
PP = $61.78
|
|
MB = $64.87
|
Most Recent Note - 9/14/2011 6:00:39 PM
G - Posted a second consecutive gain today with above average volume for another new all-time high, getting more extended from its prior base. Disciplined investors use a tactic called "pyramiding" to avoid chasing stocks more than +5% above prior highs. Always minimize losses by selling if any stock falls -7% from their buy point.
>>> The latest Featured Stock Update with an annotated graph appeared on 9/8/2011. Click here.
View all notes |
Alert me of new notes |
CANSLIM.net Company Profile |
SEC |
Zacks Reports |
StockTalk |
News |
Chart |
Request a new note
C
A N
S L
I M
|
DMND
-
NASDAQ
Diamond Foods Inc
FOOD and; BEVERAGE - Processed and; Packaged Goods
|
$78.23
|
+1.76
2.31% |
$78.43
|
434,879
204.84% of 50 DAV
50 DAV is 212,300
|
$80.16
-2.40%
|
9/13/2011
|
$75.57
|
PP = $80.16
|
|
MB = $84.17
|
Most Recent Note - 9/15/2011 6:45:21 PM
Y - Today's 4th consecutive gain came with above average volume. Subsequent gains with heavy volume above the new pivot point cited based on its 8/31/11 high may trigger a technical buy signal. See the latest FSU analysis for more details and an annotated weekly graph.
>>> The latest Featured Stock Update with an annotated graph appeared on 9/13/2011. Click here.
View all notes |
Alert me of new notes |
CANSLIM.net Company Profile |
SEC |
Zacks Reports |
StockTalk |
News |
Chart |
Request a new note
C
A N
S L
I M
|
EXLS
-
NASDAQ
Exlservice Holdings Inc
DIVERSIFIED SERVICES - Business/Management Services
|
$22.80
|
-0.03
-0.13% |
$22.99
|
546,398
335.42% of 50 DAV
50 DAV is 162,900
|
$26.55
-14.12%
|
8/2/2011
|
$24.85
|
PP = $24.85
|
|
MB = $26.09
|
Most Recent Note - 9/15/2011 12:36:41 PM
G - Still holding its ground above its 200 DMA line after pricing its previously noted Secondary Offering at $23.00. News of the offering was followed by a damaging gap down on 9/13/11, and it violated its 50 DMA line, raising concerns and triggering a technical sell signal. It is -14.3% off its 52-week high hit last week, and only a prompt rebound above its short-term average would help its outlook.
>>> The latest Featured Stock Update with an annotated graph appeared on 9/7/2011. Click here.
View all notes |
Alert me of new notes |
CANSLIM.net Company Profile |
SEC |
Zacks Reports |
StockTalk |
News |
Chart |
Request a new note
C
A N
S L
I M
|
FCFS
-
NASDAQ
First Cash Financial Svs
SPECIALTY RETAIL - Specialty Retail, Other
|
$50.76
|
-0.13
-0.26% |
$52.06
|
472,166
129.97% of 50 DAV
50 DAV is 363,300
|
$51.62
-1.67%
|
5/31/2011
|
$42.00
|
PP = $40.23
|
|
MB = $42.24
|
Most Recent Note - 9/14/2011 3:55:33 PM
G - Spiking to a new all-time high today with above average volume behind its gain. It is extended from its prior base, and its 50 DMA line defines support to watch.
>>> The latest Featured Stock Update with an annotated graph appeared on 9/6/2011. Click here.
View all notes |
Alert me of new notes |
CANSLIM.net Company Profile |
SEC |
Zacks Reports |
StockTalk |
News |
Chart |
Request a new note
C
A N
S L
I M
|
Symbol/Exchange
Company Name
Industry Group |
PRICE |
CHANGE
(%Change) |
Day High |
Volume
(% DAV)
(% 50 day avg vol) |
52 Wk Hi
% From Hi |
Featured
Date |
Price
Featured |
Pivot Featured |
|
Max Buy |
JCOM
-
NASDAQ
J 2 Global Communication
INTERNET - Internet Software and Services
|
$31.86
|
+0.25
0.79% |
$32.10
|
417,618
99.86% of 50 DAV
50 DAV is 418,200
|
$32.64
-2.39%
|
8/8/2011
|
$30.38
|
PP = $29.31
|
|
MB = $30.78
|
Most Recent Note - 9/13/2011 7:33:44 PM
G - Gain today came with better above average volume, finishing -4% off its 52-week high. Previous highs in the $30-31 area define initial chart support to watch.
>>> The latest Featured Stock Update with an annotated graph appeared on 8/29/2011. Click here.
View all notes |
Alert me of new notes |
CANSLIM.net Company Profile |
SEC |
Zacks Reports |
StockTalk |
News |
Chart |
Request a new note
C
A N
S L
I M
|
MA
-
NYSE
Mastercard Inc Cl A
DIVERSIFIED SERVICES - Business/Management Services
|
$347.94
|
+10.71
3.18% |
$349.56
|
2,212,071
152.75% of 50 DAV
50 DAV is 1,448,200
|
$345.13
0.81%
|
8/3/2011
|
$324.82
|
PP = $322.38
|
|
MB = $338.50
|
Most Recent Note - 9/15/2011 6:43:28 PM
G - Color code is changed to green after a volume-driven gain today helped it hit a new all-time high and rally well above its "max buy" level.
>>> The latest Featured Stock Update with an annotated graph appeared on 9/12/2011. Click here.
View all notes |
Alert me of new notes |
CANSLIM.net Company Profile |
SEC |
Zacks Reports |
StockTalk |
News |
Chart |
Request a new note
C
A N
S L
I M
|
MG
-
NYSE
Mistras Group Inc
DIVERSIFIED SERVICES - Bulding and Faci;ity Management Services
|
$20.09
|
-0.06
-0.30% |
$20.42
|
102,398
57.21% of 50 DAV
50 DAV is 179,000
|
$20.82
-3.51%
|
8/10/2011
|
$17.89
|
PP = $17.58
|
|
MB = $18.46
|
Most Recent Note - 9/13/2011 7:36:22 PM
G - Still holding its ground stubbornly near its 52-week high. Prior resistance in the $18 area and its 50 DMA line define important chart support to watch on pullbacks.
>>> The latest Featured Stock Update with an annotated graph appeared on 9/9/2011. Click here.
View all notes |
Alert me of new notes |
CANSLIM.net Company Profile |
SEC |
Zacks Reports |
StockTalk |
News |
Chart |
Request a new note
C
A N
S L
I M
|
MKTX
-
NASDAQ
Marketaxess Holdings Inc
FINANCIAL SERVICES - Investment Brokerage - Nationa
|
$29.53
|
-0.20
-0.67% |
$30.33
|
162,690
62.98% of 50 DAV
50 DAV is 258,300
|
$30.95
-4.58%
|
7/29/2011
|
$25.87
|
PP = $26.35
|
|
MB = $27.67
|
Most Recent Note - 9/13/2011 7:39:07 PM
G - Reversed late day and finished near the session low with its second loss on above average volume in the span of 3 sessions, action indicative of distributional pressure. It has been noted as extended from its prior base. Prior resistance in the $26 area and its 50 DMA line define important chart support to watch.
>>> The latest Featured Stock Update with an annotated graph appeared on 9/2/2011. Click here.
View all notes |
Alert me of new notes |
CANSLIM.net Company Profile |
SEC |
Zacks Reports |
StockTalk |
News |
Chart |
Request a new note
C
A N
S L
I M
|
PSMT
-
NASDAQ
Pricesmart Inc
RETAIL - Drug Stores
|
$72.74
|
+0.10
0.14% |
$73.19
|
375,502
126.39% of 50 DAV
50 DAV is 297,100
|
$73.19
-0.61%
|
8/30/2011
|
$63.01
|
PP = $62.37
|
|
MB = $65.49
|
Most Recent Note - 9/14/2011 12:24:37 PM
G - Rallying even higher today, on track for a 7th consecutive gain backed by above average volume, getting more extended from its prior base. Prior highs and its 50 DMA line define support levels to watch on pullbacks.
>>> The latest Featured Stock Update with an annotated graph appeared on 9/14/2011. Click here.
View all notes |
Alert me of new notes |
CANSLIM.net Company Profile |
SEC |
Zacks Reports |
StockTalk |
News |
Chart |
Request a new note
C
A N
S L
I M
|
Symbol/Exchange
Company Name
Industry Group |
PRICE |
CHANGE
(%Change) |
Day High |
Volume
(% DAV)
(% 50 day avg vol) |
52 Wk Hi
% From Hi |
Featured
Date |
Price
Featured |
Pivot Featured |
|
Max Buy |
|
|
|
THESE ARE NOT BUY RECOMMENDATIONS!
Comments contained in the body of this report are technical
opinions only. The material herein has been obtained
from sources believed to be reliable and accurate, however,
its accuracy and completeness cannot be guaranteed.
This site is not an investment advisor, hence it does
not endorse or recommend any securities or other investments.
Any recommendation contained in this report may not
be suitable for all investors and it is not to be deemed
an offer or solicitation on our part with respect to
the purchase or sale of any securities. All trademarks,
service marks and trade names appearing in this report
are the property of their respective owners, and are
likewise used for identification purposes only.
This report is a service available
only to active Paid Premium Members.
You may opt-out of receiving report notifications
at any time. Questions or comments may be submitted
by writing to Premium Membership Services 665 S.E. 10 Street, Suite 201 Deerfield Beach, FL 33441-5634 or by calling 1-800-965-8307
or 954-785-1121.
|
|
|

