You are not logged in.
This means you
CAN ONLY VIEW reports that were published prior to Tuesday, April 1, 2025.
You
MUST UPGRADE YOUR MEMBERSHIP if you want to see any current reports.
AFTER MARKET UPDATE - MONDAY, SEPTEMBER 19TH, 2011
Previous After Market Report Next After Market Report >>>
|
|
|
|
DOW |
-108.08 |
11,401.01 |
-0.94% |
|
Volume |
908,445,820 |
-50% |
|
Volume |
1,854,032,800 |
-13% |
|
NASDAQ |
-9.48 |
2,612.83 |
-0.36% |
|
Advancers |
676 |
22% |
|
Advancers |
566 |
21% |
|
S&P 500 |
-11.92 |
1,204.09 |
-0.98% |
|
Decliners |
2,323 |
75% |
|
Decliners |
2,039 |
76% |
|
Russell 2000 |
-12.08 |
702.23 |
-1.69% |
|
52 Wk Highs |
22 |
|
|
52 Wk Highs |
25 |
|
|
S&P 600 |
-6.10 |
383.54 |
-1.57% |
|
52 Wk Lows |
80 |
|
|
52 Wk Lows |
105 |
|
|
 |
Financial Sector Infecting Broader Market Again
Kenneth J. Gruneisen - Passed the CAN SLIM® Master's Exam
The Dow Jones Industrial Average traded down as many as 253 points in the early going on Monday after the market opened with a negative bias, then throughout the session the blue chips and other indices recovered but still finished with losses. The reported volume totals were lighter on the NYSE and on the Nasdaq exchange following Friday's totals that were inflated by options expirations. Declining issues beat advancers by 7-2 on the NYSE and by nearly 4-1 on the Nasdaq.exchange. New 52-week lows outnumbered new 52-week highs on both the Nasdaq exchange and the NYSE. There were 20 high-ranked companies from the CANSLIM.net Leaders List that made new 52-week highs and appeared on the CANSLIM.net BreakOuts Page, down from the prior session total of 28 stocks. However, there were gains from 9 of the 12 high-ranked companies currently included on the Featured Stocks Page.
The mood improved in the final hour when Greek officials said they were closer to an agreement on a deal to win a new aid payment and avoid default. Talks will resume tomorrow.
Financial and energy sectors felt the most pressure. Oil prices fell to a three-week low in New York on worries demand may falter and after OPEC indicated that global consumption of oil is rising less than expected. Technology shares were led by Apple Inc (AAPL +2.9%) as it hit a new all-time high.
Standout stocks included Tyco International Ltd (TYC +2.40%) after the firm announced a plan to split into three companies. Goodrich (GR +15.84%) gapped up and touched a 30-year high as talks continued on a possible United Technologies (UTX +0.07%) acquisition. There was a ray of hope for the homebuilding industry. Lennar Corp (LEN +4.86%) said consumers are returning to the market as the company posted its sixth straight quarterly profit.
The market environment (M criteria) remains in an uptrend despite recent pressure, and disciplined investors may carefully consider new buying efforts when all key criteria are satisfied. While it is encouraging that the major averages have been keeping the rally alive by staying well above their Day 1 (8/09/11) lows, a further expansion in leadership (new 52-week highs) remains crucial to any sustained advance.
The September 2011 issue of CANSLIM.net News will be available soon. The Q3 2011 Webcast has also been scheduled for Wednesday, September 28th at 8PM EST. Links to all prior reports and webcasts are available on the Premium Member Homepage.
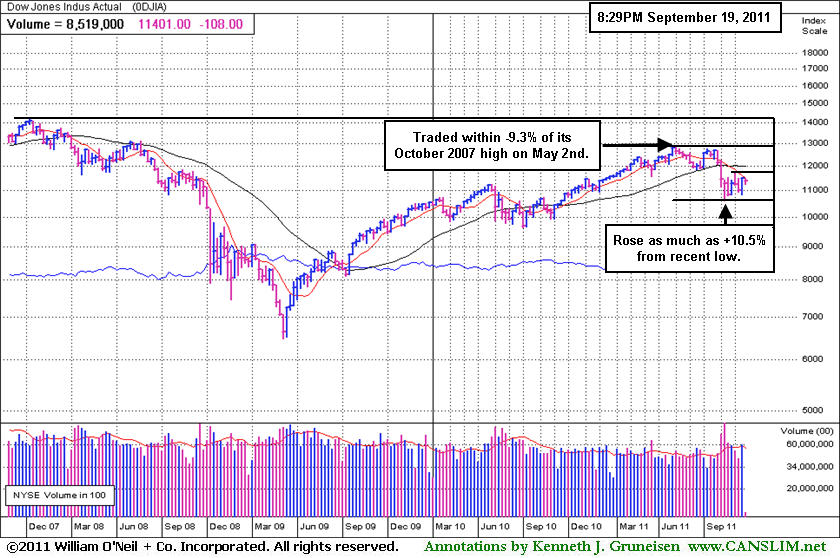
PICTURED: The weekly graph of the Dow Jones Industrial Average above gives a longer-term perspective of where it stands versus the daily graph shown in last Wednesday's commentary (read here). It rallied within -9.3% of its October 2007 all-time high at its May 2nd peak this year. After the latest correction, From the Day 1 low (8/09/11) it rallied up +10.5% within the first 4 weeks of the current rally. Its 50-day moving average (DMA) line and recent highs define near-term resistance. Subsequent gains above those levels would be a notable technical improvement in the market's health.
|
 Kenneth J. Gruneisen started out as a licensed stockbroker in August 1987, a couple of months prior to the historic stock market crash that took the Dow Jones Industrial Average down -22.6% in a single day. He has published daily fact-based fundamental and technical analysis on high-ranked stocks online for two decades. Through FACTBASEDINVESTING.COM, Kenneth provides educational articles, news, market commentary, and other information regarding proven investment systems that work in good times and bad.
Comments contained in the body of this report are technical opinions only and are not necessarily those of Gruneisen Growth Corp. The material herein has been obtained from sources believed to be reliable and accurate, however, its accuracy and completeness cannot be guaranteed. Our firm, employees, and customers may effect transactions, including transactions contrary to any recommendation herein, or have positions in the securities mentioned herein or options with respect thereto. Any recommendation contained in this report may not be suitable for all investors and it is not to be deemed an offer or solicitation on our part with respect to the purchase or sale of any securities. |
|
 |
Retail Index Holding Recent Gains Above 50 & 200 DMA Lines
Kenneth J. Gruneisen - Passed the CAN SLIM® Master's Exam
Financial stock were the session's sore spot as the Broker/Dealer Index ($XBD -3.05%) and Bank Index ($BKX -2.84%) took the most substantial damage. Energy-related shares sank as the Oil Services Index ($OSX -1.68%) and Integrated Oil Index ($XOI -1.33%) suffered losses. Tech shares also had a negative charge as the Networking Index ($NWX -1.38%), Semiconductor Index ($SOX -1.16%), Internet Index ($IIX -1.05%), and Biotechnology Index ($BTK -0.85%) fell. The Healthcare Index ($HMO -0.82%) and Gold & Silver Index ($XAU -0.97%) offered no reward for defensively positioned investors.
Charts courtesy www.stockcharts.com
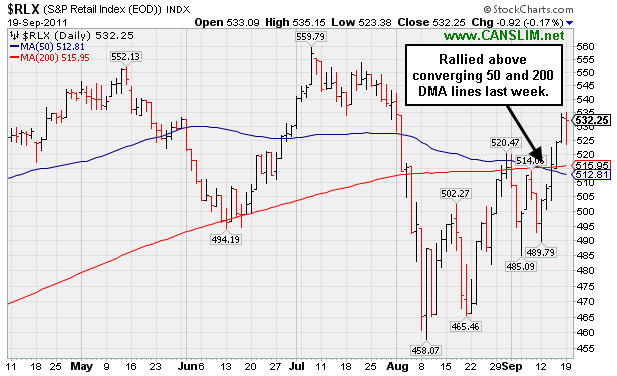
PICTURED: The Retail Index ($RLX -0.17%) was a standout by simply finishing Monday's session closer to unchanged that any of the other group indexes routinely included in this commentary. Last week it rallied above its converging 50-day moving average (DMA) and 200 DMA lines.
| Oil Services |
$OSX |
231.90 |
-3.97 |
-1.68% |
-5.39% |
| Healthcare |
$HMO |
2,078.03 |
-17.14 |
-0.82% |
+22.82% |
| Integrated Oil |
$XOI |
1,133.57 |
-15.26 |
-1.33% |
-6.56% |
| Semiconductor |
$SOX |
377.49 |
-4.42 |
-1.16% |
-8.34% |
| Networking |
$NWX |
238.45 |
-3.34 |
-1.38% |
-15.01% |
| Internet |
$IIX |
287.24 |
-3.06 |
-1.05% |
-6.66% |
| Broker/Dealer |
$XBD |
86.69 |
-2.73 |
-3.05% |
-28.66% |
| Retail |
$RLX |
532.25 |
-0.92 |
-0.17% |
+4.70% |
| Gold & Silver |
$XAU |
215.44 |
-2.12 |
-0.97% |
-4.92% |
| Bank |
$BKX |
37.59 |
-1.10 |
-2.84% |
-28.00% |
| Biotech |
$BTK |
1,181.52 |
-10.13 |
-0.85% |
-8.95% |
|
|
|
 |
Volume Requirement Not Met As Apple Hit New High
Kenneth J. Gruneisen - Passed the CAN SLIM® Master's Exam
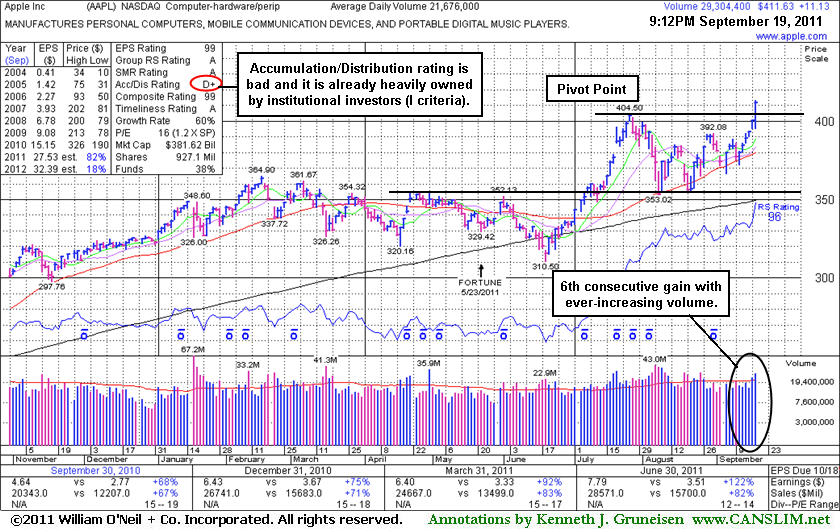
Apple Inc (AAPL +$11.13 or +2.78% to $411.63) hit new 52-week and all-time highs with +35% above average volume behind today's 6th consecutive gain after finding support near its 50-day moving average (DMA) line and prior chart highs during its 8-week consolidation. The 9/16/11 mid-day report (read here) included it highlighted in yellow with pivot point based on its 52-week high plus 10 cents. In today's mid-day report it was again cautiously noted - "A gain with at least +40% above average volume while rising above its pivot point may trigger a technical buy signal." Disciplined investors use a tactic called "pyramiding" to avoid chasing stocks more than +5% above prior highs. Today's gain today tested investors' discipline, and they should appreciate the volume shortfall's significance. It clearly hints that, at the late stage of the tech leader's ongoing advance, there may not be very many institutional investors willing to "finally" turn bullish on it enough to decide to become buyers over other great growth candidates which might be more fleet footed.
AAPL recently rallied after reporting very strong earnings +122% on +82% sales revenues for the quarter ended June 30, 2011 versus the year ago period. Stellar earnings track record that solidly satisfies the C and A criteria. However, it is already heavily owned by the institutional crowd, and ownership by top-rated funds fell from 4,366 in Mar '11 to 4,343 in Jun '11.
It had been dropped from the Featured Stocks list on 8/20/10 after its last appearance in this FSU section (8/09/10) under the headline, "Quiet Consolidation Above 50 DMA Line". An annotated graph and detailed analysis in the 6/17/10 report under the headline "Saucy Details On Apple Worth Reviewing" summarized important details and some of the prior coverage published concerning of this long-time favorite. Members who have not followed the ongoing analysis provided should take time to review what has been written. With the largest market cap of all publicly traded firms, AAPL does not fit the mold of a small growth firm unknown by the institutional crowd which would be more typical of the winning models of the fact-based investment system.
 |
|
|
Color Codes Explained :
Y - Better candidates highlighted by our
staff of experts.
G - Previously featured
in past reports as yellow but may no longer be buyable under the
guidelines.
***Last / Change / Volume data in this table is the closing quote data***
Symbol/Exchange
Company Name
Industry Group |
PRICE |
CHANGE
(%Change) |
Day High |
Volume
(% DAV)
(% 50 day avg vol) |
52 Wk Hi
% From Hi |
Featured
Date |
Price
Featured |
Pivot Featured |
|
Max Buy |
AAPL
-
NASDAQ
Apple Inc
COMPUTER HARDWARE - Personal Computers
|
$411.63
|
+11.13
2.78% |
$413.23
|
29,423,540
135.74% of 50 DAV
50 DAV is 21,676,000
|
$404.50
1.76%
|
9/16/2011
|
$399.14
|
PP = $404.60
|
|
MB = $424.83
|
 Most Recent Note - 9/19/2011 9:24:38 PM
Y - Finished near the session high after rallying to a new all-time high with +36% above average volume behind today's 6th consecutive gain. It is already heavily owned by the institutional crowd, and ownership by top-rated funds fell from 4,366 in Mar '11 to 4,343 in Jun '11. See the latest FSU analysis for more details and a new annotated graph.
>>> The latest Featured Stock Update with an annotated graph appeared on 9/19/2011. Click here.
View all notes |
Alert me of new notes |
CANSLIM.net Company Profile |
SEC |
Zacks Reports |
StockTalk |
News |
Chart |
Request a new note
C
A N
S L
I M


|
ALXN
-
NASDAQ
Alexion Pharmaceuticals
DRUGS - Drug Manufacturers - Other
|
$63.85
|
+1.78
2.87% |
$64.40
|
1,384,148
85.74% of 50 DAV
50 DAV is 1,614,300
|
$64.17
-0.50%
|
9/15/2011
|
$63.20
|
PP = $60.81
|
|
MB = $63.85
|
Most Recent Note - 9/19/2011 3:15:38 PM
Y - Overcame early weakness after a small gap down today, rallying for a positive reversal. Its gap up last week helped it break out from a cup-with-high-handle base pattern and trigger a technical buy signal. Its strong quarterly and annual earnings history satisfies the C and A criteria. See the latest FSU analysis for more details and a new annotated graph.
>>> The latest Featured Stock Update with an annotated graph appeared on 9/15/2011. Click here.
View all notes |
Alert me of new notes |
CANSLIM.net Company Profile |
SEC |
Zacks Reports |
StockTalk |
News |
Chart |
Request a new note
C
A N
S L
I M
|
ATHN
-
NASDAQ
Athenahealth Inc
DIVERSIFIED SERVICES - Business/Management Services
|
$69.25
|
+0.56
0.82% |
$72.70
|
2,112,927
289.64% of 50 DAV
50 DAV is 729,500
|
$68.92
0.48%
|
9/8/2011
|
$61.93
|
PP = $61.78
|
|
MB = $64.87
|
Most Recent Note - 9/19/2011 12:25:06 PM
G - Big gain today backed by above average volume for another new all-time high, getting more extended from its prior base. Prior highs in the $61 area define initial support on pullbacks.
>>> The latest Featured Stock Update with an annotated graph appeared on 9/8/2011. Click here.
View all notes |
Alert me of new notes |
CANSLIM.net Company Profile |
SEC |
Zacks Reports |
StockTalk |
News |
Chart |
Request a new note
C
A N
S L
I M
|
CELG
-
NASDAQ
Celgene Corp
DRUGS - Drug Manufacturers - Major
|
$61.19
|
+0.15
0.25% |
$61.38
|
3,239,901
85.31% of 50 DAV
50 DAV is 3,798,000
|
$63.46
-3.58%
|
9/16/2011
|
$61.21
|
PP = $62.59
|
|
MB = $65.72
|
Most Recent Note - 9/16/2011 12:36:50 PM
Y - Color code is changed to yellow with pivot point cited based on its 52-week high plus 10 cents. It is perched within close striking distance of previously stubborn resistance in the $62 area. Quarterly and annual earnings history has remained strong while it survived but failed to impress since it was dropped from the Featured Stocks list on 10/06/08. See the Featured Stock Update section of the 9/23/08 CANSLIM.net After Market Update for analysis and an annotated graph (read here). Disciplined investors may note that CELG did not confirm a proper technical buy signal after it was featured in the August 2008 CANSLIM.net News, whereas the detailed report's "Technical Analysis" area included the note - "Confirming gains to all-time highs with great volume conviction would be a nice reassurance that it is capable of a meaningful advance" (read here).
>>> The latest Featured Stock Update with an annotated graph appeared on 9/16/2011. Click here.
View all notes |
Alert me of new notes |
CANSLIM.net Company Profile |
SEC |
Zacks Reports |
StockTalk |
News |
Chart |
Request a new note
C
A N
S L
I M
|
DMND
-
NASDAQ
Diamond Foods Inc
FOOD and; BEVERAGE - Processed and; Packaged Goods
|
$87.50
|
+0.20
0.23% |
$88.40
|
693,879
255.86% of 50 DAV
50 DAV is 271,200
|
$90.33
-3.13%
|
9/13/2011
|
$75.57
|
PP = $80.16
|
|
MB = $84.17
|
Most Recent Note - 9/19/2011 12:34:35 PM
G - Holding its ground today. Last week it reported earnings +53% on +32% sales revenues for the quarter ended July 31, 2011 versus the year ago period, and a considerable "breakaway gap" with heavy volume cleared its pivot point and triggered a technical buy signal. Color code is changed to green. Breakaway gaps are one exception where chasing a stock more than 5% above prior highs may be permitted, but risk increases when doing so that an ordinary pullback may prompt investors to sell per the system's selling rules.
>>> The latest Featured Stock Update with an annotated graph appeared on 9/13/2011. Click here.
View all notes |
Alert me of new notes |
CANSLIM.net Company Profile |
SEC |
Zacks Reports |
StockTalk |
News |
Chart |
Request a new note
C
A N
S L
I M
|
Symbol/Exchange
Company Name
Industry Group |
PRICE |
CHANGE
(%Change) |
Day High |
Volume
(% DAV)
(% 50 day avg vol) |
52 Wk Hi
% From Hi |
Featured
Date |
Price
Featured |
Pivot Featured |
|
Max Buy |
EXLS
-
NASDAQ
Exlservice Holdings Inc
DIVERSIFIED SERVICES - Business/Management Services
|
$22.81
|
-0.09
-0.39% |
$22.90
|
205,620
116.17% of 50 DAV
50 DAV is 177,000
|
$26.55
-14.09%
|
8/2/2011
|
$24.85
|
PP = $24.85
|
|
MB = $26.09
|
Most Recent Note - 9/15/2011 12:36:41 PM
G - Still holding its ground above its 200 DMA line after pricing its previously noted Secondary Offering at $23.00. News of the offering was followed by a damaging gap down on 9/13/11, and it violated its 50 DMA line, raising concerns and triggering a technical sell signal. It is -14.3% off its 52-week high hit last week, and only a prompt rebound above its short-term average would help its outlook.
>>> The latest Featured Stock Update with an annotated graph appeared on 9/7/2011. Click here.
View all notes |
Alert me of new notes |
CANSLIM.net Company Profile |
SEC |
Zacks Reports |
StockTalk |
News |
Chart |
Request a new note
C
A N
S L
I M
|
FCFS
-
NASDAQ
First Cash Financial Svs
SPECIALTY RETAIL - Specialty Retail, Other
|
$51.29
|
+0.69
1.36% |
$51.71
|
284,410
75.76% of 50 DAV
50 DAV is 375,400
|
$52.06
-1.47%
|
5/31/2011
|
$42.00
|
PP = $40.23
|
|
MB = $42.24
|
Most Recent Note - 9/14/2011 3:55:33 PM
G - Spiking to a new all-time high today with above average volume behind its gain. It is extended from its prior base, and its 50 DMA line defines support to watch.
>>> The latest Featured Stock Update with an annotated graph appeared on 9/6/2011. Click here.
View all notes |
Alert me of new notes |
CANSLIM.net Company Profile |
SEC |
Zacks Reports |
StockTalk |
News |
Chart |
Request a new note
C
A N
S L
I M
|
JCOM
-
NASDAQ
J 2 Global Communication
INTERNET - Internet Software and Services
|
$31.06
|
-0.78
-2.45% |
$31.47
|
403,487
93.64% of 50 DAV
50 DAV is 430,900
|
$32.67
-4.94%
|
8/8/2011
|
$30.38
|
PP = $29.31
|
|
MB = $30.78
|
Most Recent Note - 9/19/2011 3:05:00 PM
G - Quietly pulling back today after touching a new 52-week high on the prior session. No resistance remains due to overhead supply. Previous highs in the $30-31 area define initial chart support to watch above its closely coinciding 50 and 200 DMA lines.
>>> The latest Featured Stock Update with an annotated graph appeared on 8/29/2011. Click here.
View all notes |
Alert me of new notes |
CANSLIM.net Company Profile |
SEC |
Zacks Reports |
StockTalk |
News |
Chart |
Request a new note
C
A N
S L
I M
|
MA
-
NYSE
Mastercard Inc Cl A
DIVERSIFIED SERVICES - Business/Management Services
|
$347.98
|
+1.03
0.30% |
$352.00
|
1,649,744
107.67% of 50 DAV
50 DAV is 1,532,200
|
$352.00
-1.14%
|
8/3/2011
|
$324.82
|
PP = $322.38
|
|
MB = $338.50
|
Most Recent Note - 9/16/2011 1:17:39 PM
G - Pulling back today from the new all-time high hit with the prior session's volume-driven gain and rally well above its "max buy" level.
>>> The latest Featured Stock Update with an annotated graph appeared on 9/12/2011. Click here.
View all notes |
Alert me of new notes |
CANSLIM.net Company Profile |
SEC |
Zacks Reports |
StockTalk |
News |
Chart |
Request a new note
C
A N
S L
I M
|
MG
-
NYSE
Mistras Group Inc
DIVERSIFIED SERVICES - Bulding and Faci;ity Management Services
|
$19.68
|
-0.23
-1.16% |
$19.96
|
144,344
81.50% of 50 DAV
50 DAV is 177,100
|
$20.82
-5.48%
|
8/10/2011
|
$17.89
|
PP = $17.58
|
|
MB = $18.46
|
Most Recent Note - 9/13/2011 7:36:22 PM
G - Still holding its ground stubbornly near its 52-week high. Prior resistance in the $18 area and its 50 DMA line define important chart support to watch on pullbacks.
>>> The latest Featured Stock Update with an annotated graph appeared on 9/9/2011. Click here.
View all notes |
Alert me of new notes |
CANSLIM.net Company Profile |
SEC |
Zacks Reports |
StockTalk |
News |
Chart |
Request a new note
C
A N
S L
I M
|
Symbol/Exchange
Company Name
Industry Group |
PRICE |
CHANGE
(%Change) |
Day High |
Volume
(% DAV)
(% 50 day avg vol) |
52 Wk Hi
% From Hi |
Featured
Date |
Price
Featured |
Pivot Featured |
|
Max Buy |
MKTX
-
NASDAQ
Marketaxess Holdings Inc
FINANCIAL SERVICES - Investment Brokerage - Nationa
|
$27.68
|
+0.03
0.11% |
$28.00
|
204,058
73.64% of 50 DAV
50 DAV is 277,100
|
$30.95
-10.56%
|
7/29/2011
|
$25.87
|
PP = $26.35
|
|
MB = $27.67
|
Most Recent Note - 9/16/2011 11:43:17 AM
G - Gapped down today following news of a Secondary Offering of 950,000 shares priced at $28.65. Prior resistance in the $26 area and its 50 DMA line define important chart support to watch.
>>> The latest Featured Stock Update with an annotated graph appeared on 9/2/2011. Click here.
View all notes |
Alert me of new notes |
CANSLIM.net Company Profile |
SEC |
Zacks Reports |
StockTalk |
News |
Chart |
Request a new note
C
A N
S L
I M
|
PSMT
-
NASDAQ
Pricesmart Inc
RETAIL - Drug Stores
|
$74.16
|
+0.88
1.20% |
$74.59
|
312,948
104.25% of 50 DAV
50 DAV is 300,200
|
$73.93
0.31%
|
8/30/2011
|
$63.01
|
PP = $62.37
|
|
MB = $65.49
|
Most Recent Note - 9/14/2011 12:24:37 PM
G - Rallying even higher today, on track for a 7th consecutive gain backed by above average volume, getting more extended from its prior base. Prior highs and its 50 DMA line define support levels to watch on pullbacks.
>>> The latest Featured Stock Update with an annotated graph appeared on 9/14/2011. Click here.
View all notes |
Alert me of new notes |
CANSLIM.net Company Profile |
SEC |
Zacks Reports |
StockTalk |
News |
Chart |
Request a new note
C
A N
S L
I M
|
|
|
|
THESE ARE NOT BUY RECOMMENDATIONS!
Comments contained in the body of this report are technical
opinions only. The material herein has been obtained
from sources believed to be reliable and accurate, however,
its accuracy and completeness cannot be guaranteed.
This site is not an investment advisor, hence it does
not endorse or recommend any securities or other investments.
Any recommendation contained in this report may not
be suitable for all investors and it is not to be deemed
an offer or solicitation on our part with respect to
the purchase or sale of any securities. All trademarks,
service marks and trade names appearing in this report
are the property of their respective owners, and are
likewise used for identification purposes only.
This report is a service available
only to active Paid Premium Members.
You may opt-out of receiving report notifications
at any time. Questions or comments may be submitted
by writing to Premium Membership Services 665 S.E. 10 Street, Suite 201 Deerfield Beach, FL 33441-5634 or by calling 1-800-965-8307
or 954-785-1121.
|
|
|

