You are not logged in.
This means you
CAN ONLY VIEW reports that were published prior to Monday, February 26, 2024.
You
MUST UPGRADE YOUR MEMBERSHIP if you want to see any current reports.
AFTER MARKET UPDATE - WEDNESDAY, AUGUST 19TH, 2020
Previous After Market Report Next After Market Report >>>
|
|
|
|
DOW |
-85.19 |
27,692.88 |
-0.31% |
|
Volume |
765,748,108 |
-1% |
|
Volume |
3,455,814,600 |
+9% |
|
NASDAQ |
-64.38 |
11,146.46 |
-0.57% |
|
Advancers |
1,204 |
41% |
|
Advancers |
1,493 |
46% |
|
S&P 500 |
-14.93 |
3,374.85 |
-0.44% |
|
Decliners |
1,751 |
59% |
|
Decliners |
1,756 |
54% |
|
Russell 2000 |
+2.29 |
1,572.07 |
+0.15% |
|
52 Wk Highs |
88 |
|
|
52 Wk Highs |
118 |
|
|
S&P 600 |
+1.30 |
908.43 |
+0.14% |
|
52 Wk Lows |
21 |
|
|
52 Wk Lows |
34 |
|
|
 |
Major Indices Lost Ground as Leadership Thinned
Kenneth J. Gruneisen - Passed the CAN SLIM® Master's Exam
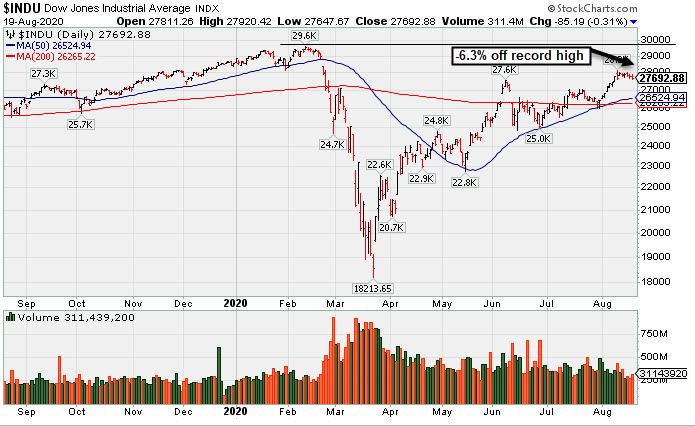
The Dow lost 85 points, while the S&P 500 slipped 0.4% after rising to a new record high earlier in the session. The Nasdaq Composite declined 0.6%. The reported volume totals were mixed, a bit lighter than the prior session total on the NYSE but higher on the Nasdaq exchange. Decliners led advancers by almost a 3-2 margin on the NYSE and by a 6-5 margin on the Nasdaq exchange. There were 33 high-ranked companies from the Leaders List that hit new 52-week highs and were listed on the BreakOuts Page, versus the total of 48 on the prior session. New 52-week highs totals outnumbered new 52-week lows totals on both the NYSE and the Nasdaq exchange. The major indices are in a confirmed uptrend (M criteria). Any sustainable rally requires a healthy crop of new leaders, so it remains ever-important to see substantial new highs totals.
Charts used courtesy of www.stockcharts.com
PICTURED: The Dow Jones Industrial Average is -6.3% off its record high. Stocks fluctuated Wednesday, as investors digested central bank updates and key retail earnings reports. The Federal Reserve released minutes from its July FOMC meeting which caused equities to give up midday gains. The report cautioned optimism about the U.S. economic recovery in the second half of 2020, with several participants citing the ongoing pandemic’s ability to stunt its growth.
All 11 S&P 500 sectors ended the day in negative territory with Real Estate and Energy shares leading declines. In corporate news, Apple (AAPL +0.13%) closed just below $2 trillion in market cap value after surpassing the milestone earlier in the session. In earnings, Target (TGT +12.65%) gapped up for a new high after posting its largest quarterly sales growth on record. Lowe’s (LOW +0.23%) hit a new high following a top and bottom beat as home improvement projects picked up during the pandemic. TJX Companies (TJX -5.38%) fell on the heels of disappointing results that showed slower foot traffic in reopened stores. In M&A news, Momenta Pharmaceuticals (MNTA +69.17%) rose after Johnson & Johnson (JNJ +0.20%) announced plans to acquire the health care company for $6.5 billion in cash.
Treasuries weakened with the yield on the 10-year note climbing two basis points to 0.68%. In commodities, WTI crude ticked down 0.1% to $42.85/barrel, as official government data showing a smaller-than-forecasted drawdown in U.S. crude stockpiles. COMEX gold tumbled 3% to $1,938.70/ounce as a gauge of the U.S. dollar rose for the first time in five days.
|
 Kenneth J. Gruneisen started out as a licensed stockbroker in August 1987, a couple of months prior to the historic stock market crash that took the Dow Jones Industrial Average down -22.6% in a single day. He has published daily fact-based fundamental and technical analysis on high-ranked stocks online for two decades. Through FACTBASEDINVESTING.COM, Kenneth provides educational articles, news, market commentary, and other information regarding proven investment systems that work in good times and bad.
Comments contained in the body of this report are technical opinions only and are not necessarily those of Gruneisen Growth Corp. The material herein has been obtained from sources believed to be reliable and accurate, however, its accuracy and completeness cannot be guaranteed. Our firm, employees, and customers may effect transactions, including transactions contrary to any recommendation herein, or have positions in the securities mentioned herein or options with respect thereto. Any recommendation contained in this report may not be suitable for all investors and it is not to be deemed an offer or solicitation on our part with respect to the purchase or sale of any securities. |
|
 |
Financials and Networking Index Rose
Kenneth J. Gruneisen - Passed the CAN SLIM® Master's Exam
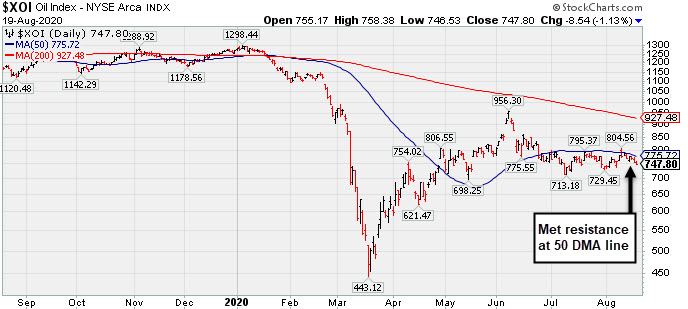
Financials had a positive bias as the Broker/Dealer Index ($XBD +0.72%) outpaced the Bank Index ($BKX +0.16%), meanwhile the Retail Index ($RLX -0.83%) ended lower. The Biotech Index ($BTK -2.63%) led the tech sector lower and the Semiconductor Index ($SOX -0.63%) suffered a smaller loss, meanwhile the Networking Index ($NWX +0.35%) inched higher. Commodity-linked groups were weaker as the Gold & Silver Index ($XAU -3.13%) outpaced the Integrated Oil Index ($XOI -1.13%) and Oil Services Index ($OSX -0.21%) to the downside.
PICTURED: The Integrated Oil Index ($XOI -1.13%) recently met resistance at its 50-day moving average (DMA) line.
| Oil Services |
$OSX |
38.21 |
-0.08 |
-0.21% |
-51.19% |
| Integrated Oil |
$XOI |
747.80 |
-8.54 |
-1.13% |
-41.14% |
| Semiconductor |
$SOX |
2,200.77 |
-13.89 |
-0.63% |
+18.98% |
| Networking |
$NWX |
602.99 |
+2.13 |
+0.35% |
+3.36% |
| Broker/Dealer |
$XBD |
292.69 |
+2.10 |
+0.72% |
+0.80% |
| Retail |
$RLX |
3,480.04 |
-29.28 |
-0.83% |
+42.08% |
| Gold & Silver |
$XAU |
148.49 |
-4.79 |
-3.13% |
+38.88% |
| Bank |
$BKX |
75.98 |
+0.12 |
+0.16% |
-32.97% |
| Biotech |
$BTK |
5,459.93 |
-147.21 |
-2.63% |
+7.75% |
|
|
|
 |
Wedging Into New High Territory After Latest Earnings Report
Kenneth J. Gruneisen - Passed the CAN SLIM® Master's Exam
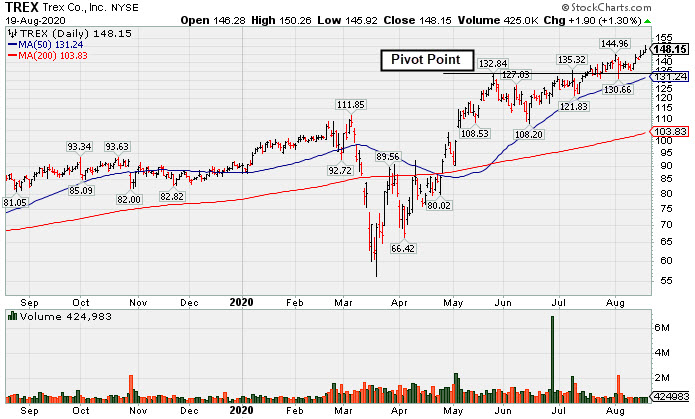
Trex Company Inc's (TREX +$1.90 or +1.30% to $148.15) hit another new all-time high with today's 3rd consecutive gain backed by light volume. It has been wedging above its "max buy" level with volume totals cooling. Important near-term support is at its 50-day moving average (DMA) line ($131.25). Recently it reported Jun '20 quarterly earnings +27% on +7% sales revenues versus the year ago period, its 4th consecutive quarterly comparison above the +25% minimum earnings guideline (C criteria). It was last shown in this FSU section on 7/30/20 with an annotated graph under the headline, "Perched Near All Time High With Earnings News Due Monday". It has earned the highest possible 99 Earnings Per Share Rating. Annual earnings (A criteria) growth has been strong. The company hails from the General Building Materials industry group which currently has a Group Relative Strength Rating of A-
The company has a new CEO as of 4/29/20. It has a small supply (S criteria) of only 57.9 million shares outstanding. The number of top-rated funds owning its shares rose from 540 in Jun '19 to 717 in Jun '20, a reassuring sign concerning the I criteria. Its current Up/Down Volume Ratio of 1.5 is an unbiased indication its shares have been under accumulation over the past 50 days. It has a Timeliness rating of A and a Sponsorship Rating of C.
|
|
|
Color Codes Explained :
Y - Better candidates highlighted by our
staff of experts.
G - Previously featured
in past reports as yellow but may no longer be buyable under the
guidelines.
***Last / Change / Volume data in this table is the closing quote data***
Symbol/Exchange
Company Name
Industry Group |
PRICE |
CHANGE
(%Change) |
Day High |
Volume
(% DAV)
(% 50 day avg vol) |
52 Wk Hi
% From Hi |
Featured
Date |
Price
Featured |
Pivot Featured |
|
Max Buy |
 CRL
-
NYSE
CRL
-
NYSE
Charles River Labs Intl
DRUGS - Biotechnology
|
$215.10
|
-2.05
-0.94% |
$218.37
|
261,782
69.81% of 50 DAV
50 DAV is 375,000
|
$221.97
-3.10%
|
7/15/2020
|
$192.66
|
PP = $189.95
|
|
MB = $199.45
|
Most Recent Note - 8/17/2020 6:10:53 PM
G - Volume totals have been cooling while hovering near its all-time high. Bullish action last week came after it reported Jun '20 quarterly earnings -3% on +4% sales revenues, below the +25% minimum guideline (C criteria) but better than expected while the company also raised its guidance. The prior high ($189.85 on 6/03/20) defines initial support to watch above its 50 DMA line ($191.37).
>>> FEATURED STOCK ARTICLE : Hit New Highs Again; EPS Rating Dropped Yet Remains High at 92 - 8/7/2020 |
View all notes |
Set NEW NOTE alert |
Company Profile |
SEC
News |
Chart |
Request a new note
C
A
S
I |
EBS
-
NYSE
Emergent Biosolutions
DRUGS - Biotechnology
|
$131.78
|
+1.86
1.43% |
$133.66
|
395,946
38.74% of 50 DAV
50 DAV is 1,022,000
|
$137.61
-4.24%
|
7/7/2020
|
$89.47
|
PP = $93.68
|
|
MB = $98.36
|
Most Recent Note - 8/18/2020 5:19:08 PM
G - Pulled back today with higher (near average) volume, yet it remains perched near its all-time high and very extended from any sound base. Bullish action came after it reported Jun '20 quarterly earnings +890% on +62% sales revenue for the Jun '20 quarter versus the year ago period. Prior highs in the $93 area define initial support above its 50 DMA line ($92.41).
>>> FEATURED STOCK ARTICLE : Rally Continues Into Record High Territory - 8/4/2020 |
View all notes |
Set NEW NOTE alert |
Company Profile |
SEC
News |
Chart |
Request a new note
C
A
S
I |
BMRN
-
NASDAQ
Biomarin Pharmaceutical
DRUGS - Drug Manufacturers - Other
|
$76.72
|
-41.83
-35.28% |
$85.85
|
34,046,843
2,651.62% of 50 DAV
50 DAV is 1,284,000
|
$131.95
-41.86%
|
6/17/2020
|
$110.95
|
PP = $112.67
|
|
MB = $118.30
|
 Most Recent Note - 8/19/2020 10:33:44 AM
Gapped down today for a damaging volume driven loss after the FDA declined to approve a gene therapy drug. It will be dropped from the Featured Stocks list tonight. Recently noted with caution on 8/13/20 - "Still sputtering below its 50 DMA line ($120). A prompt rebound above the 50 DMA line is needed for its outlook to improve. Recently reported Jun '20 quarterly earnings +220% on +11% sales revenues versus the year ago period, continuing its strong earnings track record."
>>> FEATURED STOCK ARTICLE : Hovering Above 50-Day Average After Another Strong Earnings Report - 8/5/2020 |
View all notes |
Set NEW NOTE alert |
Company Profile |
SEC
News |
Chart |
Request a new note
C
A
S
I |
AMD
-
NASDAQ
Advanced Micro Devices
ELECTRONICS - Semiconductor - Broad Line
|
$81.09
|
-0.57
-0.70% |
$81.85
|
37,289,569
57.24% of 50 DAV
50 DAV is 65,145,000
|
$87.29
-7.10%
|
7/22/2020
|
$61.73
|
PP = $59.10
|
|
MB = $62.06
|
Most Recent Note - 8/19/2020 5:53:34 PM
G - Volume totals have been cooling while it remains perched near its all-time high, very extended from the previously noted base. The recent low ($76.10 on 8/11/20) defines near-term support above its 50 DMA line ($63.93). Fundamentals remain strong.
>>> FEATURED STOCK ARTICLE : AMD Rose +46% Since First Featured on June 9th - 8/14/2020 |
View all notes |
Set NEW NOTE alert |
Company Profile |
SEC
News |
Chart |
Request a new note
C
A
S
I |
TREX
-
NYSE
Trex Company Inc
MATERIALS and CONSTRUCTION - General Building Materials
|
$148.15
|
+1.90
1.30% |
$150.26
|
424,983
49.59% of 50 DAV
50 DAV is 857,000
|
$147.50
0.44%
|
6/26/2020
|
$109.05
|
PP = $132.94
|
|
MB = $139.59
|
Most Recent Note - 8/19/2020 5:48:46 PM
G - Wedging into new all-time high territory with today's 3rd consecutive gain backed by light volume. It is extended from any sound base. Reported Jun '20 quarterly earnings +27% on +7% sales revenues versus the year ago period. Important near-term support is at its 50 DMA line ($131.25). See the latest FSU analysis for more details and a new annotated graph.
>>> FEATURED STOCK ARTICLE : Wedging Into New High Territory After Latest Earnings Report - 8/19/2020 |
View all notes |
Set NEW NOTE alert |
Company Profile |
SEC
News |
Chart |
Request a new note
C
A
S
I |
Symbol/Exchange
Company Name
Industry Group |
PRICE |
CHANGE
(%Change) |
Day High |
Volume
(% DAV)
(% 50 day avg vol) |
52 Wk Hi
% From Hi |
Featured
Date |
Price
Featured |
Pivot Featured |
|
Max Buy |
NFLX
-
NASDAQ
Netflix Inc
SPECIALTY RETAIL - Music and Video Stores
|
$484.53
|
-7.34
-1.49% |
$494.50
|
3,137,589
41.68% of 50 DAV
50 DAV is 7,527,000
|
$575.37
-15.79%
|
5/14/2020
|
$441.95
|
PP = $449.62
|
|
MB = $472.10
|
Most Recent Note - 8/18/2020 5:16:29 PM
G - Found prompt support last week after briefly undercutting both its 50 DMA line ($479.87) and prior low ($467.54). The rebound above the 50 DMA line helped its outlook improve, however, the volume behind recent gains has been very light. Fundamentals remain strong. See the latest FSU analysis for more details and a new annotated graph.
>>> FEATURED STOCK ARTICLE : 50-Day Moving Average Acted As Support Level - 8/18/2020 |
View all notes |
Set NEW NOTE alert |
Company Profile |
SEC
News |
Chart |
Request a new note
C
A
S
I |
CHGG
-
NYSE
Chegg Inc
Consumer Svcs-Education
|
$77.62
|
-0.60
-0.77% |
$78.94
|
5,790,870
159.18% of 50 DAV
50 DAV is 3,638,000
|
$89.82
-13.58%
|
6/17/2020
|
$63.71
|
PP = $68.08
|
|
MB = $71.48
|
Most Recent Note - 8/19/2020 12:10:15 PM
G - Churned heavier volume in recent weeks while pulling back, enduring distributional pressure after getting very extended from any sound base. Reported Jun '20 quarterly earnings +61% on +63% sales revenues versus the year ago period. Its 50 DMA line ($72.34) defines support to watch above its prior high in the $68 area. Any losses leading to violations would raise concerns and trigger technical sell signals.
>>> FEATURED STOCK ARTICLE : Bullish Action Continued After Latest Strong Earnings Report - 8/6/2020 |
View all notes |
Set NEW NOTE alert |
Company Profile |
SEC
News |
Chart |
Request a new note
C
A
S
I |
LGIH
-
NASDAQ
L G I Homes Inc
Bldg-Resident/Comml
|
$115.23
|
-0.01
-0.01% |
$115.57
|
233,929
70.89% of 50 DAV
50 DAV is 330,000
|
$123.94
-7.03%
|
7/7/2020
|
$99.19
|
PP = $95.82
|
|
MB = $100.61
|
Most Recent Note - 8/17/2020 6:16:17 PM
G - Posted a big gain today with light volume, rebounding toward its 52-week high. It is extended from the previously noted base. Its 50 DMA line ($101.27) defines near-term support to watch above prior highs in the $95 area.
>>> FEATURED STOCK ARTICLE : Earning News Due Next Week for Homebuilder - 7/31/2020 |
View all notes |
Set NEW NOTE alert |
Company Profile |
SEC
News |
Chart |
Request a new note
C
A
S
I |
NOW
-
NYSE
Servicenow Inc
Computer Sftwr-Enterprse
|
$437.13
|
-0.45
-0.10% |
$443.64
|
1,960,942
114.88% of 50 DAV
50 DAV is 1,707,000
|
$454.70
-3.86%
|
4/30/2020
|
$343.05
|
PP = $363.05
|
|
MB = $381.20
|
Most Recent Note - 8/19/2020 5:51:17 PM
G - It has nearly formed a new 5-week flat base, consolidating in an orderly fashion above its 50 DMA line ($419.67) which defines important near-term support to watch. Subsequent losses leading to a violation may trigger a technical sell signal. Reported Jun '20 quarterly earnings +73% on +28% sales revenues versus the year ago period.
>>> FEATURED STOCK ARTICLE : Consolidating Above 50-Day Average After Another Strong Quarter - 8/13/2020 |
View all notes |
Set NEW NOTE alert |
Company Profile |
SEC
News |
Chart |
Request a new note
C
A
S
I |
TTD
-
NASDAQ
The Trade Desk Inc Cl A
Comml Svcs-Advertising
|
$464.01
|
-5.07
-1.08% |
$470.55
|
605,816
41.30% of 50 DAV
50 DAV is 1,467,000
|
$510.00
-9.02%
|
6/3/2020
|
$340.61
|
PP = $327.35
|
|
MB = $343.72
|
Most Recent Note - 8/17/2020 6:14:53 PM
G - Quietly holding its ground still perched near its all-time high. Recently reported Jun '20 quarterly earnings -3% on -13% sales revenues versus the year ago period, raising fundamental concerns. It is extended from any sound base of sufficient length. Its 50 DMA line ($428.60) defines near-term support above the prior low ($404 on 7/24/20) where violations may trigger technical sell signals.
>>> FEATURED STOCK ARTICLE : Hovering Near High After Latest Quarterly Report Raised Concerns - 8/12/2020 |
View all notes |
Set NEW NOTE alert |
Company Profile |
SEC
News |
Chart |
Request a new note
C
A
S
I |
Symbol/Exchange
Company Name
Industry Group |
PRICE |
CHANGE
(%Change) |
Day High |
Volume
(% DAV)
(% 50 day avg vol) |
52 Wk Hi
% From Hi |
Featured
Date |
Price
Featured |
Pivot Featured |
|
Max Buy |
DOCU
-
NASDAQ
Docusign Inc
Computer Sftwr-Enterprse
|
$208.21
|
-1.26
-0.60% |
$212.17
|
1,878,539
36.85% of 50 DAV
50 DAV is 5,098,000
|
$229.83
-9.41%
|
6/10/2020
|
$149.73
|
PP = $152.10
|
|
MB = $159.71
|
Most Recent Note - 8/17/2020 6:09:27 PM
G - Posted a 4th consecutive gain with below average volume, consolidating above its 50 DMA line ($188.22) and prior low ($189.12 on 8/12/20) which define important near-term support to watch. See the latest FSU analysis for more details and a new annotated graph.
>>> FEATURED STOCK ARTICLE : Consolidating Above 50-Day Moving Average Line and Recent Low - 8/17/2020 |
View all notes |
Set NEW NOTE alert |
Company Profile |
SEC
News |
Chart |
Request a new note
C
A
S
I |
PING
-
NYSE
Ping Identity Holdings Corp
Computer Sftwr-Security
|
$32.55
|
+0.06
0.18% |
$32.97
|
741,931
56.49% of 50 DAV
50 DAV is 1,313,300
|
$37.80
-13.89%
|
6/1/2020
|
$29.24
|
PP = $29.90
|
|
MB = $31.40
|
Most Recent Note - 8/19/2020 5:52:46 PM
G - Reported Jun '20 quarterly earnings -27% on -6% sales revenues versus the year ago period, below the +25% minimum earnings guideline, raising fundamental concerns. It has been sputtering below its 50 DMA line ($32.85) after recent volume-driven losses. The next important near-term support is the prior highs in the $29 area. It has not formed a sound base of sufficient length. Completed Secondary Offerings on 7/09/20 and 5/15/20.
>>> FEATURED STOCK ARTICLE : Perched Near High With Earnings News Due Wednesday Evening - 8/10/2020 |
View all notes |
Set NEW NOTE alert |
Company Profile |
SEC
News |
Chart |
Request a new note
C
A
S
I |
|
|
|
THESE ARE NOT BUY RECOMMENDATIONS!
Comments contained in the body of this report are technical
opinions only. The material herein has been obtained
from sources believed to be reliable and accurate, however,
its accuracy and completeness cannot be guaranteed.
This site is not an investment advisor, hence it does
not endorse or recommend any securities or other investments.
Any recommendation contained in this report may not
be suitable for all investors and it is not to be deemed
an offer or solicitation on our part with respect to
the purchase or sale of any securities. All trademarks,
service marks and trade names appearing in this report
are the property of their respective owners, and are
likewise used for identification purposes only.
This report is a service available
only to active Paid Premium Members.
You may opt-out of receiving report notifications
at any time. Questions or comments may be submitted
by writing to Premium Membership Services 665 S.E. 10 Street, Suite 201 Deerfield Beach, FL 33441-5634 or by calling 1-800-965-8307
or 954-785-1121.
|
|
|