You are not logged in.
This means you
CAN ONLY VIEW reports that were published prior to Saturday, March 22, 2025.
You
MUST UPGRADE YOUR MEMBERSHIP if you want to see any current reports.
AFTER MARKET UPDATE - MONDAY, AUGUST 10TH, 2020
Previous After Market Report Next After Market Report >>>
|
|
|
|
DOW |
+357.96 |
27,791.44 |
+1.30% |
|
Volume |
864,062,986 |
+7% |
|
Volume |
3,996,062,800 |
-5% |
|
NASDAQ |
-42.62 |
10,968.36 |
-0.39% |
|
Advancers |
2,148 |
73% |
|
Advancers |
1,989 |
61% |
|
S&P 500 |
+9.19 |
3,360.47 |
+0.27% |
|
Decliners |
808 |
27% |
|
Decliners |
1,293 |
39% |
|
Russell 2000 |
+15.49 |
1,584.67 |
+0.99% |
|
52 Wk Highs |
123 |
|
|
52 Wk Highs |
133 |
|
|
S&P 600 |
+8.82 |
920.49 |
+0.97% |
|
52 Wk Lows |
5 |
|
|
52 Wk Lows |
8 |
|
|
 |
Tech Weakness Weighed on Nasdaq Composite Index
Kenneth J. Gruneisen - Passed the CAN SLIM® Master's Exam
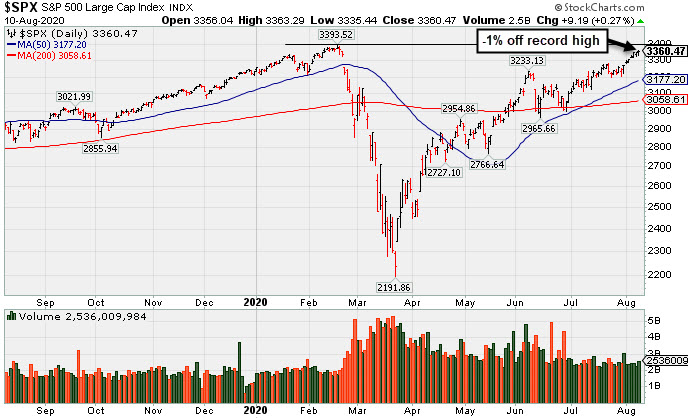
The S&P 500 rose for a seventh consecutive day, adding 0.3% and closing within 0.8% of its February 19th all-time high. The Dow rallied 357 points, while the Tech-heavy Nasdaq Composite declined for a second straight day, slipping 0.4%. The reported volume totals were mixed, higher than the prior session on the NYSE and lighter on the Nasdaq exchange. Breadth was positive as advancers led decliners by more than a 2-1 margin on the NYSE and by a 3-2 margin on the Nasdaq exchange. There were 72 high-ranked companies from the Leaders List that hit new 52-week highs and were listed on the BreakOuts Page, versus the total of 77 on the prior session. New 52-week highs totals solidly outnumbered new 52-week lows totals again on both the NYSE and the Nasdaq exchange. New 52-week lows totals on both exchanges were in the single digits. The major indices are in a confirmed uptrend (M criteria). Any sustainable rally requires a healthy crop of new leaders, so it remains ever-important to see substantial new highs totals. Charts used courtesy of www.stockcharts.com
PICTURED: The S&P 500 Index is perched -1% off its record high. Stocks finished mixed on Monday, as investors seemed to shy away from Tech-related stocks. Six of 11 S&P 500 sectors ended in positive territory with the Energy and Industrials groups pacing the gains. Information Technology and Communication Services were notable laggards, with the oft-cited FAANG group losing 0.9%. In earnings, Marriott International (MAR +3.57%) rose despite reporting a wider than anticipated loss and its first unprofitable quarter in nine years. In other corporate news, Simon Property Group (SPG +5.27%) rose after the company said it was in talks to turn empty department store spaces into Amazon (AMZN -0.61%) fulfillment centers. Elsewhere, casino companies with operations in Macau rallied after the city resumed granting tourist visas for visitors. Shares of Wynn Resorts (WYNN +9.96%) and MGM (MGM +13.77%) each posted big gains.
Investors also monitored updates on a federal fiscal stimulus package and U.S.-China tensions. Over the weekend, President Trump took executive action to extend economic aid on unemployment benefits, payroll taxes, eviction protection, and student-loan relief. Meanwhile, China sanctioned 11 Americans in retaliation to similar action taken by the United States last week over Hong Kong issues.
Treasuries declined, with the yield on the 10-year note up two basis points to 0.58%. In commodities, WTI crude added 1.8% to $41.97/barrel after Saudi Aramco said demand for crude should continue to improve. COMEX gold rose 0.4% to $2,017.70/ounce.
|
 Kenneth J. Gruneisen started out as a licensed stockbroker in August 1987, a couple of months prior to the historic stock market crash that took the Dow Jones Industrial Average down -22.6% in a single day. He has published daily fact-based fundamental and technical analysis on high-ranked stocks online for two decades. Through FACTBASEDINVESTING.COM, Kenneth provides educational articles, news, market commentary, and other information regarding proven investment systems that work in good times and bad.
Comments contained in the body of this report are technical opinions only and are not necessarily those of Gruneisen Growth Corp. The material herein has been obtained from sources believed to be reliable and accurate, however, its accuracy and completeness cannot be guaranteed. Our firm, employees, and customers may effect transactions, including transactions contrary to any recommendation herein, or have positions in the securities mentioned herein or options with respect thereto. Any recommendation contained in this report may not be suitable for all investors and it is not to be deemed an offer or solicitation on our part with respect to the purchase or sale of any securities. |
|
 |
Energy-Linked Groups Led Gainers and the Bank Index Rose
Kenneth J. Gruneisen - Passed the CAN SLIM® Master's Exam
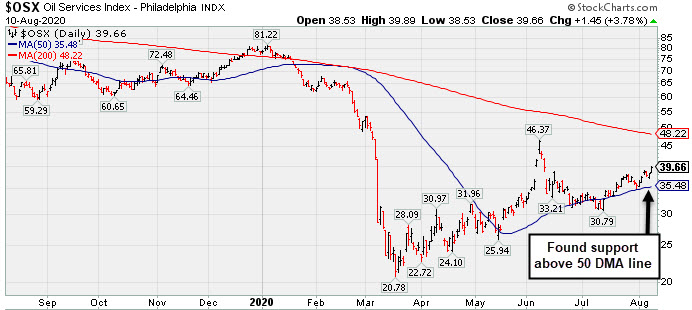
The Bank Index ($BKX +1.06%) posted a solid gain but the Broker/Dealer Index ($XBD -0.31%) edged lower and the Retail Index ($RLX +0.05%) finished flat. The Oil Services Index ($OSX +3.77%) and Integrated Oil Index ($XOI +2.94%) were standout gainers. The Semiconductor Index ($SOX +0.03%) finished flat while the Networking Index ($NWX -0.90%) and the Biotech Index ($BTK -1.12%) both lost ground. The Gold & Silver Index ($XAU -0.72%) also ended the session lower.PICTURED: The Oil Services Index ($OSX +3.77%) has recently been consolidating above its 50-day moving average (DMA) line which acted as support.
| Oil Services |
$OSX |
39.66 |
+1.44 |
+3.77% |
-49.34% |
| Integrated Oil |
$XOI |
779.30 |
+22.24 |
+2.94% |
-38.66% |
| Semiconductor |
$SOX |
2,179.60 |
+0.74 |
+0.03% |
+17.84% |
| Networking |
$NWX |
615.28 |
-5.60 |
-0.90% |
+5.46% |
| Broker/Dealer |
$XBD |
289.22 |
-0.91 |
-0.31% |
-0.40% |
| Retail |
$RLX |
3,367.94 |
+1.53 |
+0.05% |
+37.51% |
| Gold & Silver |
$XAU |
153.03 |
-1.11 |
-0.72% |
+43.13% |
| Bank |
$BKX |
78.24 |
+0.82 |
+1.06% |
-30.98% |
| Biotech |
$BTK |
5,614.42 |
-63.61 |
-1.12% |
+10.79% |
|
|
|
 |
Perched Near High With Earnings News Due Wednesday Evening
Kenneth J. Gruneisen - Passed the CAN SLIM® Master's Exam
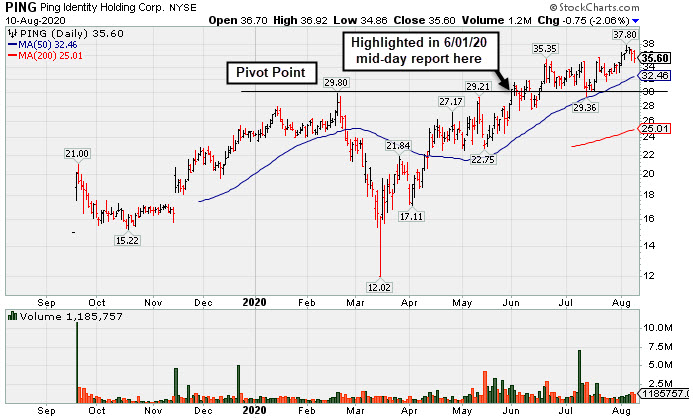
Ping Identity Hldg Corp (PING -$0.75 or -2.06% to $35.60) pulled back from its all-time high with today's 2nd consecutive loss. Its 50-day moving average (DMA) line ($32.46) defines important near-term support above its prior highs in the $29 area. It has not formed a sound base of sufficient length. Keep in mind it is due to report Jun '20 quarterly results after the close on Wednesday, 8/12/20. Volume and volatility often increase near earnings news.
PING was last shown in this FSU section on 7/16/20 with an annotated graph under the headline, "Consolidating Above 50-Day Moving Average Following Secondary". It completed Secondary Offerings on 7/09/20 and 5/15/20. It was highlighted in yellow with new pivot point cited based on its 2/20/20 high plus 10 cents in the 6/01/20 mid-day report (read here). The gain above the pivot point on 6/18/20 was backed by +127% above average volume triggering a technical buy signal as it hit a new 52-week high (N criteria).
Its $15 IPO was completed on 9/19/19. The number of top-rated funds owning its shares rose from 83 in Sep '19 to 192 in Jun '20, a reassuring sign concerning the I criteria. Its current Up/Down Volume Ratio of 1.5 is an unbiased indication its shares have been under accumulation over the past 50 days.
The Computer Software-Security firm has reported strong earnings results well above the +25% minimum guideline (C criteria) in the 4 latest quarterly comparisons through Mar '20 versus the year ago periods. Limited earnings history is a concern, however, leadership in the Computer Software - Security industry group (L criteria) is a reassuring sign. The groups is currently ranked 25th of the 197 industry groups.
|
|
|
Color Codes Explained :
Y - Better candidates highlighted by our
staff of experts.
G - Previously featured
in past reports as yellow but may no longer be buyable under the
guidelines.
***Last / Change / Volume data in this table is the closing quote data***
Symbol/Exchange
Company Name
Industry Group |
PRICE |
CHANGE
(%Change) |
Day High |
Volume
(% DAV)
(% 50 day avg vol) |
52 Wk Hi
% From Hi |
Featured
Date |
Price
Featured |
Pivot Featured |
|
Max Buy |
 FTNT
-
NASDAQ
FTNT
-
NASDAQ
Fortinet Inc
Computer Sftwr-Security
|
$126.88
|
-4.12
-3.15% |
$132.82
|
1,627,938
101.72% of 50 DAV
50 DAV is 1,600,400
|
$151.95
-16.50%
|
6/22/2020
|
$142.68
|
PP = $149.79
|
|
MB = $157.28
|
Most Recent Note - 8/7/2020 12:47:28 PM
G - Color code is changed to green after it gapped down today, violating its 50 DMA line ($137), following its Jun '20 quarterly report of earnings +41% on +18% sales revenues versus the year ago period. Prior low ($124.24 on 7/15/20) defines the next important support level to watch. Faces resistance due to overhead supply up to the $151 level which may hinder upward price progress.
>>> FEATURED STOCK ARTICLE : Rebounded Above 50-Day Average; Earnings News Due on - 8/3/2020 |
View all notes |
Set NEW NOTE alert |
Company Profile |
SEC
News |
Chart |
Request a new note
C
A
S
I |
CRL
-
NYSE
Charles River Labs Intl
DRUGS - Biotechnology
|
$218.76
|
-2.84
-1.28% |
$221.97
|
485,375
122.88% of 50 DAV
50 DAV is 395,000
|
$221.64
-1.30%
|
7/15/2020
|
$192.66
|
PP = $189.95
|
|
MB = $199.45
|
Most Recent Note - 8/7/2020 5:53:12 PM
G - Hit yet another new all-time high with today's gain backed by +29% above average volume. Bullish action came after it reported Jun '20 quarterly earnings -3% on +4% sales revenues, below the +25% minimum guideline (C criteria) but better than expected while the company also raised its guidance. The prior high ($189.85 on 6/03/20) defines initial support to watch above its 50 DMA line ($187.28). See the latest FSU analysis for more details and a new annotated graph.
>>> FEATURED STOCK ARTICLE : Hit New Highs Again; EPS Rating Dropped Yet Remains High at 92 - 8/7/2020 |
View all notes |
Set NEW NOTE alert |
Company Profile |
SEC
News |
Chart |
Request a new note
C
A
S
I |
EBS
-
NYSE
Emergent Biosolutions
DRUGS - Biotechnology
|
$130.19
|
-0.47
-0.36% |
$130.55
|
969,830
94.53% of 50 DAV
50 DAV is 1,026,000
|
$137.61
-5.39%
|
7/7/2020
|
$89.47
|
PP = $93.68
|
|
MB = $98.36
|
 Most Recent Note - 8/10/2020 6:14:42 PM
G - Hovering near its all-time high, very extended from any sound base. Bullish action came after it reported Jun '20 quarterly earnings +890% on +62% sales revenue for the Jun '20 quarter versus the year ago period. Prior highs in the $93 area define initial support above its 50 DMA line ($90).
>>> FEATURED STOCK ARTICLE : Rally Continues Into Record High Territory - 8/4/2020 |
View all notes |
Set NEW NOTE alert |
Company Profile |
SEC
News |
Chart |
Request a new note
C
A
S
I |
BMRN
-
NASDAQ
Biomarin Pharmaceutical
DRUGS - Drug Manufacturers - Other
|
$118.25
|
-0.42
-0.35% |
$118.66
|
785,280
56.99% of 50 DAV
50 DAV is 1,378,000
|
$131.95
-10.38%
|
6/17/2020
|
$110.95
|
PP = $112.67
|
|
MB = $118.30
|
Most Recent Note - 8/10/2020 6:13:38 PM
G - Slumped below its 50 DMA line ($119.52) with a streak of 3 consecutive losses backed by light volume. A prompt rebound above the 50 DMA line is needed for its outlook to improve. Sputtering since it recently reported Jun '20 quarterly earnings +220% on +11% sales revenues versus the year ago period, continuing its strong earnings track record.
>>> FEATURED STOCK ARTICLE : Hovering Above 50-Day Average After Another Strong Earnings Report - 8/5/2020 |
View all notes |
Set NEW NOTE alert |
Company Profile |
SEC
News |
Chart |
Request a new note
C
A
S
I |
AUDC
-
NASDAQ
Audiocodes Ltd
ELECTRONICS - Scientific and Technical Instrum
|
$34.20
|
-1.90
-5.26% |
$36.58
|
872,094
104.82% of 50 DAV
50 DAV is 832,000
|
$44.94
-23.90%
|
7/17/2020
|
$37.16
|
PP = $40.16
|
|
MB = $42.17
|
Most Recent Note - 8/10/2020 6:06:27 PM
G - Violated its 50 DMA line ($34.77) with today's damaging loss raising greater concerns and triggering a worrisome technical sell signal. Only a prompt rebound above the 50 DMA line would help its outlook improve. Disciplined investors always limit losses by selling any stock that falls more than 7-8% from their purchase price. Reported Jun '20 quarterly earnings +45% on +8% sales revenues versus the year-ago period.
>>> FEATURED STOCK ARTICLE : Resilient and High-Ranked VOIP Firm Rebounding Near Highs - 7/17/2020 |
View all notes |
Set NEW NOTE alert |
Company Profile |
SEC
News |
Chart |
Request a new note
C
A
S
I |
Symbol/Exchange
Company Name
Industry Group |
PRICE |
CHANGE
(%Change) |
Day High |
Volume
(% DAV)
(% 50 day avg vol) |
52 Wk Hi
% From Hi |
Featured
Date |
Price
Featured |
Pivot Featured |
|
Max Buy |
AMD
-
NASDAQ
Advanced Micro Devices
ELECTRONICS - Semiconductor - Broad Line
|
$82.24
|
-2.61
-3.08% |
$85.16
|
70,396,839
110.41% of 50 DAV
50 DAV is 63,760,000
|
$87.29
-5.79%
|
7/22/2020
|
$61.73
|
PP = $59.10
|
|
MB = $62.06
|
Most Recent Note - 8/10/2020 6:10:15 PM
G - Pulled back from its all-time high with today's 2nd consecutive loss on near average volume. Reported earnings +125% on +26% sales revenues for the Jun '20 quarter versus the year ago period. Very extended from the previously noted base. Disciplined investors avoid chasing stocks more than +5% above prior highs. Its 50 DMA line ($60) and prior highs in the $59 area define important support to watch on pullbacks.
>>> FEATURED STOCK ARTICLE : Pullback After Breakout Gain Backed by +152% Above Average Volume - 7/23/2020 |
View all notes |
Set NEW NOTE alert |
Company Profile |
SEC
News |
Chart |
Request a new note
C
A
S
I |
TREX
-
NYSE
Trex Company Inc
MATERIALS and CONSTRUCTION - General Building Materials
|
$137.08
|
-1.96
-1.41% |
$139.21
|
484,479
52.15% of 50 DAV
50 DAV is 929,000
|
$144.96
-5.44%
|
6/26/2020
|
$109.05
|
PP = $132.94
|
|
MB = $139.59
|
Most Recent Note - 8/10/2020 6:17:17 PM
Y - Hovering near its all-time high, and its color code is changed to yellow after pulling back below its "max buy" level with a loss on light volume. Reported Jun '20 quarterly earnings +27% on +7% sales revenues versus the year ago period. Important near-term support is at its 50 DMA line ($128).
>>> FEATURED STOCK ARTICLE : Perched Near All Time High With Earnings News Due Monday - 7/30/2020 |
View all notes |
Set NEW NOTE alert |
Company Profile |
SEC
News |
Chart |
Request a new note
C
A
S
I |
NFLX
-
NASDAQ
Netflix Inc
SPECIALTY RETAIL - Music and Video Stores
|
$483.38
|
-11.35
-2.29% |
$497.46
|
4,668,745
61.40% of 50 DAV
50 DAV is 7,604,000
|
$575.37
-15.99%
|
5/14/2020
|
$441.95
|
PP = $449.62
|
|
MB = $472.10
|
Most Recent Note - 8/7/2020 5:39:06 PM
G - Consolidating well above its 50 DMA line ($471.56) and the prior low ($467.54) which define important near-term support to watch. Extended from the prior base. Fundamentals remain strong.
>>> FEATURED STOCK ARTICLE : Consolidating After Getting Extended From Prior Base - 7/29/2020 |
View all notes |
Set NEW NOTE alert |
Company Profile |
SEC
News |
Chart |
Request a new note
C
A
S
I |
CHGG
-
NYSE
Chegg Inc
Consumer Svcs-Education
|
$81.53
|
-5.45
-6.27% |
$88.32
|
3,878,750
107.77% of 50 DAV
50 DAV is 3,599,000
|
$89.82
-9.23%
|
6/17/2020
|
$63.71
|
PP = $68.08
|
|
MB = $71.48
|
Most Recent Note - 8/10/2020 6:02:01 PM
G - Retreated abruptly from its all-time high with today's big loss after getting very extended from any sound base. Reported Jun '20 quarterly earnings +61% on +63% sales revenues versus the year ago period. Its 50 DMA line ($69.89) defines support to watch above its prior high in the $68 area. Any losses leading to violations would raise concerns and trigger technical sell signals.
>>> FEATURED STOCK ARTICLE : Bullish Action Continued After Latest Strong Earnings Report - 8/6/2020 |
View all notes |
Set NEW NOTE alert |
Company Profile |
SEC
News |
Chart |
Request a new note
C
A
S
I |
LGIH
-
NASDAQ
L G I Homes Inc
Bldg-Resident/Comml
|
$110.15
|
-1.89
-1.69% |
$115.20
|
292,063
85.15% of 50 DAV
50 DAV is 343,000
|
$123.94
-11.13%
|
7/7/2020
|
$99.19
|
PP = $95.82
|
|
MB = $100.61
|
Most Recent Note - 8/10/2020 5:59:30 PM
G - Pulling back after getting very extended from the previously noted base. Its 50 DMA line ($99.11) defines near-term support to watch above prior highs in the $95 area.
>>> FEATURED STOCK ARTICLE : Earning News Due Next Week for Homebuilder - 7/31/2020 |
View all notes |
Set NEW NOTE alert |
Company Profile |
SEC
News |
Chart |
Request a new note
C
A
S
I |
Symbol/Exchange
Company Name
Industry Group |
PRICE |
CHANGE
(%Change) |
Day High |
Volume
(% DAV)
(% 50 day avg vol) |
52 Wk Hi
% From Hi |
Featured
Date |
Price
Featured |
Pivot Featured |
|
Max Buy |
NOW
-
NYSE
Servicenow Inc
Computer Sftwr-Enterprse
|
$438.68
|
+7.47
1.73% |
$439.13
|
2,717,874
159.97% of 50 DAV
50 DAV is 1,699,000
|
$454.70
-3.52%
|
4/30/2020
|
$343.05
|
PP = $363.05
|
|
MB = $381.20
|
Most Recent Note - 8/10/2020 6:07:57 PM
G - Posted a gain today with above average volume. Still hovering near its all-time high, stubbornly holding its ground. It has not formed a sound base. Its 50 DMA line ($413) defines important near-term support to watch where a violation may trigger a technical sell signal. Reported Jun '20 quarterly earnings +73% on +28% sales revenues versus the year ago period.
>>> FEATURED STOCK ARTICLE : Perched Near All-Time High With Earnings News Due Next Week - 7/22/2020 |
View all notes |
Set NEW NOTE alert |
Company Profile |
SEC
News |
Chart |
Request a new note
C
A
S
I |
TTD
-
NASDAQ
The Trade Desk Inc Cl A
Comml Svcs-Advertising
|
$465.73
|
-27.47
-5.57% |
$493.37
|
1,952,830
119.15% of 50 DAV
50 DAV is 1,639,000
|
$510.00
-8.68%
|
6/3/2020
|
$340.61
|
PP = $327.35
|
|
MB = $343.72
|
Most Recent Note - 8/10/2020 6:04:25 PM
G - Suffered a 2nd big volume-driven loss in the span of 3 sessions. Weak action came after it reported Jun '20 quarterly earnings -3% on -13% sales revenues versus the year ago period. It is extended from any sound base of sufficient length. Its 50 DMA line ($415.74) and prior low ($404 on 7/24/20) define near-term support to watch where violations may trigger technical sell signals.
>>> FEATURED STOCK ARTICLE : Rebounded Near All-Time High With Gain Backed by Light Volume - 7/20/2020 |
View all notes |
Set NEW NOTE alert |
Company Profile |
SEC
News |
Chart |
Request a new note
C
A
S
I |
DOCU
-
NASDAQ
Docusign Inc
Computer Sftwr-Enterprse
|
$198.38
|
-6.38
-3.12% |
$207.60
|
4,970,822
89.13% of 50 DAV
50 DAV is 5,577,000
|
$229.83
-13.68%
|
6/10/2020
|
$149.73
|
PP = $152.10
|
|
MB = $159.71
|
Most Recent Note - 8/7/2020 5:36:47 PM
G - Pulled back today with higher (near average) volume behind a 2nd consecutive loss while abruptly retreating from its all-time high. Still very extended from any sound base. Its 50 DMA line ($181.65) defines near-term support to watch. DOCU is now priced +88% above its 200 DMA price, and it is taught in the Certification that a stock trading +70-100% or more above the 200 DMA is to be recognized as a "sell signal".
>>> FEATURED STOCK ARTICLE : E-Signature Firm is Extended From Any Sound Base - 7/28/2020 |
View all notes |
Set NEW NOTE alert |
Company Profile |
SEC
News |
Chart |
Request a new note
C
A
S
I |
PING
-
NYSE
Ping Identity Hldg Corp
Computer Sftwr-Security
|
$35.60
|
-0.75
-2.06% |
$36.92
|
1,185,813
89.36% of 50 DAV
50 DAV is 1,327,000
|
$37.80
-5.82%
|
6/1/2020
|
$29.24
|
PP = $29.90
|
|
MB = $31.40
|
Most Recent Note - 8/10/2020 5:57:07 PM
G - Pulled back from its all-time high with today's 2nd consecutive loss. Due to report Jun '20 quarterly earnings news after the close on Wednesday, 8/12/20. Its 50 DMA line ($32.46) defines important near-term support above prior highs in the $29 area. It has not formed a sound base of sufficient length. Completed Secondary Offerings on 7/09/20 and 5/15/20. See the latest FSU analysis for more details and a new annotated graph.
>>> FEATURED STOCK ARTICLE : Perched Near High With Earnings News Due Wednesday Evening - 8/10/2020 |
View all notes |
Set NEW NOTE alert |
Company Profile |
SEC
News |
Chart |
Request a new note
C
A
S
I |
ZEN
-
NYSE
Zendesk Inc
Computer Sftwr-Enterprse
|
$87.26
|
-1.12
-1.27% |
$89.83
|
1,938,298
87.42% of 50 DAV
50 DAV is 2,217,300
|
$101.94
-14.40%
|
7/21/2020
|
$94.29
|
PP = $94.97
|
|
MB = $99.72
|
Most Recent Note - 8/7/2020 5:46:47 PM
G - Color code is changed to green while slumping further into the prior base as its Relative Strength Rating has fallen to 74, below the 80+ minimum guideline for buy candidates. Testing the 50 DMA line ($88.57) which defines important near term support, and any loss and subsequent violation may trigger a technical sell signal. Weak action came after it reported Jun '20 quarterly earnings +180% on +27% sales revenues versus the year-ago period.
>>> FEATURED STOCK ARTICLE : Pullback Below Pivot Point Following Breakout Gain - 7/21/2020 |
View all notes |
Set NEW NOTE alert |
Company Profile |
SEC
News |
Chart |
Request a new note
C
A
S
I |
Symbol/Exchange
Company Name
Industry Group |
PRICE |
CHANGE
(%Change) |
Day High |
Volume
(% DAV)
(% 50 day avg vol) |
52 Wk Hi
% From Hi |
Featured
Date |
Price
Featured |
Pivot Featured |
|
Max Buy |
|
|
|
THESE ARE NOT BUY RECOMMENDATIONS!
Comments contained in the body of this report are technical
opinions only. The material herein has been obtained
from sources believed to be reliable and accurate, however,
its accuracy and completeness cannot be guaranteed.
This site is not an investment advisor, hence it does
not endorse or recommend any securities or other investments.
Any recommendation contained in this report may not
be suitable for all investors and it is not to be deemed
an offer or solicitation on our part with respect to
the purchase or sale of any securities. All trademarks,
service marks and trade names appearing in this report
are the property of their respective owners, and are
likewise used for identification purposes only.
This report is a service available
only to active Paid Premium Members.
You may opt-out of receiving report notifications
at any time. Questions or comments may be submitted
by writing to Premium Membership Services 665 S.E. 10 Street, Suite 201 Deerfield Beach, FL 33441-5634 or by calling 1-800-965-8307
or 954-785-1121.
|
|
|