You are not logged in.
This means you
CAN ONLY VIEW reports that were published prior to Monday, April 14, 2025.
You
MUST UPGRADE YOUR MEMBERSHIP if you want to see any current reports.
AFTER MARKET UPDATE - THURSDAY, AUGUST 20TH, 2020
Previous After Market Report Next After Market Report >>>
|
|
|
|
DOW |
+46.85 |
27,739.73 |
+0.17% |
|
Volume |
706,924,362 |
-8% |
|
Volume |
4,119,783,900 |
+19% |
|
NASDAQ |
+115.68 |
11,262.14 |
+1.04% |
|
Advancers |
1,198 |
40% |
|
Advancers |
1,301 |
40% |
|
S&P 500 |
+10.66 |
3,385.51 |
+0.32% |
|
Decliners |
1,761 |
59% |
|
Decliners |
1,969 |
60% |
|
Russell 2000 |
-7.76 |
1,564.30 |
-0.49% |
|
52 Wk Highs |
54 |
|
|
52 Wk Highs |
79 |
|
|
S&P 600 |
-7.69 |
900.74 |
-0.85% |
|
52 Wk Lows |
20 |
|
|
52 Wk Lows |
27 |
|
|
 |
Nasdaq Composite Outpaces Major Indices as Leadership Wanes
Kenneth J. Gruneisen - Passed the CAN SLIM® Master's Exam
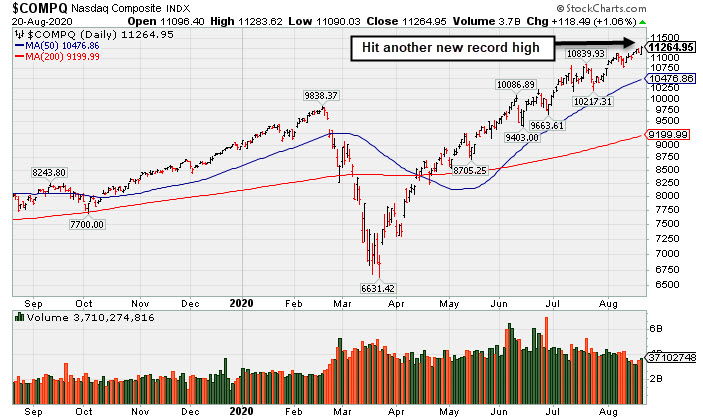
The Dow added 46 points, while the S&P 500 advanced 0.3%. The Nasdaq Composite jumped 1.1%, notching a fresh record high. The reported volume totals were mixed, lighter than the prior session total on the NYSE yet higher on the Nasdaq exchange. Advancers led decliners by almost a 3-2 margin on the NYSE and on the Nasdaq exchange. There were 26 high-ranked companies from the Leaders List that hit new 52-week highs and were listed on the BreakOuts Page, versus the total of 33 on the prior session. New 52-week highs totals contracted yet still outnumbered new 52-week lows totals on both the NYSE and the Nasdaq exchange. The major indices are in a confirmed uptrend (M criteria). Any sustainable rally requires a healthy crop of new leaders, so it remains ever-important to see substantial new highs totals.
Charts used courtesy of www.stockcharts.com
PICTURED: The Nasdaq Composite Index hit another new record high. Stocks ended higher on Thursday as gains in Technology shares helped offset disappointing employment data and yesterday’s update from the Federal Reserve. On the data front, initial jobless claims unexpectedly climbed to 1.1 million in the week ending August 15 from the prior 971,000 figure. The uptick underscored the release of Federal Reserve’s meeting minutes yesterday, in which policymakers provided a downbeat assessment of the economic recovery amid uncertainty surrounding the pandemic. Separately, the leading index of economic indicators rose 1.4% last month, while June’s reading was upwardly revised. Another report showed the Philadelphia Fed’s business outlook weakened more than forecasted in August. Treasuries strengthened, with the yield on the 10-year note down three basis points to 0.65%.
Seven of 11 S&P 500 sectors ended in negative territory, with Energy shares lagging the most amid a drop in oil prices. WTI crude slipped 0.8% to $42.58/barrel after major producers tempered oil demand recovery prospects. Tech stocks outperformed, with the oft-cited FAANG group rising more than 2%. Meanwhile, Intel advanced 1.9% after announcing it would repurchase $10 billion of its own shares by year-end. In earnings, L Brands (LB +3.86%) following a surprise quarterly profit tally, while Estee Lauder (EL -6.70%) fell after posting a larger-than-anticipated loss. In other corporate news, Uber (UBER +6.76%) and Lyft (LYFT +5.76%) both posted solid gains after a California appeals court agreed to provide an extension in reclassifying their independent contracts to employees.
|
 Kenneth J. Gruneisen started out as a licensed stockbroker in August 1987, a couple of months prior to the historic stock market crash that took the Dow Jones Industrial Average down -22.6% in a single day. He has published daily fact-based fundamental and technical analysis on high-ranked stocks online for two decades. Through FACTBASEDINVESTING.COM, Kenneth provides educational articles, news, market commentary, and other information regarding proven investment systems that work in good times and bad.
Comments contained in the body of this report are technical opinions only and are not necessarily those of Gruneisen Growth Corp. The material herein has been obtained from sources believed to be reliable and accurate, however, its accuracy and completeness cannot be guaranteed. Our firm, employees, and customers may effect transactions, including transactions contrary to any recommendation herein, or have positions in the securities mentioned herein or options with respect thereto. Any recommendation contained in this report may not be suitable for all investors and it is not to be deemed an offer or solicitation on our part with respect to the purchase or sale of any securities. |
|
 |
Gold & Silver and Retail Index Posted Gains
Kenneth J. Gruneisen - Passed the CAN SLIM® Master's Exam
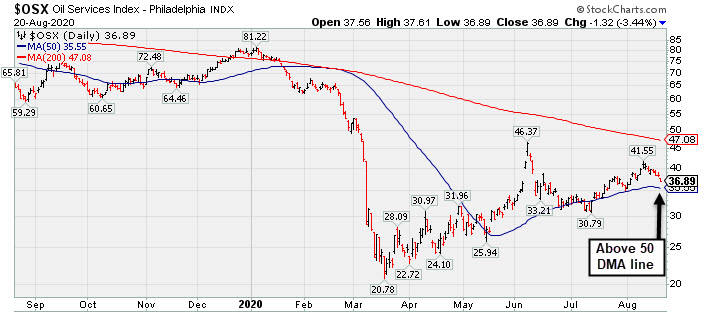
The Broker/Dealer Index ($XBD -1.15%) and Bank Index ($BKX -1.78%) both lost ground and weighed on the major indices while the Retail Index ($RLX +0.25%) eked out a small gain. The tech sector had a slightly negative bias as the Semiconductor Index ($SOX -0.90%), Biotech Index ($BTK -0.72%), and Networking Index ($NWX -0.59%) finished unanimously lower. Commodity-linked groups were mixed as the Oil Services Index ($OSX -3.45%) and Integrated Oil Index ($XOI -2.10%) both slumped while the Gold & Silver Index ($XAU +1.61%) posted a solid gain.
PICTURED: The Oil Services Index ($OSX -3.45%) is consolidating above its 50-day moving average (DMA) line.
| Oil Services |
$OSX |
36.89 |
-1.32 |
-3.45% |
-52.88% |
| Integrated Oil |
$XOI |
732.09 |
-15.71 |
-2.10% |
-42.38% |
| Semiconductor |
$SOX |
2,181.04 |
-19.73 |
-0.90% |
+17.92% |
| Networking |
$NWX |
599.45 |
-3.54 |
-0.59% |
+2.75% |
| Broker/Dealer |
$XBD |
289.33 |
-3.36 |
-1.15% |
-0.36% |
| Retail |
$RLX |
3,488.61 |
+8.57 |
+0.25% |
+42.43% |
| Gold & Silver |
$XAU |
150.88 |
+2.39 |
+1.61% |
+41.11% |
| Bank |
$BKX |
74.63 |
-1.35 |
-1.78% |
-34.17% |
| Biotech |
$BTK |
5,420.89 |
-39.04 |
-0.72% |
+6.97% |
|
|
|
 |
Leadership in Building - Residential/Commercial Group Improving
Kenneth J. Gruneisen - Passed the CAN SLIM® Master's Exam
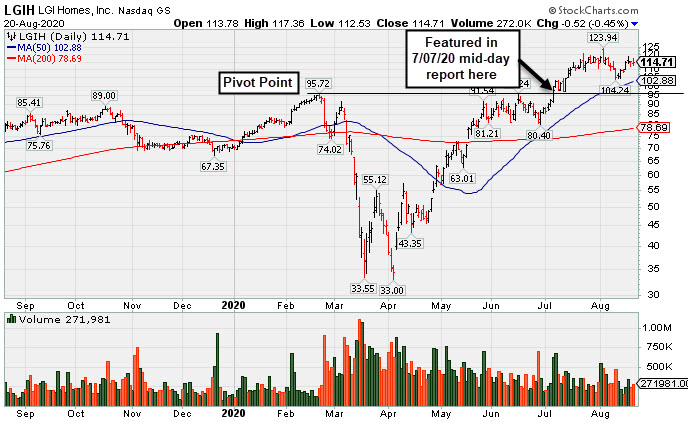
L G I Homes Inc (LGIH -$0.52 or -0.45% to $114.71) recently rebounded toward its 52-week high. It is extended from the previously noted base. Its 50-day moving average (DMA) line ($102.88) defines near-term support to watch above prior highs in the $95 area. LGIH traded up as much as +21.5% since highlighted in yellow with pivot point cited based on its 2/21/20 high plus 10 cents in the 7/07/20 mid-day report (read here).
LGIH was last shown in this FSU section on 7/31/20 under the headline, "Earning News Due Next Week for Homebuilder". It reported Jun '20 quarterly earnings +21% on +4% sales revenues versus the year ago period, breaking a streak of 3 consecutive quarterly comparisons above the +25% minimum earnings guideline (C criteria). Its annual earnings (A criteria) history has been strong. Fundamentals have still been strong enough for it to get a 99 Earnings Per Share Rating, the highest possible rank. The Building - Residential / Commercial Group Relative Strength Rating of B+ (74) has improved in recent weeks revealing greater leadership (L criteria) in the industry group. It has a small supply (S criteria) of only 22.1 million shares in the public float (S criteria). The number of top-rated funds owning its shares rose from 372 in Dec '19 to 383 in Jun '20, and its current Up/Down Volume Ratio of 1.4 is an unbiased indication its shares have been under accumulation over the past 50 days. It has a Timeliness Rating of A and a Sponsorship Rating of E. LGIH completed its IPO at $11 on 11/07/13. Charts courtesy www.stockcharts.com
 |
|
|
Color Codes Explained :
Y - Better candidates highlighted by our
staff of experts.
G - Previously featured
in past reports as yellow but may no longer be buyable under the
guidelines.
***Last / Change / Volume data in this table is the closing quote data***
Symbol/Exchange
Company Name
Industry Group |
PRICE |
CHANGE
(%Change) |
Day High |
Volume
(% DAV)
(% 50 day avg vol) |
52 Wk Hi
% From Hi |
Featured
Date |
Price
Featured |
Pivot Featured |
|
Max Buy |
 CRL
-
NYSE
CRL
-
NYSE
Charles River Labs Intl
DRUGS - Biotechnology
|
$214.71
|
-0.39
-0.18% |
$216.60
|
185,154
49.51% of 50 DAV
50 DAV is 374,000
|
$221.97
-3.27%
|
7/15/2020
|
$192.66
|
PP = $189.95
|
|
MB = $199.45
|
Most Recent Note - 8/17/2020 6:10:53 PM
G - Volume totals have been cooling while hovering near its all-time high. Bullish action last week came after it reported Jun '20 quarterly earnings -3% on +4% sales revenues, below the +25% minimum guideline (C criteria) but better than expected while the company also raised its guidance. The prior high ($189.85 on 6/03/20) defines initial support to watch above its 50 DMA line ($191.37).
>>> FEATURED STOCK ARTICLE : Hit New Highs Again; EPS Rating Dropped Yet Remains High at 92 - 8/7/2020 |
View all notes |
Set NEW NOTE alert |
Company Profile |
SEC
News |
Chart |
Request a new note
C
A
S
I |
EBS
-
NYSE
Emergent Biosolutions
DRUGS - Biotechnology
|
$131.12
|
-0.66
-0.50% |
$131.67
|
301,619
29.92% of 50 DAV
50 DAV is 1,008,000
|
$137.61
-4.72%
|
7/7/2020
|
$89.47
|
PP = $93.68
|
|
MB = $98.36
|
Most Recent Note - 8/18/2020 5:19:08 PM
G - Pulled back today with higher (near average) volume, yet it remains perched near its all-time high and very extended from any sound base. Bullish action came after it reported Jun '20 quarterly earnings +890% on +62% sales revenue for the Jun '20 quarter versus the year ago period. Prior highs in the $93 area define initial support above its 50 DMA line ($92.41).
>>> FEATURED STOCK ARTICLE : Rally Continues Into Record High Territory - 8/4/2020 |
View all notes |
Set NEW NOTE alert |
Company Profile |
SEC
News |
Chart |
Request a new note
C
A
S
I |
AMD
-
NASDAQ
Advanced Micro Devices
ELECTRONICS - Semiconductor - Broad Line
|
$82.77
|
+1.68
2.07% |
$82.84
|
42,728,838
66.46% of 50 DAV
50 DAV is 64,297,000
|
$87.29
-5.18%
|
7/22/2020
|
$61.73
|
PP = $59.10
|
|
MB = $62.06
|
Most Recent Note - 8/19/2020 5:53:34 PM
G - Volume totals have been cooling while it remains perched near its all-time high, very extended from the previously noted base. The recent low ($76.10 on 8/11/20) defines near-term support above its 50 DMA line ($63.93). Fundamentals remain strong.
>>> FEATURED STOCK ARTICLE : AMD Rose +46% Since First Featured on June 9th - 8/14/2020 |
View all notes |
Set NEW NOTE alert |
Company Profile |
SEC
News |
Chart |
Request a new note
C
A
S
I |
TREX
-
NYSE
Trex Company Inc
MATERIALS and CONSTRUCTION - General Building Materials
|
$146.44
|
-1.71
-1.15% |
$147.50
|
330,337
38.77% of 50 DAV
50 DAV is 852,000
|
$150.26
-2.54%
|
6/26/2020
|
$109.05
|
PP = $132.94
|
|
MB = $139.59
|
Most Recent Note - 8/19/2020 5:48:46 PM
G - Wedging into new all-time high territory with today's 3rd consecutive gain backed by light volume. It is extended from any sound base. Reported Jun '20 quarterly earnings +27% on +7% sales revenues versus the year ago period. Important near-term support is at its 50 DMA line ($131.25). See the latest FSU analysis for more details and a new annotated graph.
>>> FEATURED STOCK ARTICLE : Wedging Into New High Territory After Latest Earnings Report - 8/19/2020 |
View all notes |
Set NEW NOTE alert |
Company Profile |
SEC
News |
Chart |
Request a new note
C
A
S
I |
NFLX
-
NASDAQ
Netflix Inc
SPECIALTY RETAIL - Music and Video Stores
|
$497.90
|
+13.37
2.76% |
$498.94
|
5,077,698
68.12% of 50 DAV
50 DAV is 7,454,000
|
$575.37
-13.46%
|
5/14/2020
|
$441.95
|
PP = $449.62
|
|
MB = $472.10
|
 Most Recent Note - 8/20/2020 5:30:30 PM
G - Posted a solid gain today with light volume. Found prompt support last week after briefly undercutting its 50 DMA line ($482). Volume behind recent gains has been very light. Fundamentals remain strong. See the latest FSU analysis for more details and an annotated graph.
>>> FEATURED STOCK ARTICLE : 50-Day Moving Average Acted As Support Level - 8/18/2020 |
View all notes |
Set NEW NOTE alert |
Company Profile |
SEC
News |
Chart |
Request a new note
C
A
S
I |
Symbol/Exchange
Company Name
Industry Group |
PRICE |
CHANGE
(%Change) |
Day High |
Volume
(% DAV)
(% 50 day avg vol) |
52 Wk Hi
% From Hi |
Featured
Date |
Price
Featured |
Pivot Featured |
|
Max Buy |
CHGG
-
NYSE
Chegg Inc
Consumer Svcs-Education
|
$77.90
|
+0.28
0.36% |
$78.00
|
3,485,643
93.88% of 50 DAV
50 DAV is 3,713,000
|
$89.82
-13.27%
|
6/17/2020
|
$63.71
|
PP = $68.08
|
|
MB = $71.48
|
Most Recent Note - 8/19/2020 12:10:15 PM
G - Churned heavier volume in recent weeks while pulling back, enduring distributional pressure after getting very extended from any sound base. Reported Jun '20 quarterly earnings +61% on +63% sales revenues versus the year ago period. Its 50 DMA line ($72.34) defines support to watch above its prior high in the $68 area. Any losses leading to violations would raise concerns and trigger technical sell signals.
>>> FEATURED STOCK ARTICLE : Bullish Action Continued After Latest Strong Earnings Report - 8/6/2020 |
View all notes |
Set NEW NOTE alert |
Company Profile |
SEC
News |
Chart |
Request a new note
C
A
S
I |
LGIH
-
NASDAQ
L G I Homes Inc
Bldg-Resident/Comml
|
$114.71
|
-0.52
-0.45% |
$117.36
|
266,583
81.03% of 50 DAV
50 DAV is 329,000
|
$123.94
-7.45%
|
7/7/2020
|
$99.19
|
PP = $95.82
|
|
MB = $100.61
|
Most Recent Note - 8/20/2020 5:28:17 PM
G - Recently rebounding toward its 52-week high, showing resilience after its latest earnings report. It is extended from the previously noted base. Its 50 DMA line ($102.88) defines near-term support to watch above prior highs in the $95 area. Reported Jun '20 quarterly earnings +21% on +4% sales revenues, breaking a streak of 4 comparisons above the +25% minimum guideline (C criteria). See the latest FSU analysis for more details and a new annotated graph.
>>> FEATURED STOCK ARTICLE : Leadership in Building - Residential/Commercial Group Improving - 8/20/2020 |
View all notes |
Set NEW NOTE alert |
Company Profile |
SEC
News |
Chart |
Request a new note
C
A
S
I |
NOW
-
NYSE
Servicenow Inc
Computer Sftwr-Enterprse
|
$453.34
|
+16.21
3.71% |
$454.73
|
2,413,173
140.96% of 50 DAV
50 DAV is 1,712,000
|
$454.70
-0.30%
|
8/20/2020
|
$453.34
|
PP = $454.79
|
|
MB = $477.53
|
Most Recent Note - 8/20/2020 5:35:07 PM
Y - Hit a new high and managed a best-ever close with today's gain backed by +41% above average volume. Color code is changed to yellow with new pivot point cited based on its 7/20/20 high plus 10 cents. Confirming gains above the pivot point backed by at least +40% above average volume may trigger a proper new (or add-on) technical buy signal. Its 50 DMA line ($420) defines important near-term support to watch. Subsequent losses leading to a violation may trigger a technical sell signal. Reported Jun '20 quarterly earnings +73% on +28% sales revenues versus the year ago period.
>>> FEATURED STOCK ARTICLE : Consolidating Above 50-Day Average After Another Strong Quarter - 8/13/2020 |
View all notes |
Set NEW NOTE alert |
Company Profile |
SEC
News |
Chart |
Request a new note
C
A
S
I |
TTD
-
NASDAQ
The Trade Desk Inc Cl A
Comml Svcs-Advertising
|
$470.26
|
+6.25
1.35% |
$472.09
|
542,292
37.32% of 50 DAV
50 DAV is 1,453,000
|
$510.00
-7.79%
|
6/3/2020
|
$340.61
|
PP = $327.35
|
|
MB = $343.72
|
Most Recent Note - 8/17/2020 6:14:53 PM
G - Quietly holding its ground still perched near its all-time high. Recently reported Jun '20 quarterly earnings -3% on -13% sales revenues versus the year ago period, raising fundamental concerns. It is extended from any sound base of sufficient length. Its 50 DMA line ($428.60) defines near-term support above the prior low ($404 on 7/24/20) where violations may trigger technical sell signals.
>>> FEATURED STOCK ARTICLE : Hovering Near High After Latest Quarterly Report Raised Concerns - 8/12/2020 |
View all notes |
Set NEW NOTE alert |
Company Profile |
SEC
News |
Chart |
Request a new note
C
A
S
I |
DOCU
-
NASDAQ
Docusign Inc
Computer Sftwr-Enterprse
|
$214.48
|
+6.27
3.01% |
$215.50
|
2,322,124
45.97% of 50 DAV
50 DAV is 5,051,000
|
$229.83
-6.68%
|
6/10/2020
|
$149.73
|
PP = $152.10
|
|
MB = $159.71
|
Most Recent Note - 8/17/2020 6:09:27 PM
G - Posted a 4th consecutive gain with below average volume, consolidating above its 50 DMA line ($188.22) and prior low ($189.12 on 8/12/20) which define important near-term support to watch. See the latest FSU analysis for more details and a new annotated graph.
>>> FEATURED STOCK ARTICLE : Consolidating Above 50-Day Moving Average Line and Recent Low - 8/17/2020 |
View all notes |
Set NEW NOTE alert |
Company Profile |
SEC
News |
Chart |
Request a new note
C
A
S
I |
Symbol/Exchange
Company Name
Industry Group |
PRICE |
CHANGE
(%Change) |
Day High |
Volume
(% DAV)
(% 50 day avg vol) |
52 Wk Hi
% From Hi |
Featured
Date |
Price
Featured |
Pivot Featured |
|
Max Buy |
PING
-
NYSE
Ping Identity Holdings Corp
Computer Sftwr-Security
|
$34.21
|
+1.66
5.10% |
$34.49
|
1,662,381
127.57% of 50 DAV
50 DAV is 1,303,100
|
$37.80
-9.50%
|
6/1/2020
|
$29.24
|
PP = $29.90
|
|
MB = $31.40
|
Most Recent Note - 8/20/2020 12:34:36 PM
G - Today's big gain has it rebounding above its 50 DMA line ($32.93) helping its technical stance improve. Recently reported Jun '20 quarterly earnings -27% on -6% sales revenues versus the year ago period, below the +25% minimum earnings guideline, raising fundamental concerns. The next important near-term support below the 50 DMA line is the prior highs in the $29 area. It has not formed a sound base of sufficient length. Completed Secondary Offerings on 7/09/20 and 5/15/20.
>>> FEATURED STOCK ARTICLE : Perched Near High With Earnings News Due Wednesday Evening - 8/10/2020 |
View all notes |
Set NEW NOTE alert |
Company Profile |
SEC
News |
Chart |
Request a new note
C
A
S
I |
|
|
|
THESE ARE NOT BUY RECOMMENDATIONS!
Comments contained in the body of this report are technical
opinions only. The material herein has been obtained
from sources believed to be reliable and accurate, however,
its accuracy and completeness cannot be guaranteed.
This site is not an investment advisor, hence it does
not endorse or recommend any securities or other investments.
Any recommendation contained in this report may not
be suitable for all investors and it is not to be deemed
an offer or solicitation on our part with respect to
the purchase or sale of any securities. All trademarks,
service marks and trade names appearing in this report
are the property of their respective owners, and are
likewise used for identification purposes only.
This report is a service available
only to active Paid Premium Members.
You may opt-out of receiving report notifications
at any time. Questions or comments may be submitted
by writing to Premium Membership Services 665 S.E. 10 Street, Suite 201 Deerfield Beach, FL 33441-5634 or by calling 1-800-965-8307
or 954-785-1121.
|
|
|