You are not logged in.
This means you
CAN ONLY VIEW reports that were published prior to Sunday, March 23, 2025.
You
MUST UPGRADE YOUR MEMBERSHIP if you want to see any current reports.
AFTER MARKET UPDATE - TUESDAY, AUGUST 4TH, 2020
Previous After Market Report Next After Market Report >>>
|
|
|
|
DOW |
+164.07 |
26,828.47 |
+0.62% |
|
Volume |
863,278,908 |
-1% |
|
Volume |
3,958,279,500 |
-4% |
|
NASDAQ |
+38.37 |
10,941.17 |
+0.35% |
|
Advancers |
1,902 |
64% |
|
Advancers |
1,919 |
60% |
|
S&P 500 |
+11.90 |
3,306.51 |
+0.36% |
|
Decliners |
1,057 |
36% |
|
Decliners |
1,305 |
40% |
|
Russell 2000 |
+10.41 |
1,517.21 |
+0.69% |
|
52 Wk Highs |
101 |
|
|
52 Wk Highs |
207 |
|
|
S&P 600 |
+4.95 |
881.14 |
+0.56% |
|
52 Wk Lows |
10 |
|
|
52 Wk Lows |
20 |
|
|
 |
Major Indices Rose as Spot Gold Topped $2,000 Per Ounce
Kenneth J. Gruneisen - Passed the CAN SLIM® Master's Exam
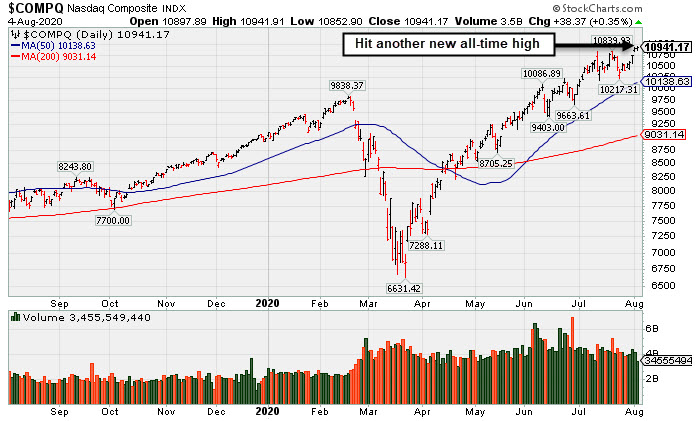
The Dow rose 164 points, while the S&P 500 and Nasdaq Composite both gained 0.4%. The reported volume totals were lighter than the prior session on the NYSE and higher on the Nasdaq exchange. Advancers led declines by a 9-5 margin on the NYSE and 3-2 on the Nasdaq exchange. There were 83 high-ranked companies from the Leaders List that hit new 52-week highs and were listed on the BreakOuts Page, versus the total of 119 on the prior session. New 52-week highs totals solidly outnumbered new 52-week lows totals on both the NYSE and the Nasdaq exchange. The major indices are in a confirmed uptrend (M criteria). Any sustainable rally requires a healthy crop of new leaders, so it remains ever-important to see substantial new highs totals. Charts used courtesy of www.stockcharts.com
PICTURED: The Nasdaq Composite Index hit yet another new record high. Stocks ended higher on Tuesday as investors digested corporate earnings reports and awaited further fiscal stimulus updates from Washington. Lawmakers in Washington continued to negotiate a fifth coronavirus relief bill ahead of their summer recess, which begins on Friday. Media reports show bipartisan support for another stimulus check, but differences remain on whether to extend the additional federal unemployment aid.
Nine of 11 S&P 500 sectors finished in positive territory, with Financials and Health Care the day’s laggards. The Energy group paced the gains, with BP (BP +7.47%) rose after the British oil and gas producer halved its dividend and announced a new strategy shifting from oil and gas. In other earnings, Mosaic (MOS +13.52%) jumped after the fertilizer distributor posted a surprise profit tally. Meanwhile, American International Group (AIG -7.53%) fell after delivering a $7.9 billion loss. Take-Two Interactive (TTWO +5.87%) rose after pandemic-inspired lockdowns provided a boost to sales, which more than doubled last quarter. Elsewhere, Advanced Micro Devices (AMD +9.49%) rose after the chipmaker was the subject of positive analyst comments.
On the data front, factory orders increased 6.2% in June, topping estimates for a 5% gain. Additionally, final updates on both durable and capital goods orders were upwardly revised for the same period. Treasuries strengthened, with the yield on the 10-year note down three basis points to 0.51%. In commodities, WTI crude added 1.2% to $41.52/barrel. COMEX gold climbed 2.4%, taking spot prices above the $2,000/ounce mark for the first time.
|
 Kenneth J. Gruneisen started out as a licensed stockbroker in August 1987, a couple of months prior to the historic stock market crash that took the Dow Jones Industrial Average down -22.6% in a single day. He has published daily fact-based fundamental and technical analysis on high-ranked stocks online for two decades. Through FACTBASEDINVESTING.COM, Kenneth provides educational articles, news, market commentary, and other information regarding proven investment systems that work in good times and bad.
Comments contained in the body of this report are technical opinions only and are not necessarily those of Gruneisen Growth Corp. The material herein has been obtained from sources believed to be reliable and accurate, however, its accuracy and completeness cannot be guaranteed. Our firm, employees, and customers may effect transactions, including transactions contrary to any recommendation herein, or have positions in the securities mentioned herein or options with respect thereto. Any recommendation contained in this report may not be suitable for all investors and it is not to be deemed an offer or solicitation on our part with respect to the purchase or sale of any securities. |
|
 |
Commodity-Linked Groups Outpaced Retail and Tech Indices
Kenneth J. Gruneisen - Passed the CAN SLIM® Master's Exam
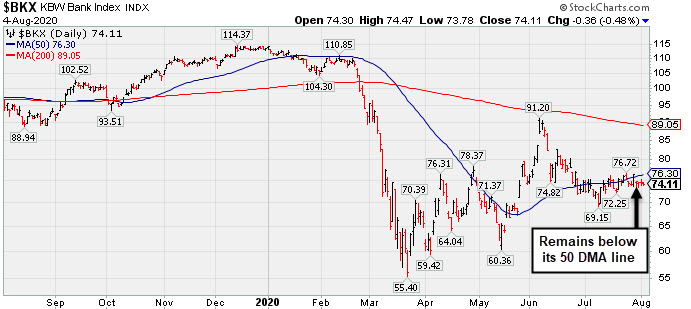
Commodity-linked groups had a positive bias as the Gold & Silver Index ($XAU +4.27%) outpaced the Oil Services Index ($OSX +2.86%) and the Integrated Oil Index ($XOI +1.90%). The Semiconductor Index ($SOX +1.49%) and Networking Index ($NWX +0.98%) both led the tech sector higher, meanwhile the Biotech Index ($BTK -1.07%) fell. The Retail Index ($RLX +0.83%) and Broker/Dealer Index ($XBD +0.42%) posted gains.
PICTURED: The Bank Index ($BKX -0.48%) is still sputtering below its 50-day moving average (DMA) line.
| Oil Services |
$OSX |
37.40 |
+1.04 |
+2.86% |
-52.23% |
| Integrated Oil |
$XOI |
754.07 |
+14.06 |
+1.90% |
-40.65% |
| Semiconductor |
$SOX |
2,209.81 |
+32.54 |
+1.49% |
+19.47% |
| Networking |
$NWX |
610.12 |
+5.91 |
+0.98% |
+4.58% |
| Broker/Dealer |
$XBD |
283.45 |
+1.17 |
+0.42% |
-2.39% |
| Retail |
$RLX |
3,327.82 |
+27.48 |
+0.83% |
+35.87% |
| Gold & Silver |
$XAU |
159.31 |
+6.52 |
+4.27% |
+49.00% |
| Bank |
$BKX |
74.11 |
-0.36 |
-0.48% |
-34.62% |
| Biotech |
$BTK |
5,745.29 |
-62.02 |
-1.07% |
+13.38% |
|
|
|
 |
Rally Continues Into Record High Territory
Kenneth J. Gruneisen - Passed the CAN SLIM® Master's Exam
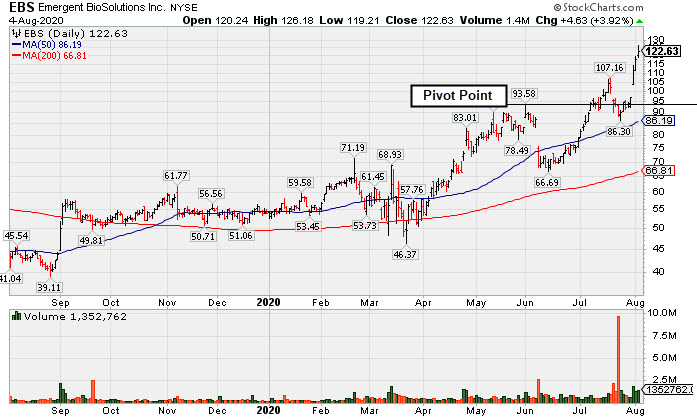
Emergent Biosolutions (EBS +$4.63 or +3.92% to $122.63) hit yet another new all-time high with higher volume behind today's 5th consecutive gain, rallying further above its "max buy" level. Recent strength came after it reported Jun '20 quarterly earnings +890% on +62% sales revenue for the Jun '20 quarter versus the year ago period. Prior highs in the $93 area define initial support above its 50-day moving average (DMA) line ($86.19).
EBS showed resilience since last shown in this FSU section on 7/09/20 with an annotated graph under the headline, "Impressive Rebound to Hit a New High". It currently has a 94 Earnings Per Share Rating, putting it in the top 10% of all publicly traded companies based on its earnings history. It reported Mar '20 earnings of 1 cent per share versus a 10 cents per share loss for the year ago period with +1% better sales revenues. Earnings rose +101% on +33% sales revenues for the Dec '19 quarter, and earnings rose +120% on +80% sales revenues in the Sep '19 quarter, very strong quarterly comparisons versus the year ago periods. Annual earnings history (A criteria) has been strong since a downturn in FY '16.
It has a small supply (S criteria) of only 45.5 million shares in the publicly traded float which can contribute to greater price volatility in the event of institutional buying or selling. The number of top-rated funds owning its shares rose from 453 in Sep '19 to 536 in Jun '20, and its current Up/Down Volume Ratio of 1.0 is an unbiased indication its shares have been neutral concerning accumulation/distribution over the past 50 days. It has an A Timeliness rating and an A- Accumulation/Distribution rating. The company is in the Medical - Biomed/Biotech industry group which is a leading group currently ranked 35th out of the 197 industry groups (L criteria). |
|
|
Color Codes Explained :
Y - Better candidates highlighted by our
staff of experts.
G - Previously featured
in past reports as yellow but may no longer be buyable under the
guidelines.
***Last / Change / Volume data in this table is the closing quote data***
Symbol/Exchange
Company Name
Industry Group |
PRICE |
CHANGE
(%Change) |
Day High |
Volume
(% DAV)
(% 50 day avg vol) |
52 Wk Hi
% From Hi |
Featured
Date |
Price
Featured |
Pivot Featured |
|
Max Buy |
 FTNT
-
NASDAQ
FTNT
-
NASDAQ
Fortinet Inc
Computer Sftwr-Security
|
$138.83
|
+0.61
0.44% |
$138.86
|
1,027,089
63.68% of 50 DAV
50 DAV is 1,613,000
|
$151.95
-8.63%
|
6/22/2020
|
$142.68
|
PP = $149.79
|
|
MB = $157.28
|
Most Recent Note - 8/3/2020 5:29:27 PM
Y - Due to report earnings news on 8/06/20. Consolidating just above its 50 DMA line ($137). Faces some near-term resistance due to overhead supply up to the $151 level. See the latest FSU analysis for more details and a new annotated graph.
>>> FEATURED STOCK ARTICLE : Rebounded Above 50-Day Average; Earnings News Due on - 8/3/2020 |
View all notes |
Set NEW NOTE alert |
Company Profile |
SEC
News |
Chart |
Request a new note
C
A
S
I |
CRL
-
NYSE
Charles River Labs Intl
DRUGS - Biotechnology
|
$203.92
|
-3.65
-1.76% |
$207.17
|
324,030
84.82% of 50 DAV
50 DAV is 382,000
|
$208.44
-2.17%
|
7/15/2020
|
$192.66
|
PP = $189.95
|
|
MB = $199.45
|
Most Recent Note - 8/3/2020 5:37:01 PM
G - Color code is changed to green after rallying well above its "max buy" level and hitting a new all-time high with today's big gain backed by (higher) near average volume. The prior high ($189.85 on 6/03/20) defines initial support to watch above its 50 DMA line ($183.96). Due to report Jun '20 quarterly earnings news before the open on Wednesday, 8/05/20.
>>> FEATURED STOCK ARTICLE : Volume +71% Above Average Behind Breakout - 7/15/2020 |
View all notes |
Set NEW NOTE alert |
Company Profile |
SEC
News |
Chart |
Request a new note
C
A
S
I |
EBS
-
NYSE
Emergent Biosolutions
DRUGS - Biotechnology
|
$122.63
|
+4.63
3.92% |
$126.19
|
1,355,783
140.35% of 50 DAV
50 DAV is 966,000
|
$119.63
2.51%
|
7/7/2020
|
$89.47
|
PP = $93.68
|
|
MB = $98.36
|
 Most Recent Note - 8/4/2020 5:51:01 PM
G - Hit yet another new all-time high with higher volume behind today's 5th consecutive gain, rallying further above its "max buy" level. Bullish action came after it reported Jun '20 quarterly earnings +890% on +62% sales revenue for the Jun '20 quarter versus the year ago period. Prior highs in the $93 area define initial support above its 50 DMA line ($86.19). See the latest FSU analysis for more details and a new annotated graph.
>>> FEATURED STOCK ARTICLE : Rally Continues Into Record High Territory - 8/4/2020 |
View all notes |
Set NEW NOTE alert |
Company Profile |
SEC
News |
Chart |
Request a new note
C
A
S
I |
NBIX
-
NASDAQ
Neurocrine Biosciences
DRUGS - Biotechnology
|
$120.16
|
-2.85
-2.32% |
$126.71
|
1,564,960
190.38% of 50 DAV
50 DAV is 822,000
|
$136.27
-11.82%
|
5/19/2020
|
$123.71
|
PP = $119.75
|
|
MB = $125.74
|
Most Recent Note - 8/4/2020 12:41:18 PM
G - Reported Jun '20 quarterly earnings +100% on +65% sales revenues versus the year ago period. Traded up earlier, but reversed into the red. A rebound and close above the 50 DMA line ($124.34) is needed for its outlook to improve.
>>> FEATURED STOCK ARTICLE : Consolidating Near 50-Day Moving Average; Earnings Report Due - 7/27/2020 |
View all notes |
Set NEW NOTE alert |
Company Profile |
SEC
News |
Chart |
Request a new note
C
A
S
I |
BMRN
-
NASDAQ
Biomarin Pharmaceutical
DRUGS - Drug Manufacturers - Other
|
$119.83
|
-2.21
-1.81% |
$122.69
|
1,128,400
75.83% of 50 DAV
50 DAV is 1,488,000
|
$131.95
-9.19%
|
6/17/2020
|
$110.95
|
PP = $112.67
|
|
MB = $118.30
|
Most Recent Note - 8/4/2020 5:54:16 PM
G - After the close today it reported Jun '20 quarterly earnings +220% on +11% sales revenues versus the year ago period. Volume and volatility often increases near earnings news. Consolidating above its "max buy" level and near its 50 DMA line ($118.44) which defines important near-term support to watch.
>>> FEATURED STOCK ARTICLE : Hovering Near High With Volume Totals Cooling - 7/10/2020 |
View all notes |
Set NEW NOTE alert |
Company Profile |
SEC
News |
Chart |
Request a new note
C
A
S
I |
Symbol/Exchange
Company Name
Industry Group |
PRICE |
CHANGE
(%Change) |
Day High |
Volume
(% DAV)
(% 50 day avg vol) |
52 Wk Hi
% From Hi |
Featured
Date |
Price
Featured |
Pivot Featured |
|
Max Buy |
AUDC
-
NASDAQ
Audiocodes Ltd
ELECTRONICS - Scientific and Technical Instrum
|
$36.98
|
-0.14
-0.38% |
$37.81
|
554,344
67.44% of 50 DAV
50 DAV is 822,000
|
$44.94
-17.71%
|
7/17/2020
|
$37.16
|
PP = $40.16
|
|
MB = $42.17
|
Most Recent Note - 8/3/2020 5:41:33 PM
G - Reported Jun '20 quarterly earnings +45% on +8% sales revenues versus the year-ago period. Halted its slide with today's gain backed by average volume after 4 damaging losses. Its slump back below the pivot point and into the prior base raised concerns. Disciplined investors always limit losses by selling any stock that falls more than 7-8% from their purchase price.
>>> FEATURED STOCK ARTICLE : Resilient and High-Ranked VOIP Firm Rebounding Near Highs - 7/17/2020 |
View all notes |
Set NEW NOTE alert |
Company Profile |
SEC
News |
Chart |
Request a new note
C
A
S
I |
AMD
-
NASDAQ
Advanced Micro Devices
ELECTRONICS - Semiconductor - Broad Line
|
$85.04
|
+7.37
9.49% |
$85.81
|
155,320,652
250.73% of 50 DAV
50 DAV is 61,948,000
|
$78.96
7.70%
|
7/22/2020
|
$61.73
|
PP = $59.10
|
|
MB = $62.06
|
Most Recent Note - 8/4/2020 12:20:29 PM
G - Hitting yet another new all-time high with today's volume-driven gain. Reported earnings +125% on +26% sales revenues for the Jun '20 quarter versus the year ago period. Getting very extended from the previously noted base. Disciplined investors avoid chasing stocks more than +5% above prior highs. The prior highs in the $59 area define initial support to watch on pullbacks.
>>> FEATURED STOCK ARTICLE : Pullback After Breakout Gain Backed by +152% Above Average Volume - 7/23/2020 |
View all notes |
Set NEW NOTE alert |
Company Profile |
SEC
News |
Chart |
Request a new note
C
A
S
I |
TREX
-
NYSE
Trex Company Inc
MATERIALS and CONSTRUCTION - General Building Materials
|
$138.92
|
-5.58
-3.86% |
$143.04
|
2,212,189
238.38% of 50 DAV
50 DAV is 928,000
|
$144.96
-4.17%
|
6/26/2020
|
$109.05
|
PP = $132.94
|
|
MB = $139.59
|
Most Recent Note - 8/4/2020 1:05:17 PM
G - Pulling back today on higher volume after hitting a new all-time high on the prior session with recent gains backed by below average volume. Reported Jun '20 quarterly earnings +27% on +7% sales revenues versus the year ago period. Volume and volatility often increase near earnings news. Important near-term support is at its 50 DMA line ($126.74). See the latest FSU analysis for more details and an annotated graph.
>>> FEATURED STOCK ARTICLE : Perched Near All Time High With Earnings News Due Monday - 7/30/2020 |
View all notes |
Set NEW NOTE alert |
Company Profile |
SEC
News |
Chart |
Request a new note
C
A
S
I |
NFLX
-
NASDAQ
Netflix Inc
SPECIALTY RETAIL - Music and Video Stores
|
$509.64
|
+11.02
2.21% |
$510.44
|
5,551,110
71.16% of 50 DAV
50 DAV is 7,801,000
|
$575.37
-11.42%
|
5/14/2020
|
$441.95
|
PP = $449.62
|
|
MB = $472.10
|
Most Recent Note - 8/4/2020 5:56:17 PM
G - Found support well above its 50 DMA line ($466) and prior highs in the $458 area during the recent consolidation. Extended from the prior base, and consolidating after reporting Jun '20 earnings +165% on +25% sales revenues versus the year ago period.
>>> FEATURED STOCK ARTICLE : Consolidating After Getting Extended From Prior Base - 7/29/2020 |
View all notes |
Set NEW NOTE alert |
Company Profile |
SEC
News |
Chart |
Request a new note
C
A
S
I |
CHGG
-
NYSE
Chegg Inc
Consumer Svcs-Education
|
$85.18
|
-0.75
-0.87% |
$87.88
|
9,701,471
279.42% of 50 DAV
50 DAV is 3,472,000
|
$87.97
-3.17%
|
6/17/2020
|
$63.71
|
PP = $68.08
|
|
MB = $71.48
|
Most Recent Note - 8/4/2020 12:27:16 PM
G - Abruptly retreating from its all-time high with today's volume-driven loss breaking a streak of consecutive gains. Very extended from any sound base. Reported Jun '20 quarterly earnings +61% on +63% sales revenues versus the year ago period. Volume and volatility often increase near earnings news. Prior high in the $68 area defines support to watch coinciding with its 50 DMA line ($67.95) where any losses leading to violations would raise concerns and trigger technical sell signals.
>>> FEATURED STOCK ARTICLE : Negative Reversal After Recently Wedging into New High Territory - 7/13/2020 |
View all notes |
Set NEW NOTE alert |
Company Profile |
SEC
News |
Chart |
Request a new note
C
A
S
I |
Symbol/Exchange
Company Name
Industry Group |
PRICE |
CHANGE
(%Change) |
Day High |
Volume
(% DAV)
(% 50 day avg vol) |
52 Wk Hi
% From Hi |
Featured
Date |
Price
Featured |
Pivot Featured |
|
Max Buy |
LGIH
-
NASDAQ
L G I Homes Inc
Bldg-Resident/Comml
|
$116.16
|
-2.05
-1.73% |
$123.94
|
484,745
138.90% of 50 DAV
50 DAV is 349,000
|
$120.54
-3.63%
|
7/7/2020
|
$99.19
|
PP = $95.82
|
|
MB = $100.61
|
Most Recent Note - 8/3/2020 5:58:47 PM
G - Due to report Jun '20 quarterly earnings news before the open on Tuesday, 8/04/20. Posted a gain today with above average for a new best-ever close, getting very extended from the previously noted base. Prior highs in the $95 area and its 50 DMA line ($96.21) define near-term support to watch on pullbacks.
>>> FEATURED STOCK ARTICLE : Earning News Due Next Week for Homebuilder - 7/31/2020 |
View all notes |
Set NEW NOTE alert |
Company Profile |
SEC
News |
Chart |
Request a new note
C
A
S
I |
NOW
-
NYSE
Servicenow Inc
Computer Sftwr-Enterprse
|
$438.15
|
-1.81
-0.41% |
$442.49
|
1,140,672
66.20% of 50 DAV
50 DAV is 1,723,000
|
$454.70
-3.64%
|
4/30/2020
|
$343.05
|
PP = $363.05
|
|
MB = $381.20
|
Most Recent Note - 8/4/2020 5:57:33 PM
G - Still hovering near its all-time high, stubbornly holding its ground. It has not formed a sound base. Its 50 DMA line ($408.65) defines important near-term support to watch where a violation may trigger a technical sell signal. Reported Jun '20 quarterly earnings +73% on +28% sales revenues versus the year ago period.
>>> FEATURED STOCK ARTICLE : Perched Near All-Time High With Earnings News Due Next Week - 7/22/2020 |
View all notes |
Set NEW NOTE alert |
Company Profile |
SEC
News |
Chart |
Request a new note
C
A
S
I |
TEAM
-
NASDAQ
Atlassian Corp Plc Cl A
Comp Sftwr-Spec Enterprs
|
$177.47
|
-0.48
-0.27% |
$180.90
|
2,059,661
102.68% of 50 DAV
50 DAV is 2,006,000
|
$198.41
-10.55%
|
7/7/2020
|
$190.44
|
PP = $191.82
|
|
MB = $201.41
|
Most Recent Note - 7/31/2020 1:16:38 PM
G - Color code is changed to green after gapping down today and violating its 50 DMA line ($181.13) with a damaging volume-driven loss triggering a technical sell signal. Weak action came after it reported Jun '20 quarterly earnings +25% on +29% sales revenues versus the year ago period. Volume and volatility often increase near earnings news. Recent gains above the pivot point lacked the +40% above average volume necessary to trigger a convincing new (or add-on) technical buy signal. The prior low ($169.11 on 7/14/20) defines the next important support below its 50 DMA line.
>>> FEATURED STOCK ARTICLE : Consolidating Near High With Earnings News Due Soon - 7/24/2020 |
View all notes |
Set NEW NOTE alert |
Company Profile |
SEC
News |
Chart |
Request a new note
C
A
S
I |
TTD
-
NASDAQ
The Trade Desk Inc Cl A
Comml Svcs-Advertising
|
$481.11
|
+5.79
1.22% |
$483.64
|
818,961
49.45% of 50 DAV
50 DAV is 1,656,000
|
$478.20
0.61%
|
6/3/2020
|
$340.61
|
PP = $327.35
|
|
MB = $343.72
|
Most Recent Note - 8/3/2020 5:35:05 PM
G - Due to report earnings news after the close on Thursday, 8/06/20. Posted a big gain today backed by below average volume and hit a new all-time high, getting very extended from any sound base. Its 50 DMA line ($397.62) defines near-term support to watch.
>>> FEATURED STOCK ARTICLE : Rebounded Near All-Time High With Gain Backed by Light Volume - 7/20/2020 |
View all notes |
Set NEW NOTE alert |
Company Profile |
SEC
News |
Chart |
Request a new note
C
A
S
I |
DOCU
-
NASDAQ
Docusign Inc
Computer Sftwr-Enterprse
|
$227.68
|
+1.40
0.62% |
$229.41
|
2,560,404
45.61% of 50 DAV
50 DAV is 5,614,000
|
$227.33
0.15%
|
6/10/2020
|
$149.73
|
PP = $152.10
|
|
MB = $159.71
|
Most Recent Note - 8/3/2020 5:39:40 PM
G - Posted a 6th consecutive gain today with below average volume. Still very extended from any sound base. Its 50 DMA line ($174.49) defines near-term support to watch. DOCU is now priced +114% above its 200 DMA price, and it is taught in the Certification that a stock trading +70-100% or more above the 200 DMA is to be recognized as a "sell signal".
>>> FEATURED STOCK ARTICLE : E-Signature Firm is Extended From Any Sound Base - 7/28/2020 |
View all notes |
Set NEW NOTE alert |
Company Profile |
SEC
News |
Chart |
Request a new note
C
A
S
I |
Symbol/Exchange
Company Name
Industry Group |
PRICE |
CHANGE
(%Change) |
Day High |
Volume
(% DAV)
(% 50 day avg vol) |
52 Wk Hi
% From Hi |
Featured
Date |
Price
Featured |
Pivot Featured |
|
Max Buy |
PING
-
NYSE
Ping Identity Hldg Corp
Computer Sftwr-Security
|
$36.35
|
+0.34
0.94% |
$36.50
|
683,065
49.39% of 50 DAV
50 DAV is 1,383,000
|
$36.64
-0.79%
|
6/1/2020
|
$29.24
|
PP = $29.90
|
|
MB = $31.40
|
Most Recent Note - 8/3/2020 5:32:57 PM
G - Posted a solid gain today with light volume for another new all-time high. Its 50 DMA line ($31.51) and prior highs in the $29 area define important near-term support. It has not formed a sound base of sufficient length. Completed Secondary Offerings on 7/09/20 and 5/15/20.
>>> FEATURED STOCK ARTICLE : Consolidating Above 50-Day Moving Average Following Secondary - 7/16/2020 |
View all notes |
Set NEW NOTE alert |
Company Profile |
SEC
News |
Chart |
Request a new note
C
A
S
I |
ZEN
-
NYSE
Zendesk Inc
Computer Sftwr-Enterprse
|
$91.38
|
-0.93
-1.01% |
$93.33
|
3,087,744
138.28% of 50 DAV
50 DAV is 2,233,000
|
$101.94
-10.36%
|
7/21/2020
|
$94.29
|
PP = $94.97
|
|
MB = $99.72
|
Most Recent Note - 7/31/2020 1:20:38 PM
Y - Pulling back abruptly today with heavy volume. retreating from a new all-time high hit on the prior session as it challenged it "max buy" level. Weak action came after it reported Jun '20 quarterly earnings +180% on +27% sales revenues versus the year-ago period. Volume and volatility often increase near earnings news.
>>> FEATURED STOCK ARTICLE : Pullback Below Pivot Point Following Breakout Gain - 7/21/2020 |
View all notes |
Set NEW NOTE alert |
Company Profile |
SEC
News |
Chart |
Request a new note
C
A
S
I |
|
|
|
THESE ARE NOT BUY RECOMMENDATIONS!
Comments contained in the body of this report are technical
opinions only. The material herein has been obtained
from sources believed to be reliable and accurate, however,
its accuracy and completeness cannot be guaranteed.
This site is not an investment advisor, hence it does
not endorse or recommend any securities or other investments.
Any recommendation contained in this report may not
be suitable for all investors and it is not to be deemed
an offer or solicitation on our part with respect to
the purchase or sale of any securities. All trademarks,
service marks and trade names appearing in this report
are the property of their respective owners, and are
likewise used for identification purposes only.
This report is a service available
only to active Paid Premium Members.
You may opt-out of receiving report notifications
at any time. Questions or comments may be submitted
by writing to Premium Membership Services 665 S.E. 10 Street, Suite 201 Deerfield Beach, FL 33441-5634 or by calling 1-800-965-8307
or 954-785-1121.
|
|
|