You are not logged in.
This means you
CAN ONLY VIEW reports that were published prior to Monday, April 14, 2025.
You
MUST UPGRADE YOUR MEMBERSHIP if you want to see any current reports.
AFTER MARKET UPDATE - FRIDAY, AUGUST 6TH, 2010
Previous After Market Report Next After Market Report >>>
|
|
|
|
DOW |
-21.42 |
10,653.56 |
-0.20% |
|
Volume |
948,776,127 |
+8% |
|
Volume |
1,880,692,970 |
+8% |
|
NASDAQ |
-4.59 |
2,288.47 |
-0.20% |
|
Advancers |
1,384 |
44% |
|
Advancers |
1,058 |
39% |
|
S&P 500 |
-4.17 |
1,121.64 |
-0.37% |
|
Decliners |
1,604 |
52% |
|
Decliners |
1,530 |
56% |
|
Russell 2000 |
-4.39 |
650.68 |
-0.67% |
|
52 Wk Highs |
223 |
|
|
52 Wk Highs |
41 |
|
|
S&P 600 |
-2.49 |
347.43 |
-0.71% |
|
52 Wk Lows |
31 |
|
|
52 Wk Lows |
51 |
|
|
 |
Leadership Wanes While Rally Remains Intact
Adam Sarhan, Contributing Writer,
Stocks ended lower on Friday after the jobs report fell short of the Street's estimate. Volume totals were reported higher on the NYSE and on the Nasdaq exchanges versus the prior session. Decliners led advancers by almost a 8-to-7 ratio on the NYSE and by almost a 3-to-2 ratio on the Nasdaq exchange. New 52-week highs easily outnumbered new 52-week lows on the NYSE but trailed on the Nasdaq exchange. Leadership waned as only 13 high-ranked companies from the CANSLIM.net Leaders List made a new 52-week high and appeared on the CANSLIM.net BreakOuts Page, down from the 24 issues that appeared on the prior session.
Stocks enjoyed hefty gains on Monday after a series of stronger-than-expected manufacturing surveys in Europe and the US helped allay concern that the global recovery is in jeopardy. The Institute for Supply Management’s (ISM) manufacturing index slid to 55.5 in July from 56.2 a month earlier but topped estimates (54.5) and was above the critical boom/bust level of 50. Elsewhere, the Commerce Department said US construction spending unexpectedly grew +0.1% in June which also topped estimates (a decline of -0.5%). It was also encouraging to see the euro rally to a three month high against the greenback which helped lift a slew of dollar denominated assets (mainly, stocks and commodities). Stocks edged lower on Tuesday to consolidate Monday's strong move after a series of lackluster economic and earnings data was released. The National Association of Realtors said pending home resales in the US unexpectedly fell -2.6% from the prior month. The report fell short of the Street's estimates for a gain of +4%. Meanwhile, a separate report showed that factory orders slid -1.2% in June, which doubled the decline analysts' expected. Finally, the Commerce Department said consumer spending was unchanged after a +0.1% gain in the prior month. The report also showed that US incomes did not increase for the first time since September 2009 while the savings rate jumped to the highest level in a year.
Stocks edged higher on Wednesday after two favorable economic reports were released. The ADP private employment report showed private employers added more jobs than expected last month while the ISM's service index topped estimates. Stocks closed modestly lower on Thursday after weekly jobless claims unexpectedly jumped. Stocks closed lower on Friday after the Labor Department said July's payrolls slid by a larger than expected -131,000 while the unemployment rate held steady at +9.5%.
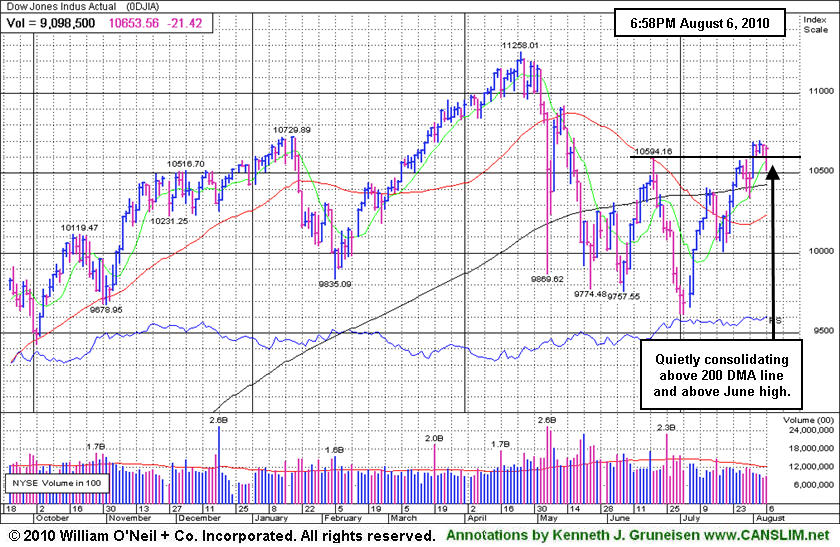
The Dow Jones Industrial Average and the NYSE Composite Index have traded above resistance at their long term 200-day moving average (DMA) lines and recent chart highs. The tech-heavy Nasdaq Composite, benchmark S&P 500, and small-cap Russell 2000 indexes still remain slightly below their recent chart highs. However, the fact that all of the major averages are trading above their respective 2-month downward trendlines bodes well for this five week rally. In order for a new leg higher to begin, all the major averages must close and remain above their respective resistance levels. Remember that the window remains open for for high-ranked stocks to be accumulated when they trigger fresh technical buy signals. Trade accordingly.
Are you Capitalizing On The Current Rally?
Our skilled team of portfolio managers knows how to follow the rules of this fact-based investment system. We do not follow opinion or the "conviction list" of some large Wall Street institution which would have us fully invested even during horrific bear markets. Instead, we remain fluid and only buy the best stocks when they are triggering proper technical buy signals. If you are not completely satisfied with the way your portfolio is being managed, Click here to submit your inquiry. *Accounts over $250,000 please. ** Serious inquires only.
PICTURED: The Dow Jones Industrial Average is quietly consolidating above its 200 DMA and above its June high.
|
|
|
 |
Tech Sector Consolidating With No Directional Bias
Kenneth J. Gruneisen - Passed the CAN SLIM® Master's Exam
Modest losses for the Retail Index ($RLX -0.51%) and the influential Broker/Dealer Index ($XBD -0.49%) and Bank Index ($BKX -1.40%) created a drag on the major market averages. While the Gold & Silver Index ($XAU +0.97%) posted a gain, energy-related shares sank and the Oil Services Index ($OSX -1.17%) and Integrated Oil Index ($XOI -0.86%) ended with losses. The Healthcare Index ($HMO +0.94%) and Biotechnology Index ($BTK +0.54%) perked up, but overall the tech sector was mixed and rather indecisive as the Networking Index ($NWX -0.30%) and Internet Index ($IIX +0.28%) finished with little change on the day.
Charts courtesy www.stockcharts.com
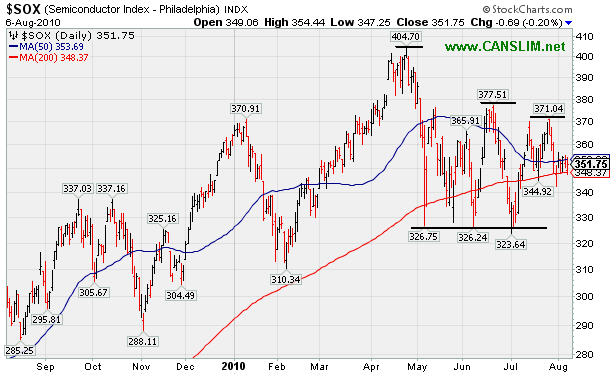
PICTURED: The Semiconductor Index ($SOX -0.20%) has recently been confined to trading in a tight range near its 50-day and 200-day moving average (DMA) lines. Its 50 DMA has stayed well above its 200 DMA line, which is a somewhat encouraging sign for the tech sector. Recent chat lows define a support level while its series of lower highs continues.
| Oil Services |
$OSX |
188.25 |
-2.23 |
-1.17% |
-3.42% |
| Healthcare |
$HMO |
1,559.61 |
+14.48 |
+0.94% |
+5.88% |
| Integrated Oil |
$XOI |
1,020.38 |
-8.82 |
-0.86% |
-4.48% |
| Semiconductor |
$SOX |
351.75 |
-0.69 |
-0.20% |
-2.27% |
| Networking |
$NWX |
244.01 |
-0.74 |
-0.30% |
+5.60% |
| Internet |
$IIX |
252.15 |
+0.71 |
+0.28% |
+7.82% |
| Broker/Dealer |
$XBD |
109.95 |
-0.54 |
-0.49% |
-4.44% |
| Retail |
$RLX |
414.69 |
-2.11 |
-0.51% |
+0.87% |
| Gold & Silver |
$XAU |
175.49 |
+1.69 |
+0.97% |
+4.30% |
| Bank |
$BKX |
48.43 |
-0.69 |
-1.40% |
+13.39% |
| Biotech |
$BTK |
1,116.86 |
+5.95 |
+0.54% |
+18.55% |
|
|
|
 |
Volume Pattern Has Not Been Indicative Of Great Accumulation
Kenneth J. Gruneisen - Passed the CAN SLIM® Master's Exam
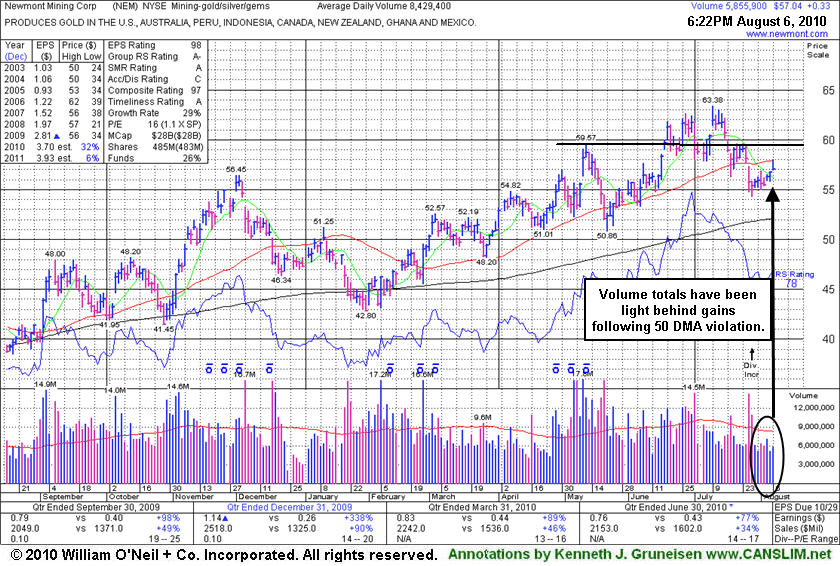
Newmont Mining Corporation's (NEM +$0.33 or +0.58% to $57.04) volume totals have been light while it has rebounded near its 50-day moving average (DMA) line. That important short-term average may now act as resistance after a damaging gap down on 7/27/10. A rebound above its 50 DMA line would help its outlook improve. When last shown in this FSU section on 7/09/10 under the headline "Gap Up Gain Quietly Helped Leader Hit All-Time High" it had recently marked new high closes and briefly topped its January 2006 all-time high ($62.72), however volume behind gains was below the minimum guidelines since its mid-May breakout faltered.
In a 6/22/10 Stock Bulletin (read here) members were told - "Look for an opportunity to properly pyramid buying efforts with chasing the stock more than 5% above its Pivot Point or 'Max Buy' level." Confirming gains on heavy volume in the coming days and weeks might come after it is too extended from an ideal buy point. Buyable breakouts require that the stock rise above its pivot point with considerable gains and those gains must be backed by a minimum of at least +40%-50% above average volume, ideally much more. Pyramiding into a position may be the most prudent way to let the market action dictate investors' entries. As always, it is of the utmost importance to sell a stock if it drops 7-8% below your purchase price.
The America-based mining firm had reassuring leadership (L criteria) from other Mining - Gold/Silver/Gems industry firms as a favorable backdrop. Many other gold mining interests are headquartered overseas which increases their potential pitfalls due to geopolitical shifts. The C and A criteria are satisfied as the company has demonstrated solid quarterly sales revenues and earnings increases (above the +25% minimum guideline) in recent comparisons and it has a good annual earnings history.
|
|
|
Color Codes Explained :
Y - Better candidates highlighted by our
staff of experts.
G - Previously featured
in past reports as yellow but may no longer be buyable under the
guidelines.
***Last / Change / Volume data in this table is the closing quote data***
Symbol/Exchange
Company Name
Industry Group |
PRICE |
CHANGE
(%Change) |
Day High |
Volume
(% DAV)
(% 50 day avg vol) |
52 Wk Hi
% From Hi |
Featured
Date |
Price
Featured |
Pivot Featured |
|
Max Buy |
AAPL
-
NASDAQ
Apple Inc
COMPUTER HARDWARE - Personal Computers
|
$260.09
|
-1.61
-0.61% |
$261.49
|
15,880,097
59.60% of 50 DAV
50 DAV is 26,646,500
|
$279.01
-6.78%
|
6/17/2010
|
$270.95
|
PP = $272.56
|
|
MB = $286.19
|
 Most Recent Note - 8/6/2010 5:46:29 PM
Y - Still quietly consolidating in a tight range just above its 50 DMA line. It has been 7 weeks since its negative reversal on 6/21/10 at its all-time high. Recent chart low ($239) defines an important support level.
>>> The latest Featured Stock Update with an annotated graph appeared on 7/12/2010. Click here.
View all notes |
Alert me of new notes |
CANSLIM.net Company Profile |
SEC |
Zacks Reports |
StockTalk |
News |
Chart |
Request a new note
C
A N
S L
I M


|
ABV
-
NYSE
Comp De Bebidas Adr
FOOD and BEVERAGE - Beverages - Brewers
|
$105.87
|
-1.89
-1.75% |
$106.83
|
654,496
90.40% of 50 DAV
50 DAV is 724,000
|
$112.60
-5.98%
|
6/29/2010
|
$104.74
|
PP = $109.33
|
|
MB = $114.80
|
Most Recent Note - 8/6/2010 5:48:59 PM
Y - This Brazil-based beverage firm slumped near its 50 DMA line today and churned a lot of volume this week without making progress above prior chart highs.
>>> The latest Featured Stock Update with an annotated graph appeared on 7/20/2010. Click here.
View all notes |
Alert me of new notes |
CANSLIM.net Company Profile |
SEC |
Zacks Reports |
StockTalk |
News |
Chart |
Request a new note
C
A N
S L
I M
|
BIDU
-
NASDAQ
Baidu Inc Ads
INTERNET - Internet Information Providers
|
$86.53
|
+0.96
1.12% |
$86.60
|
8,692,170
72.58% of 50 DAV
50 DAV is 11,976,200
|
$86.91
-0.44%
|
7/14/2010
|
$75.03
|
PP = $78.59
|
|
MB = $82.52
|
Most Recent Note - 8/6/2010 5:53:34 PM
G - Extended from prior chart highs, stubbornly holding its ground at its all-time high, and no overhead supply remains to act as resistance. Steadily rose above prior highs in the $78 area and further without great volume conviction.
>>> The latest Featured Stock Update with an annotated graph appeared on 7/14/2010. Click here.
View all notes |
Alert me of new notes |
CANSLIM.net Company Profile |
SEC |
Zacks Reports |
StockTalk |
News |
Chart |
Request a new note
C
A N
S L
I M
|
CACC
-
NASDAQ
Credit Acceptance Corp
FINANCIAL SERVICES - Credit Services
|
$58.00
|
+1.95
3.48% |
$58.00
|
60,280
124.03% of 50 DAV
50 DAV is 48,600
|
$58.72
-1.23%
|
7/29/2010
|
$52.04
|
PP = $54.07
|
|
MB = $56.77
|
Most Recent Note - 8/6/2010 5:57:23 PM
G - Gain today helped it close above its "max buy" level again. Prior highs in the $54 area define initial chart support to watch. Recently reported +38% earnings on +21% sales revenues for the quarter ended June 30, 2010.
>>> The latest Featured Stock Update with an annotated graph appeared on 8/2/2010. Click here.
View all notes |
Alert me of new notes |
CANSLIM.net Company Profile |
SEC |
Zacks Reports |
StockTalk |
News |
Chart |
Request a new note
C
A N
S L
I M
|
CRM
-
NYSE
Salesforce.Com Inc
INTERNET - Internet Software and Services
|
$102.33
|
-0.36
-0.35% |
$102.42
|
1,374,808
53.92% of 50 DAV
50 DAV is 2,549,500
|
$103.77
-1.39%
|
6/2/2010
|
$88.44
|
PP = $89.60
|
|
MB = $94.08
|
Most Recent Note - 8/6/2010 6:01:21 PM
G - Quietly perched at its all-time high trading very light volume, showing no reaction to news late this week that it settled a patent infringement suit brought by Microsoft Corp. Prior highs near $97 define near-term support to watch above its 50 DMA line.
>>> The latest Featured Stock Update with an annotated graph appeared on 7/15/2010. Click here.
View all notes |
Alert me of new notes |
CANSLIM.net Company Profile |
SEC |
Zacks Reports |
StockTalk |
News |
Chart |
Request a new note
C
A N
S L
I M
|
Symbol/Exchange
Company Name
Industry Group |
PRICE |
CHANGE
(%Change) |
Day High |
Volume
(% DAV)
(% 50 day avg vol) |
52 Wk Hi
% From Hi |
Featured
Date |
Price
Featured |
Pivot Featured |
|
Max Buy |
DTSI
-
NASDAQ
D T S Inc
CONSUMER DURABLES - Electronic Equipment
|
$36.57
|
-0.26
-0.71% |
$36.68
|
58,905
58.09% of 50 DAV
50 DAV is 101,400
|
$37.60
-2.74%
|
7/27/2010
|
$37.00
|
PP = $36.28
|
|
MB = $38.09
|
Most Recent Note - 8/6/2010 6:05:06 PM
Y - It has stalled after recently clearing stubborn resistance in the $36 area. The high-ranked Consumer Products - Electronic firm will report earnings after the close on Monday, August 9th. Street estimates calling for lower FY '10 earnings have been noted as a concern. Prior highs in the $35-36 area define support above its 50 DMA line.
>>> The latest Featured Stock Update with an annotated graph appeared on 7/27/2010. Click here.
View all notes |
Alert me of new notes |
CANSLIM.net Company Profile |
SEC |
Zacks Reports |
StockTalk |
News |
Chart |
Request a new note
C
A N
S L
I M
|
FFIV
-
NASDAQ
F 5 Networks Inc
INTERNET - Internet Software and Services
|
$88.48
|
-0.47
-0.53% |
$89.50
|
1,262,395
69.79% of 50 DAV
50 DAV is 1,808,900
|
$90.83
-2.59%
|
6/16/2010
|
$74.50
|
PP = $74.10
|
|
MB = $77.81
|
Most Recent Note - 8/6/2010 6:07:45 PM
G - Quietly holding its ground near all-time highs. It has been repeatedly noted as -"extended from any sound base after recent volume-driven gains, it could go on to produce more climactic gains."
>>> The latest Featured Stock Update with an annotated graph appeared on 8/4/2010. Click here.
View all notes |
Alert me of new notes |
CANSLIM.net Company Profile |
SEC |
Zacks Reports |
StockTalk |
News |
Chart |
Request a new note
C
A N
S L
I M
|
MELI
-
NASDAQ
Mercadolibre Inc
INTERNET - Internet Software and; Services
|
$65.83
|
+1.86
2.91% |
$67.20
|
2,230,496
233.85% of 50 DAV
50 DAV is 953,800
|
$65.99
-0.24%
|
5/13/2010
|
$54.21
|
PP = $55.85
|
|
MB = $58.64
|
Most Recent Note - 8/6/2010 6:11:45 PM
G - With a 2nd consecutive gain today backed by heavy volume in a 4 session streak of gains it hit a new 52-week high. Extended from any sound base. Its recent lows and 50 DMA line in the $58 area define important chart support.
>>> The latest Featured Stock Update with an annotated graph appeared on 7/23/2010. Click here.
View all notes |
Alert me of new notes |
CANSLIM.net Company Profile |
SEC |
Zacks Reports |
StockTalk |
News |
Chart |
Request a new note
C
A N
S L
I M
|
MWIV
-
NASDAQ
M W I Veterinary Supply
HEALTH SERVICES - Medical Instruments and; Supplies
|
$53.25
|
+0.58
1.10% |
$53.76
|
234,915
334.16% of 50 DAV
50 DAV is 70,300
|
$54.48
-2.26%
|
7/29/2010
|
$52.05
|
PP = $52.09
|
|
MB = $54.69
|
Most Recent Note - 8/6/2010 6:12:50 PM
Y - It has endured recent distributional pressure and did not make meaningful price progress while trading above average volume today. The "churning" action has occurred while remaining confined to a tight range near all-time highs.
>>> The latest Featured Stock Update with an annotated graph appeared on 7/30/2010. Click here.
View all notes |
Alert me of new notes |
CANSLIM.net Company Profile |
SEC |
Zacks Reports |
StockTalk |
News |
Chart |
Request a new note
C
A N
S L
I M
|
NEM
-
NYSE
Newmont Mining Corp
METALS and MINING - Gold
|
$57.04
|
+0.33
0.58% |
$58.00
|
5,916,853
68.97% of 50 DAV
50 DAV is 8,578,600
|
$63.38
-10.00%
|
6/22/2010
|
$59.60
|
PP = $59.67
|
|
MB = $62.65
|
Most Recent Note - 8/6/2010 6:16:23 PM
G - Technically volume totals have been light while it has rebounded near its 50 DMA line which may act as resistance after a damaging gap down on 7/27/10.
>>> The latest Featured Stock Update with an annotated graph appeared on 8/6/2010. Click here.
View all notes |
Alert me of new notes |
CANSLIM.net Company Profile |
SEC |
Zacks Reports |
StockTalk |
News |
Chart |
Request a new note
C
A N
S L
I M
|
Symbol/Exchange
Company Name
Industry Group |
PRICE |
CHANGE
(%Change) |
Day High |
Volume
(% DAV)
(% 50 day avg vol) |
52 Wk Hi
% From Hi |
Featured
Date |
Price
Featured |
Pivot Featured |
|
Max Buy |
NEOG
-
NASDAQ
Neogen Corp
DRUGS - Diagnostic Substances
|
$28.60
|
-0.50
-1.72% |
$29.01
|
91,118
96.22% of 50 DAV
50 DAV is 94,700
|
$30.39
-5.89%
|
7/22/2010
|
$27.19
|
PP = $27.87
|
|
MB = $29.26
|
Most Recent Note - 8/6/2010 6:47:40 PM
Y - Loss today on average volume, consolidating in a healthy fashion above prior highs in the $27 area defining near-term chart support to watch.
>>> The latest Featured Stock Update with an annotated graph appeared on 7/22/2010. Click here.
View all notes |
Alert me of new notes |
CANSLIM.net Company Profile |
SEC |
Zacks Reports |
StockTalk |
News |
Chart |
Request a new note
C
A N
S L
I M
|
NETL
-
NASDAQ
Netlogic Microsystems
ELECTRONICS - Semiconductor - Memory Chips
|
$29.17
|
-0.14
-0.48% |
$29.56
|
743,449
55.60% of 50 DAV
50 DAV is 1,337,200
|
$35.00
-16.66%
|
7/28/2010
|
$33.44
|
PP = $35.10
|
|
MB = $36.86
|
Most Recent Note - 8/6/2010 6:49:10 PM
G - Loss on quiet volume today led to a close just below its 50 DMA line. It did not trigger a technical buy signal after it was featured in the 7/28/10 mid-day report. While consolidating, its 7/30/10 low ($28.27) now defines the only support above its 200 DMA and earlier chart lows.
>>> The latest Featured Stock Update with an annotated graph appeared on 7/28/2010. Click here.
View all notes |
Alert me of new notes |
CANSLIM.net Company Profile |
SEC |
Zacks Reports |
StockTalk |
News |
Chart |
Request a new note
C
A N
S L
I M
|
ROVI
-
NASDAQ
Rovi Corp
COMPUTER SOFTWARE andamp; SERVICES - Security Software andamp; Services
|
$44.00
|
+0.23
0.53% |
$44.25
|
1,423,312
114.10% of 50 DAV
50 DAV is 1,247,400
|
$44.96
-2.14%
|
6/3/2010
|
$38.70
|
PP = $40.16
|
|
MB = $42.17
|
Most Recent Note - 8/6/2010 6:51:52 PM
G - Hovering near its 52-week high, extended from prior highs in the $40 area and its 50 DMA line which define chart support.
>>> The latest Featured Stock Update with an annotated graph appeared on 7/21/2010. Click here.
View all notes |
Alert me of new notes |
CANSLIM.net Company Profile |
SEC |
Zacks Reports |
StockTalk |
News |
Chart |
Request a new note
C
A N
S L
I M
|
SHOO
-
NASDAQ
Steven Madden Limited
CONSUMER NON-DURABLES - Textile - Apparel Footwear
|
$39.57
|
-0.04
-0.10% |
$39.99
|
663,314
183.34% of 50 DAV
50 DAV is 361,800
|
$40.98
-3.44%
|
8/5/2010
|
$39.55
|
PP = $41.08
|
|
MB = $43.13
|
Most Recent Note - 8/6/2010 1:07:54 PM
Y - Perched near its all-time high and still working on the right side of a 15-week cup shaped base without a handle. A proper "handle" forms over a minimum of 1 week and includes a pullback in the 10-12% range. Color code was changed to yellow with pivot point cited based on its 52-week high plus ten cents when featured in the 8/05/10 mid-day report (read here). As noted 7/30/10 - "It has the look of a big base-on-base type pattern now with prior resistance near $40. Recent quarters showed accelerating sales revenues and earnings increases since last noted in the 4/30/10 mid-day report. The high-ranked Apparel firm's quarterly earnings increases have been well above the +25% guideline, satisfying the C criteria. Its annual earnings history (A criteria) since FY '07 has been good."
>>> The latest Featured Stock Update with an annotated graph appeared on 8/5/2010. Click here.
View all notes |
Alert me of new notes |
CANSLIM.net Company Profile |
SEC |
Zacks Reports |
StockTalk |
News |
Chart |
Request a new note
C
A N
S L
I M
|
ULTA
-
NASDAQ
Ulta Salon Cosm & Frag
SPECIALTY RETAIL - Specialty Retail, Other
|
$24.79
|
-0.10
-0.40% |
$24.88
|
482,321
66.39% of 50 DAV
50 DAV is 726,500
|
$26.75
-7.33%
|
8/4/2010
|
$24.90
|
PP = $26.85
|
|
MB = $28.19
|
Most Recent Note - 8/6/2010 6:53:57 PM
Y - Closed near the session high today after an intra-day slump under its 50 DMA line raised concerns. Color code is changed to yellow again. It would need to rally above the new pivot point cited with volume conviction to trigger a proper technical buy signal.
>>> The latest Featured Stock Update with an annotated graph appeared on 7/19/2010. Click here.
View all notes |
Alert me of new notes |
CANSLIM.net Company Profile |
SEC |
Zacks Reports |
StockTalk |
News |
Chart |
Request a new note
C
A N
S L
I M
|
Symbol/Exchange
Company Name
Industry Group |
PRICE |
CHANGE
(%Change) |
Day High |
Volume
(% DAV)
(% 50 day avg vol) |
52 Wk Hi
% From Hi |
Featured
Date |
Price
Featured |
Pivot Featured |
|
Max Buy |
VIT
-
NYSE
Vanceinfo Tech Inc Ads
COMPUTER SOFTWARE and SERVICES - Business Software and Services
|
$27.53
|
+0.05
0.18% |
$27.84
|
234,204
44.42% of 50 DAV
50 DAV is 527,300
|
$27.59
-0.22%
|
7/8/2010
|
$25.20
|
PP = $26.58
|
|
MB = $27.91
|
Most Recent Note - 8/6/2010 6:57:24 PM
Y - Wedged up for a new all-time high today with very light volume. It has not triggered a confirming buy signal with volume yet since featured in the 7/08/10 mid-day report. Its 7/29/10 low ($24.55) defines initial support above its 50 DMA line.
>>> The latest Featured Stock Update with an annotated graph appeared on 7/26/2010. Click here.
View all notes |
Alert me of new notes |
CANSLIM.net Company Profile |
SEC |
Zacks Reports |
StockTalk |
News |
Chart |
Request a new note
C
A N
S L
I M
|
|
|
|
THESE ARE NOT BUY RECOMMENDATIONS!
Comments contained in the body of this report are technical
opinions only. The material herein has been obtained
from sources believed to be reliable and accurate, however,
its accuracy and completeness cannot be guaranteed.
This site is not an investment advisor, hence it does
not endorse or recommend any securities or other investments.
Any recommendation contained in this report may not
be suitable for all investors and it is not to be deemed
an offer or solicitation on our part with respect to
the purchase or sale of any securities. All trademarks,
service marks and trade names appearing in this report
are the property of their respective owners, and are
likewise used for identification purposes only.
This report is a service available
only to active Paid Premium Members.
You may opt-out of receiving report notifications
at any time. Questions or comments may be submitted
by writing to Premium Membership Services 665 S.E. 10 Street, Suite 201 Deerfield Beach, FL 33441-5634 or by calling 1-800-965-8307
or 954-785-1121.
|
|
|


