***Last / Change / Volume data in this table is the closing quote data***
Symbol/Exchange
Company Name
Industry Group |
PRICE |
CHANGE
(%Change) |
Day High |
Volume
(% DAV)
(% 50 day avg vol) |
52 Wk Hi
% From Hi |
Featured
Date |
Price
Featured |
Pivot Featured |
|
Max Buy |
AAPL
-
NASDAQ
Apple Inc
COMPUTER HARDWARE - Personal Computers
|
$261.70
|
-1.28
-0.49% |
$263.15
|
10,324,749
38.75% of 50 DAV
50 DAV is 26,646,500
|
$279.01
-6.20%
|
6/17/2010
|
$270.95
|
PP = $272.56
|
|
MB = $286.19
|
Most Recent Note - 8/4/2010 5:26:38 PM
Y - Still quietly consolidating in a tight range above its 50 DMA line, it has been 7 weeks since its negative reversal on 6/21/10 at its all-time high. Recent chart low ($239) defines an important support level.
>>> The latest Featured Stock Update with an annotated graph appeared on 7/12/2010. Click here.
View all notes |
Alert me of new notes |
CANSLIM.net Company Profile |
SEC |
Zacks Reports |
StockTalk |
News |
Chart |
Request a new note
C
A N
S L
I M


|
ABV
-
NYSE
Comp De Bebidas Adr
FOOD and BEVERAGE - Beverages - Brewers
|
$107.76
|
-0.81
-0.75% |
$108.49
|
440,700
60.87% of 50 DAV
50 DAV is 724,000
|
$112.60
-4.30%
|
6/29/2010
|
$104.74
|
PP = $109.33
|
|
MB = $114.80
|
Most Recent Note - 8/4/2010 5:31:16 PM
Y - This Brazil-based beverage firm churned a lot of volume this week without making great price progress above prior chart highs.
>>> The latest Featured Stock Update with an annotated graph appeared on 7/20/2010. Click here.
View all notes |
Alert me of new notes |
CANSLIM.net Company Profile |
SEC |
Zacks Reports |
StockTalk |
News |
Chart |
Request a new note
C
A N
S L
I M
|
BIDU
-
NASDAQ
Baidu Inc Ads
INTERNET - Internet Information Providers
|
$85.57
|
-1.03
-1.19% |
$86.46
|
8,036,352
67.10% of 50 DAV
50 DAV is 11,976,200
|
$86.91
-1.54%
|
7/14/2010
|
$75.03
|
PP = $78.59
|
|
MB = $82.52
|
Most Recent Note - 8/4/2010 5:37:03 PM
G - Gain today for a new all-time high above its "max buy" level. Steadily rose above prior highs in the $78 area and upward without great volume conviction. Color code is changed to green as it gets extended from prior chart highs. No overhead supply remains to act as resistance.
>>> The latest Featured Stock Update with an annotated graph appeared on 7/14/2010. Click here.
View all notes |
Alert me of new notes |
CANSLIM.net Company Profile |
SEC |
Zacks Reports |
StockTalk |
News |
Chart |
Request a new note
C
A N
S L
I M
|
CACC
-
NASDAQ
Credit Acceptance Corp
FINANCIAL SERVICES - Credit Services
|
$56.05
|
-2.52
-4.30% |
$57.13
|
75,011
154.34% of 50 DAV
50 DAV is 48,600
|
$58.72
-4.55%
|
7/29/2010
|
$52.04
|
PP = $54.07
|
|
MB = $56.77
|
 Most Recent Note - 8/5/2010 12:09:34 PM
Y - Gapped down today after a strong finish at a new all-time high. Now trading near below its "max buy" level, its color code is changed to yellow. Prior highs in the $54 area define initial chart support to watch. Recently reported +38% earnings on +21% sales revenues for the quarter ended June 30, 2010.
>>> The latest Featured Stock Update with an annotated graph appeared on 8/2/2010. Click here.
View all notes |
Alert me of new notes |
CANSLIM.net Company Profile |
SEC |
Zacks Reports |
StockTalk |
News |
Chart |
Request a new note
C
A N
S L
I M
|
CRM
-
NYSE
Salesforce.Com Inc
INTERNET - Internet Software and Services
|
$102.69
|
-0.87
-0.84% |
$103.46
|
1,160,529
45.52% of 50 DAV
50 DAV is 2,549,500
|
$103.77
-1.04%
|
6/2/2010
|
$88.44
|
PP = $89.60
|
|
MB = $94.08
|
Most Recent Note - 8/5/2010 4:44:39 PM
G - Edged lower on light volume today, showing no reaction to news that it settled a patent infringement suit brought by Microsoft Corp. Perched at its 52-week high, prior highs near $97 define near-term support to watch above its 50 DMA line.
>>> The latest Featured Stock Update with an annotated graph appeared on 7/15/2010. Click here.
View all notes |
Alert me of new notes |
CANSLIM.net Company Profile |
SEC |
Zacks Reports |
StockTalk |
News |
Chart |
Request a new note
C
A N
S L
I M
|
Symbol/Exchange
Company Name
Industry Group |
PRICE |
CHANGE
(%Change) |
Day High |
Volume
(% DAV)
(% 50 day avg vol) |
52 Wk Hi
% From Hi |
Featured
Date |
Price
Featured |
Pivot Featured |
|
Max Buy |
DTSI
-
NASDAQ
D T S Inc
CONSUMER DURABLES - Electronic Equipment
|
$36.83
|
-0.34
-0.91% |
$37.23
|
34,099
33.63% of 50 DAV
50 DAV is 101,400
|
$37.60
-2.05%
|
7/27/2010
|
$37.00
|
PP = $36.28
|
|
MB = $38.09
|
Most Recent Note - 8/4/2010 5:55:05 PM
Y - Quietly edged higher today and ended 6 cents off its best ever close after a considerable gain on 8/03/10 with above average volume. It will report earnings after the close on Monday, August 9th, and Street estimates calling for lower FY '10 earnings have been noted as a concern. Prior highs in the $35-36 area define support above its 50 DMA line.
>>> The latest Featured Stock Update with an annotated graph appeared on 7/27/2010. Click here.
View all notes |
Alert me of new notes |
CANSLIM.net Company Profile |
SEC |
Zacks Reports |
StockTalk |
News |
Chart |
Request a new note
C
A N
S L
I M
|
FFIV
-
NASDAQ
F 5 Networks Inc
INTERNET - Internet Software and Services
|
$88.95
|
-0.87
-0.97% |
$90.83
|
1,125,439
62.22% of 50 DAV
50 DAV is 1,808,900
|
$90.25
-1.44%
|
6/16/2010
|
$74.50
|
PP = $74.10
|
|
MB = $77.81
|
Most Recent Note - 8/4/2010 6:00:48 PM
G - New high close after a gain today with light volume. Extended from any sound base after recent volume-driven gains, it could go on to produce more climactic gains.
>>> The latest Featured Stock Update with an annotated graph appeared on 8/4/2010. Click here.
View all notes |
Alert me of new notes |
CANSLIM.net Company Profile |
SEC |
Zacks Reports |
StockTalk |
News |
Chart |
Request a new note
C
A N
S L
I M
|
MELI
-
NASDAQ
Mercadolibre Inc
INTERNET - Internet Software and; Services
|
$63.97
|
+1.29
2.06% |
$64.60
|
2,430,353
254.81% of 50 DAV
50 DAV is 953,800
|
$65.99
-3.06%
|
5/13/2010
|
$54.21
|
PP = $55.85
|
|
MB = $58.64
|
Most Recent Note - 8/5/2010 10:03:16 AM
G - It is up from early lows below its "max buy" level after a gap down today following its report showing earnings +125% on sales revenues +28% for the quarter ended June 30, 2010. Support to watch is at its 50 DMA line (now $57.36).
>>> The latest Featured Stock Update with an annotated graph appeared on 7/23/2010. Click here.
View all notes |
Alert me of new notes |
CANSLIM.net Company Profile |
SEC |
Zacks Reports |
StockTalk |
News |
Chart |
Request a new note
C
A N
S L
I M
|
MWIV
-
NASDAQ
M W I Veterinary Supply
HEALTH SERVICES - Medical Instruments and; Supplies
|
$52.67
|
-0.65
-1.22% |
$53.82
|
53,669
76.34% of 50 DAV
50 DAV is 70,300
|
$54.48
-3.32%
|
7/29/2010
|
$52.05
|
PP = $52.09
|
|
MB = $54.69
|
Most Recent Note - 8/4/2010 6:06:47 PM
Y - Holding its ground in a tight range near all-time highs since it rallied above its pivot point and finished strong after featured in the 7/29/10 mid-day report (read here).
>>> The latest Featured Stock Update with an annotated graph appeared on 7/30/2010. Click here.
View all notes |
Alert me of new notes |
CANSLIM.net Company Profile |
SEC |
Zacks Reports |
StockTalk |
News |
Chart |
Request a new note
C
A N
S L
I M
|
NEM
-
NYSE
Newmont Mining Corp
METALS and MINING - Gold
|
$56.71
|
+0.46
0.82% |
$56.74
|
5,252,208
61.22% of 50 DAV
50 DAV is 8,578,600
|
$63.38
-10.52%
|
6/22/2010
|
$59.60
|
PP = $59.67
|
|
MB = $62.65
|
Most Recent Note - 8/4/2010 6:09:10 PM
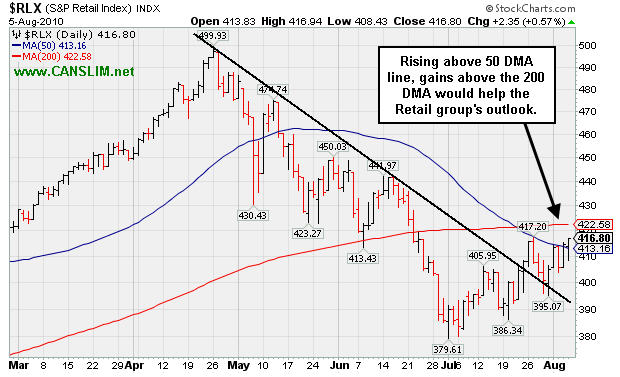
G - Halted its slide and held its ground in a tight range since its damaging gap down on 7/27/10. Technically, a rebound above its 50 DMA line would help its outlook improve.
>>> The latest Featured Stock Update with an annotated graph appeared on 7/9/2010. Click here.
View all notes |
Alert me of new notes |
CANSLIM.net Company Profile |
SEC |
Zacks Reports |
StockTalk |
News |
Chart |
Request a new note
C
A N
S L
I M
|
Symbol/Exchange
Company Name
Industry Group |
PRICE |
CHANGE
(%Change) |
Day High |
Volume
(% DAV)
(% 50 day avg vol) |
52 Wk Hi
% From Hi |
Featured
Date |
Price
Featured |
Pivot Featured |
|
Max Buy |
NEOG
-
NASDAQ
Neogen Corp
DRUGS - Diagnostic Substances
|
$29.10
|
-0.81
-2.71% |
$29.73
|
42,142
44.50% of 50 DAV
50 DAV is 94,700
|
$30.39
-4.24%
|
7/22/2010
|
$27.19
|
PP = $27.87
|
|
MB = $29.26
|
Most Recent Note - 8/5/2010 4:38:43 PM
Y - Today's loss on light volume led to a close at its session low just under its "max buy" level. Color code is changed to yellow while consolidating above prior highs in the $27 area defining near-term chart support to watch.
>>> The latest Featured Stock Update with an annotated graph appeared on 7/22/2010. Click here.
View all notes |
Alert me of new notes |
CANSLIM.net Company Profile |
SEC |
Zacks Reports |
StockTalk |
News |
Chart |
Request a new note
C
A N
S L
I M
|
NETL
-
NASDAQ
Netlogic Microsystems
ELECTRONICS - Semiconductor - Memory Chips
|
$29.31
|
-0.42
-1.41% |
$30.08
|
743,848
55.63% of 50 DAV
50 DAV is 1,337,200
|
$35.00
-16.26%
|
7/28/2010
|
$33.44
|
PP = $35.10
|
|
MB = $36.86
|
Most Recent Note - 8/4/2010 6:32:57 PM
G - Halted its slide and trading in a tight range above its 50 DMA line since its damaging 7/29/10 loss. It did not trigger a technical buy signal after it was featured in the 7/28/10 mid-day report. While consolidating, its 7/30/10 low ($28.27) now defines the only support above its 200 DMA and earlier chart lows.
>>> The latest Featured Stock Update with an annotated graph appeared on 7/28/2010. Click here.
View all notes |
Alert me of new notes |
CANSLIM.net Company Profile |
SEC |
Zacks Reports |
StockTalk |
News |
Chart |
Request a new note
C
A N
S L
I M
|
ROVI
-
NASDAQ
Rovi Corp
COMPUTER SOFTWARE andamp; SERVICES - Security Software andamp; Services
|
$43.77
|
+0.26
0.60% |
$44.10
|
995,694
79.82% of 50 DAV
50 DAV is 1,247,400
|
$44.96
-2.65%
|
6/3/2010
|
$38.70
|
PP = $40.16
|
|
MB = $42.17
|
Most Recent Note - 8/4/2010 6:35:02 PM
G - Finished near its session high today with a solid gain. Support is defined by highs in the $40 area and its 50 DMA line.
>>> The latest Featured Stock Update with an annotated graph appeared on 7/21/2010. Click here.
View all notes |
Alert me of new notes |
CANSLIM.net Company Profile |
SEC |
Zacks Reports |
StockTalk |
News |
Chart |
Request a new note
C
A N
S L
I M
|
SHOO
-
NASDAQ
Steven Madden Limited
CONSUMER NON-DURABLES - Textile - Apparel Footwear
|
$39.61
|
+0.05
0.13% |
$39.85
|
2,666,359
736.97% of 50 DAV
50 DAV is 361,800
|
$40.98
-3.34%
|
8/5/2010
|
$39.55
|
PP = $41.08
|
|
MB = $43.13
|
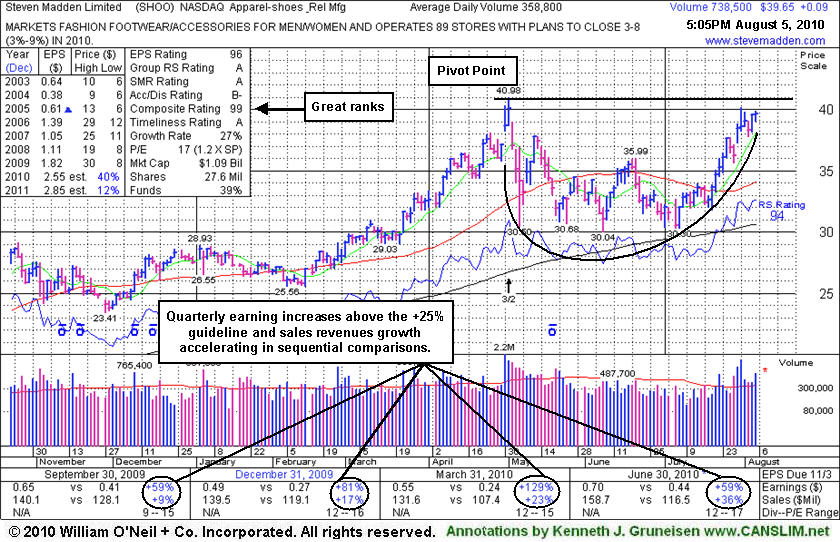
Most Recent Note - 8/5/2010 5:59:21 PM
Y - Closed -3.3% of its 5/03/10 all-time high today while working on the right side of a 15-week cup shaped base without a handle. A proper "handle" forms over a minimum of 1 week and includes a pullback in the 10-12% range. Color code was changed to yellow with pivot point cited based on its 52-week high plus ten cents when featured in the mid-day report (read here). As noted 7/30/10 - "It has the look of a big base-on-base type pattern now with prior resistance near $40. Recent quarters showed accelerating sales revenues and earnings increases since last noted in the 4/30/10 mid-day report. The high-ranked Apparel firm's quarterly earnings increases have been well above the +25% guideline, satisfying the C criteria. Its annual earnings history (A criteria) since FY '07 has been good."
>>> The latest Featured Stock Update with an annotated graph appeared on 8/5/2010. Click here.
View all notes |
Alert me of new notes |
CANSLIM.net Company Profile |
SEC |
Zacks Reports |
StockTalk |
News |
Chart |
Request a new note
C
A N
S L
I M
|
ULTA
-
NASDAQ
Ulta Salon Cosm & Frag
SPECIALTY RETAIL - Specialty Retail, Other
|
$24.89
|
-0.01
-0.04% |
$24.97
|
329,398
45.34% of 50 DAV
50 DAV is 726,500
|
$26.75
-6.95%
|
8/4/2010
|
$24.90
|
PP = $26.85
|
|
MB = $28.19
|
Most Recent Note - 8/4/2010 6:41:45 PM
Y - Working on a near 8-week cup shaped base and perched above its 50 DMA and -7% off its 52-week high, its color code is changed to yellow with new pivot point cited based on its 6/21/10 high plus ten cents.
>>> The latest Featured Stock Update with an annotated graph appeared on 7/19/2010. Click here.
View all notes |
Alert me of new notes |
CANSLIM.net Company Profile |
SEC |
Zacks Reports |
StockTalk |
News |
Chart |
Request a new note
C
A N
S L
I M
|
Symbol/Exchange
Company Name
Industry Group |
PRICE |
CHANGE
(%Change) |
Day High |
Volume
(% DAV)
(% 50 day avg vol) |
52 Wk Hi
% From Hi |
Featured
Date |
Price
Featured |
Pivot Featured |
|
Max Buy |
VIT
-
NYSE
Vanceinfo Tech Inc Ads
COMPUTER SOFTWARE and SERVICES - Business Software and Services
|
$27.48
|
+0.18
0.66% |
$27.57
|
204,409
38.77% of 50 DAV
50 DAV is 527,300
|
$27.59
-0.40%
|
7/8/2010
|
$25.20
|
PP = $26.58
|
|
MB = $27.91
|
Most Recent Note - 8/4/2010 7:39:58 PM
Y - Gain today on very light volume helped it finish 10 cents off its best ever close. It has not produced a gain with above average volume or triggered a buy signal yet since featured in the 7/08/10 mid-day report. Its 7/19/10 low ($23.78) defines near-term support above its 50 DMA line.
>>> The latest Featured Stock Update with an annotated graph appeared on 7/26/2010. Click here.
View all notes |
Alert me of new notes |
CANSLIM.net Company Profile |
SEC |
Zacks Reports |
StockTalk |
News |
Chart |
Request a new note
C
A N
S L
I M
|