***Last / Change / Volume data in this table is the closing quote data***
Symbol/Exchange
Company Name
Industry Group |
PRICE |
CHANGE
(%Change) |
Day High |
Volume
(% DAV)
(% 50 day avg vol) |
52 Wk Hi
% From Hi |
Featured
Date |
Price
Featured |
Pivot Featured |
|
Max Buy |
AAPL
-
NASDAQ
Apple Inc
COMPUTER HARDWARE - Personal Computers
|
$261.75
|
+1.66
0.64% |
$262.15
|
10,791,697
42.19% of 50 DAV
50 DAV is 25,576,500
|
$279.01
-6.19%
|
6/17/2010
|
$270.95
|
PP = $272.56
|
|
MB = $286.19
|
Most Recent Note - 8/6/2010 5:46:29 PM
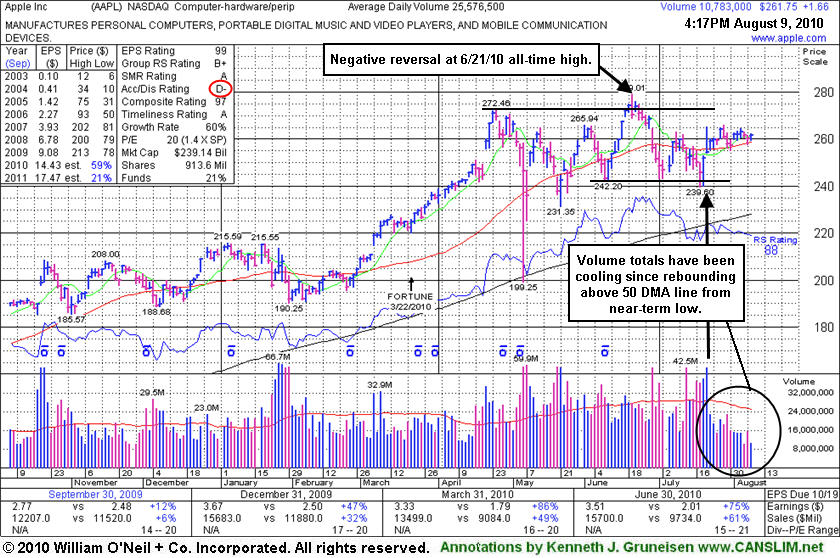
Y - Still quietly consolidating in a tight range just above its 50 DMA line. It has been 7 weeks since its negative reversal on 6/21/10 at its all-time high. Recent chart low ($239) defines an important support level.
>>> The latest Featured Stock Update with an annotated graph appeared on 8/9/2010. Click here.
View all notes |
Alert me of new notes |
CANSLIM.net Company Profile |
SEC |
Zacks Reports |
StockTalk |
News |
Chart |
Request a new note
C
A N
S L
I M


|
ABV
-
NYSE
Comp De Bebidas Adr
FOOD and BEVERAGE - Beverages - Brewers
|
$106.05
|
+0.18
0.17% |
$106.95
|
462,014
66.94% of 50 DAV
50 DAV is 690,200
|
$112.60
-5.82%
|
6/29/2010
|
$104.74
|
PP = $109.33
|
|
MB = $114.80
|
 Most Recent Note - 8/9/2010 4:36:24 PM
Y - This Brazil-based beverage firm is consolidating just above its 50 DMA line. It churned a lot of volume last week without making progress above prior chart highs.
>>> The latest Featured Stock Update with an annotated graph appeared on 7/20/2010. Click here.
View all notes |
Alert me of new notes |
CANSLIM.net Company Profile |
SEC |
Zacks Reports |
StockTalk |
News |
Chart |
Request a new note
C
A N
S L
I M
|
BIDU
-
NASDAQ
Baidu Inc Ads
INTERNET - Internet Information Providers
|
$87.56
|
+1.03
1.19% |
$88.00
|
8,782,242
74.65% of 50 DAV
50 DAV is 11,765,000
|
$86.91
0.75%
|
7/14/2010
|
$75.03
|
PP = $78.59
|
|
MB = $82.52
|
Most Recent Note - 8/9/2010 4:37:50 PM
G - Small gain today with light volume for a new all-time high. It is extended from a sound base, yet no overhead supply remains to act as resistance. Steadily rose above prior highs in the $78 area and further without great volume conviction.
>>> The latest Featured Stock Update with an annotated graph appeared on 7/14/2010. Click here.
View all notes |
Alert me of new notes |
CANSLIM.net Company Profile |
SEC |
Zacks Reports |
StockTalk |
News |
Chart |
Request a new note
C
A N
S L
I M
|
CACC
-
NASDAQ
Credit Acceptance Corp
FINANCIAL SERVICES - Credit Services
|
$59.75
|
+1.75
3.02% |
$59.75
|
56,781
110.04% of 50 DAV
50 DAV is 51,600
|
$58.72
1.75%
|
7/29/2010
|
$52.04
|
PP = $54.07
|
|
MB = $56.77
|
Most Recent Note - 8/9/2010 4:39:26 PM
G - Gain today on average volume for a new high. Prior highs in the $54 area define initial chart support to watch.
>>> The latest Featured Stock Update with an annotated graph appeared on 8/2/2010. Click here.
View all notes |
Alert me of new notes |
CANSLIM.net Company Profile |
SEC |
Zacks Reports |
StockTalk |
News |
Chart |
Request a new note
C
A N
S L
I M
|
CRM
-
NYSE
Salesforce.Com Inc
INTERNET - Internet Software and Services
|
$104.06
|
+1.73
1.69% |
$104.44
|
1,527,079
62.00% of 50 DAV
50 DAV is 2,463,000
|
$103.77
0.28%
|
6/2/2010
|
$88.44
|
PP = $89.60
|
|
MB = $94.08
|
Most Recent Note - 8/9/2010 4:40:58 PM
G - Gain today with light volume for another new all-time high, getting extended from a sound base. Prior highs near $97 define near-term support to watch above its 50 DMA line.
>>> The latest Featured Stock Update with an annotated graph appeared on 7/15/2010. Click here.
View all notes |
Alert me of new notes |
CANSLIM.net Company Profile |
SEC |
Zacks Reports |
StockTalk |
News |
Chart |
Request a new note
C
A N
S L
I M
|
Symbol/Exchange
Company Name
Industry Group |
PRICE |
CHANGE
(%Change) |
Day High |
Volume
(% DAV)
(% 50 day avg vol) |
52 Wk Hi
% From Hi |
Featured
Date |
Price
Featured |
Pivot Featured |
|
Max Buy |
DTSI
-
NASDAQ
D T S Inc
CONSUMER DURABLES - Electronic Equipment
|
$37.00
|
+0.43
1.18% |
$37.15
|
92,343
95.99% of 50 DAV
50 DAV is 96,200
|
$37.60
-1.60%
|
7/27/2010
|
$37.00
|
PP = $36.28
|
|
MB = $38.09
|
Most Recent Note - 8/9/2010 4:43:32 PM
Y - The high-ranked Consumer Products - Electronic firm reported earnings after today's close. Estimates calling for lower FY '10 earnings have been noted as a concern. Prior highs in the $35-36 area define support above its 50 DMA line.
>>> The latest Featured Stock Update with an annotated graph appeared on 7/27/2010. Click here.
View all notes |
Alert me of new notes |
CANSLIM.net Company Profile |
SEC |
Zacks Reports |
StockTalk |
News |
Chart |
Request a new note
C
A N
S L
I M
|
FFIV
-
NASDAQ
F 5 Networks Inc
INTERNET - Internet Software and Services
|
$91.41
|
+2.93
3.31% |
$91.91
|
1,742,267
101.98% of 50 DAV
50 DAV is 1,708,400
|
$90.83
0.64%
|
6/16/2010
|
$74.50
|
PP = $74.10
|
|
MB = $77.81
|
Most Recent Note - 8/9/2010 4:44:43 PM
G - Gain today with average volume for a new all-time high. It has been repeatedly noted as -"extended from any sound base after recent volume-driven gains, it could go on to produce more climactic gains."
>>> The latest Featured Stock Update with an annotated graph appeared on 8/4/2010. Click here.
View all notes |
Alert me of new notes |
CANSLIM.net Company Profile |
SEC |
Zacks Reports |
StockTalk |
News |
Chart |
Request a new note
C
A N
S L
I M
|
MELI
-
NASDAQ
Mercadolibre Inc
INTERNET - Internet Software and; Services
|
$67.84
|
+2.01
3.05% |
$68.44
|
1,399,840
136.70% of 50 DAV
50 DAV is 1,024,000
|
$67.20
0.95%
|
5/13/2010
|
$54.21
|
PP = $55.85
|
|
MB = $58.64
|
Most Recent Note - 8/9/2010 4:45:36 PM
G - Gapped up today while posting its 5th consecutive gain. Extended from any sound base, prior highs in the $62 area define initial chart support.
>>> The latest Featured Stock Update with an annotated graph appeared on 7/23/2010. Click here.
View all notes |
Alert me of new notes |
CANSLIM.net Company Profile |
SEC |
Zacks Reports |
StockTalk |
News |
Chart |
Request a new note
C
A N
S L
I M
|
MWIV
-
NASDAQ
M W I Veterinary Supply
HEALTH SERVICES - Medical Instruments and; Supplies
|
$52.24
|
-1.01
-1.90% |
$54.00
|
69,834
95.79% of 50 DAV
50 DAV is 72,900
|
$54.48
-4.11%
|
7/29/2010
|
$52.05
|
PP = $52.09
|
|
MB = $54.69
|
Most Recent Note - 8/9/2010 4:48:28 PM
Y - Loss today on light volume. It endured distributional pressure and did not make meaningful price progress while trading above average volume in recent weeks, demonstrating "churning" action in a tight trading range near all-time highs.
>>> The latest Featured Stock Update with an annotated graph appeared on 7/30/2010. Click here.
View all notes |
Alert me of new notes |
CANSLIM.net Company Profile |
SEC |
Zacks Reports |
StockTalk |
News |
Chart |
Request a new note
C
A N
S L
I M
|
NEM
-
NYSE
Newmont Mining Corp
METALS and MINING - Gold
|
$57.24
|
+0.20
0.35% |
$57.39
|
3,664,239
43.69% of 50 DAV
50 DAV is 8,386,200
|
$63.38
-9.69%
|
6/22/2010
|
$59.60
|
PP = $59.67
|
|
MB = $62.65
|
Most Recent Note - 8/6/2010 6:16:23 PM
G - Technically volume totals have been light while it has rebounded near its 50 DMA line which may act as resistance after a damaging gap down on 7/27/10.
>>> The latest Featured Stock Update with an annotated graph appeared on 8/6/2010. Click here.
View all notes |
Alert me of new notes |
CANSLIM.net Company Profile |
SEC |
Zacks Reports |
StockTalk |
News |
Chart |
Request a new note
C
A N
S L
I M
|
Symbol/Exchange
Company Name
Industry Group |
PRICE |
CHANGE
(%Change) |
Day High |
Volume
(% DAV)
(% 50 day avg vol) |
52 Wk Hi
% From Hi |
Featured
Date |
Price
Featured |
Pivot Featured |
|
Max Buy |
NEOG
-
NASDAQ
Neogen Corp
DRUGS - Diagnostic Substances
|
$29.29
|
+0.69
2.41% |
$29.34
|
86,485
92.99% of 50 DAV
50 DAV is 93,000
|
$30.39
-3.62%
|
7/22/2010
|
$27.19
|
PP = $27.87
|
|
MB = $29.26
|
Most Recent Note - 8/9/2010 4:50:09 PM
Y - Gain today on below average volume, closing near its "max buy" level. Consolidating in a healthy fashion above prior highs in the $27 area defining near-term chart support to watch.
>>> The latest Featured Stock Update with an annotated graph appeared on 7/22/2010. Click here.
View all notes |
Alert me of new notes |
CANSLIM.net Company Profile |
SEC |
Zacks Reports |
StockTalk |
News |
Chart |
Request a new note
C
A N
S L
I M
|
NETL
-
NASDAQ
Netlogic Microsystems
ELECTRONICS - Semiconductor - Memory Chips
|
$29.43
|
+0.26
0.89% |
$29.58
|
949,271
73.42% of 50 DAV
50 DAV is 1,292,900
|
$35.00
-15.91%
|
7/28/2010
|
$33.44
|
PP = $35.10
|
|
MB = $36.86
|
Most Recent Note - 8/9/2010 4:51:38 PM
G - Small gain with light volume to close just above its 50 DMA line today. It did not trigger a technical buy signal after it was featured in the 7/28/10 mid-day report. While consolidating, its 7/30/10 low ($28.27) now defines the only support above its 200 DMA and earlier chart lows.
>>> The latest Featured Stock Update with an annotated graph appeared on 7/28/2010. Click here.
View all notes |
Alert me of new notes |
CANSLIM.net Company Profile |
SEC |
Zacks Reports |
StockTalk |
News |
Chart |
Request a new note
C
A N
S L
I M
|
ROVI
-
NASDAQ
Rovi Corp
COMPUTER SOFTWARE andamp; SERVICES - Security Software andamp; Services
|
$44.10
|
+0.10
0.23% |
$44.34
|
976,264
81.32% of 50 DAV
50 DAV is 1,200,500
|
$44.96
-1.91%
|
6/3/2010
|
$38.70
|
PP = $40.16
|
|
MB = $42.17
|
Most Recent Note - 8/6/2010 6:51:52 PM
G - Hovering near its 52-week high, extended from prior highs in the $40 area and its 50 DMA line which define chart support.
>>> The latest Featured Stock Update with an annotated graph appeared on 7/21/2010. Click here.
View all notes |
Alert me of new notes |
CANSLIM.net Company Profile |
SEC |
Zacks Reports |
StockTalk |
News |
Chart |
Request a new note
C
A N
S L
I M
|
SHOO
-
NASDAQ
Steven Madden Limited
CONSUMER NON-DURABLES - Textile - Apparel Footwear
|
$39.45
|
-0.12
-0.30% |
$39.92
|
479,363
117.00% of 50 DAV
50 DAV is 409,700
|
$40.98
-3.73%
|
8/5/2010
|
$39.55
|
PP = $41.08
|
|
MB = $43.13
|
Most Recent Note - 8/9/2010 4:54:03 PM
Y - Perched near its all-time high and still working on the right side of a 16-week cup shaped base without a handle. A proper "handle" forms over a minimum of 1 week and includes a pullback in the 10-12% range.
>>> The latest Featured Stock Update with an annotated graph appeared on 8/5/2010. Click here.
View all notes |
Alert me of new notes |
CANSLIM.net Company Profile |
SEC |
Zacks Reports |
StockTalk |
News |
Chart |
Request a new note
C
A N
S L
I M
|
ULTA
-
NASDAQ
Ulta Salon Cosm & Frag
SPECIALTY RETAIL - Specialty Retail, Other
|
$24.71
|
-0.08
-0.32% |
$25.00
|
308,259
42.78% of 50 DAV
50 DAV is 720,500
|
$26.75
-7.63%
|
8/4/2010
|
$24.90
|
PP = $26.85
|
|
MB = $28.19
|
Most Recent Note - 8/9/2010 4:57:32 PM
Y - Today's 5th consecutive loss while consolidating just above its 50 DMA line leaves it -7.6% off its 52-week high. It would need to rally above the new pivot point cited with volume conviction to trigger a proper technical buy signal.
>>> The latest Featured Stock Update with an annotated graph appeared on 7/19/2010. Click here.
View all notes |
Alert me of new notes |
CANSLIM.net Company Profile |
SEC |
Zacks Reports |
StockTalk |
News |
Chart |
Request a new note
C
A N
S L
I M
|
Symbol/Exchange
Company Name
Industry Group |
PRICE |
CHANGE
(%Change) |
Day High |
Volume
(% DAV)
(% 50 day avg vol) |
52 Wk Hi
% From Hi |
Featured
Date |
Price
Featured |
Pivot Featured |
|
Max Buy |
VIT
-
NYSE
Vanceinfo Tech Inc Ads
COMPUTER SOFTWARE and SERVICES - Business Software and Services
|
$27.74
|
+0.21
0.76% |
$27.93
|
334,181
67.27% of 50 DAV
50 DAV is 496,800
|
$27.84
-0.36%
|
7/8/2010
|
$25.20
|
PP = $26.58
|
|
MB = $27.91
|
Most Recent Note - 8/9/2010 4:58:36 PM
Y - Wedged up for a new all-time high today with a 4th consecutive gain on lighter than average volume. It has not triggered a confirming buy signal with volume yet since featured in the 7/08/10 mid-day report. Its 7/29/10 low ($24.55) defines initial support above its 50 DMA line.
>>> The latest Featured Stock Update with an annotated graph appeared on 7/26/2010. Click here.
View all notes |
Alert me of new notes |
CANSLIM.net Company Profile |
SEC |
Zacks Reports |
StockTalk |
News |
Chart |
Request a new note
C
A N
S L
I M
|