You are not logged in.
This means you
CAN ONLY VIEW reports that were published prior to Monday, April 14, 2025.
You
MUST UPGRADE YOUR MEMBERSHIP if you want to see any current reports.
AFTER MARKET UPDATE - FRIDAY, AUGUST 5TH, 2011
Previous After Market Report Next After Market Report >>>
|
|
|
|
DOW |
+60.93 |
11,444.61 |
+0.54% |
|
Volume |
2,254,236,670 |
+24% |
|
Volume |
3,694,795,600 |
+15% |
|
NASDAQ |
-23.98 |
2,532.41 |
-0.94% |
|
Advancers |
796 |
25% |
|
Advancers |
784 |
29% |
|
S&P 500 |
-0.69 |
1,199.38 |
-0.06% |
|
Decliners |
2,306 |
73% |
|
Decliners |
1,865 |
69% |
|
Russell 2000 |
-12.17 |
714.63 |
-1.67% |
|
52 Wk Highs |
6 |
|
|
52 Wk Highs |
7 |
|
|
S&P 600 |
-5.98 |
389.89 |
-1.51% |
|
52 Wk Lows |
828 |
|
|
52 Wk Lows |
436 |
|
|
 |
Major Averages Suffered Worst Week in 2 Years
Kenneth J. Gruneisen - Passed the CAN SLIM® Master's Exam
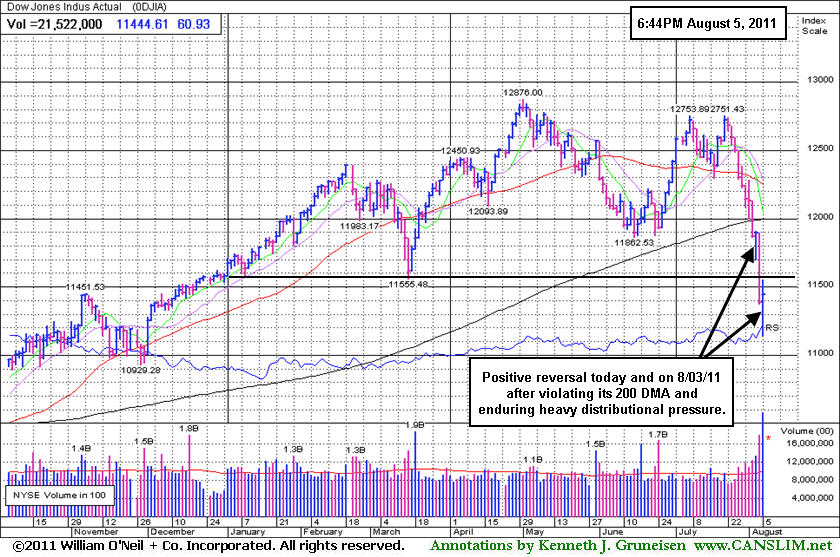
For the week, Dow Jones Industrial Average was down -5.7%, the S&P 500 Index fell -7.2%, and the Nasdaq Composite Index lost -8.1%. Volume totals were reported higher than the prior session totals on the NYSE and on the Nasdaq exchange, continuing the previously noted market correction (M criteria) with more distributional selling from the institutional crowd. New 52-week lows substantially outnumbered new 52-week highs on the NYSE and on the Nasdaq exchange. New highs totals were in the single digits on both major exchanges for the first time in a very long while. Declining issues beat advancers by nearly 3-1 on the NYSE and by 5-2 on the Nasdaq exchange. There were 2 high-ranked companies from the CANSLIM.net Leaders List that made new 52-week highs and appeared on the CANSLIM.net BreakOuts Page, down from the prior total of 7 stocks. There were only 3 gainers out of the 16 high-ranked leaders currently included on the Featured Stocks Page.
Procter & Gamble (PG +1.7%) was one of the best in the Dow Industrials, rising after earnings beat expectations. Exhausted traders breathed a sigh of relief at the close on Friday after the Dow rebounded when it had initially been on its way to another huge loss. The S&P 500 Index finished a fraction of a point below the key 1,200 level. The pace was feverish and volume was heavy the day after investors were shocked by the worst rout in more than two years.
Europe is expected to take further action to halt the debt crisis. In an attempt to attract buyers for the country's bonds, Italy's Prime Minister said the country will speed up its austerity measures and will seek a balanced budget by 2013.
A report on U.S. jobs was a small relief. Non-farm payrolls increased 117,000 in July, not a huge number, but above expectations. The July unemployment rate declined to 9.1%. Average hourly earnings climbed 0.4% during the month, more than forecast. The 10-year Treasury note dropped a full point to yield 2.57%.
The current market correction leaves disciplined investors in a defensive stance, looking toward protecting capital rather than adding more market exposure. A new rally confirmed by a solid follow-through day would be an important reassurance worth waiting for before new buying efforts may be justified. Meanwhile, the indices remain below their respective 200-day moving average (DMA) lines after a well-noted and damaging streak of losses. Fans of the fact-based investment system may recognize the major indices below their 200 DMA lines as a worrisome sign of an "unhealthy" market environment (M criteria).
The August 2011 issue of CANSLIM.net News will be published soon! Links to all prior reports are available on the Premium Member Homepage.
PICTURED: The Dow Jones Industrial Average made positive reversals on Friday and on Wednesday this week after violating its 200-day moving average (DMA) line and enduring heavy distributional pressure. A positive reversal is not an indication of a change in trend, but it can often mark a solid Day 1 of a rally that works. Disciplined investors will be waiting until a follow-through day, ideally occurring between Day 4 and Day 7 of a new rally effort, providing solid confirmation before any new buying efforts would be justified.
|
 Kenneth J. Gruneisen started out as a licensed stockbroker in August 1987, a couple of months prior to the historic stock market crash that took the Dow Jones Industrial Average down -22.6% in a single day. He has published daily fact-based fundamental and technical analysis on high-ranked stocks online for two decades. Through FACTBASEDINVESTING.COM, Kenneth provides educational articles, news, market commentary, and other information regarding proven investment systems that work in good times and bad.
Comments contained in the body of this report are technical opinions only and are not necessarily those of Gruneisen Growth Corp. The material herein has been obtained from sources believed to be reliable and accurate, however, its accuracy and completeness cannot be guaranteed. Our firm, employees, and customers may effect transactions, including transactions contrary to any recommendation herein, or have positions in the securities mentioned herein or options with respect thereto. Any recommendation contained in this report may not be suitable for all investors and it is not to be deemed an offer or solicitation on our part with respect to the purchase or sale of any securities. |
|
 |
Leading Indicators' Warnings Came Before Worse Market Action
Kenneth J. Gruneisen - Passed the CAN SLIM® Master's Exam
Defensive groups including the Healthcare Index ($HMO -0.68%) and Gold & Silver Index ($XAU -0.54%) suffered modest losses on Friday. The tech sector was mostly negative as the Semiconductor Index ($SOX -1.99%) led the declines and Internet Index ($IIX -0.75%) and Biotechnology Index ($BTK -0.38%) edged lower while the Networking Index ($NWX +0.45%) eked out a small gain. Energy-related shares fell as the Oil Services Index ($OSX -0.87%) and Integrated Oil Index ($XOI -0.23%) closed lower. The Retail Index ($RLX +0.56%) fought for a small gain but couldn't offset broader weakness.
Charts courtesy www.stockcharts.com
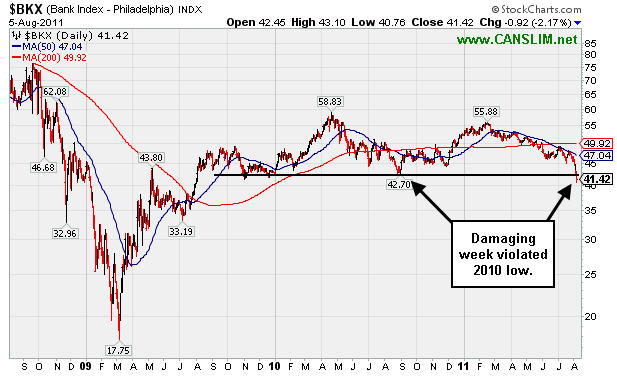
PICTURED: The Bank Index ($BKX -2.17%) fell to a new 2011 low and violated its 2010 low. Financial shares are reliable as "leading indicators", and regular readers have seen their prior weakness noted repeatedly as a warning sign well before the major averages deteriorated badly.
Charts courtesy www.stockcharts.com
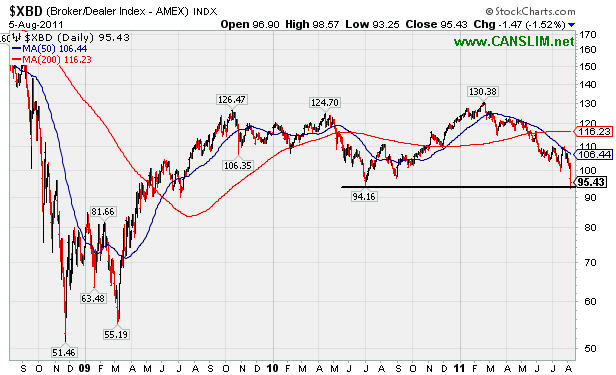
PICTURED: The Broker/Dealer Index ($BKX -1.52%) sank to a new 2011 low and dipped under its 2010 low intra-day.
| Oil Services |
$OSX |
237.20 |
-2.08 |
-0.87% |
-3.23% |
| Healthcare |
$HMO |
1,920.66 |
-13.19 |
-0.68% |
+13.52% |
| Integrated Oil |
$XOI |
1,148.91 |
-2.62 |
-0.23% |
-5.30% |
| Semiconductor |
$SOX |
350.22 |
-7.10 |
-1.99% |
-14.96% |
| Networking |
$NWX |
238.42 |
+1.07 |
+0.45% |
-15.02% |
| Internet |
$IIX |
280.77 |
-2.13 |
-0.75% |
-8.76% |
| Broker/Dealer |
$XBD |
95.43 |
-1.47 |
-1.52% |
-21.47% |
| Retail |
$RLX |
495.43 |
+2.75 |
+0.56% |
-2.55% |
| Gold & Silver |
$XAU |
196.06 |
-1.06 |
-0.54% |
-13.47% |
| Bank |
$BKX |
41.42 |
-0.92 |
-2.17% |
-20.67% |
| Biotech |
$BTK |
1,140.58 |
-4.34 |
-0.38% |
-12.10% |
|
|
|
 |
Sell Signals Prompt Profit Taking
Kenneth J. Gruneisen - Passed the CAN SLIM® Master's Exam
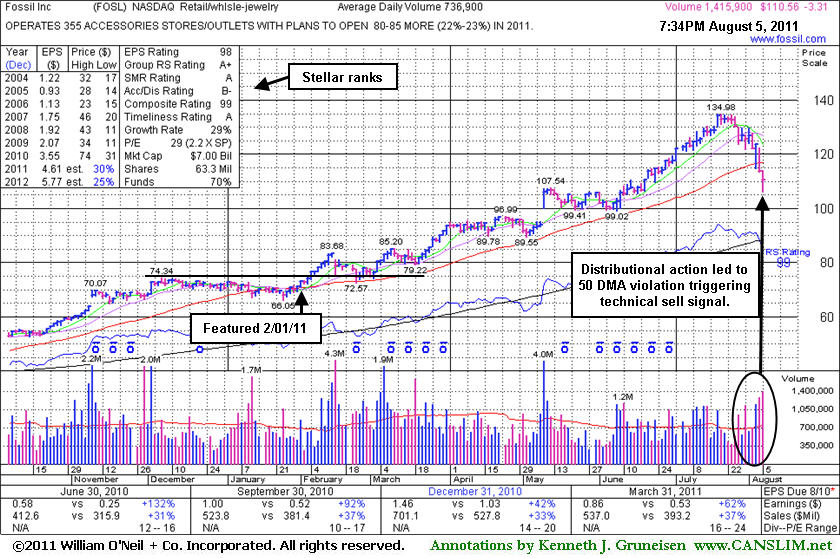
Fossil Inc (FOSL -$3.31 or -2.91% to $110.56) was down again today with above average volume, finishing in the middle of its intra-day range after slumping near the $107 area previously noted as the next important support level to watch. Damaging losses this week with above average volume violated its 50-day moving average (DMA) line and triggered a technical sell signal. It will be dropped from the Featured Stocks list tonight. Since last shown in this FSU section on 7/21/11 with an annotated graph under the headline, "Extended From Any Sound Base After Steady Climb ", it has been hit with several distribution days.
The number of top-rated funds owning its shares rose from 523 in Sep '10 to 614 in Jun '11 a reassuring sign concerning the I criteria of the investment system. It reported strong earnings +62% on +37% sales revenues for the quarter ended March 31, 2011 versus the year ago period. Its strong earnings history satisfies the C and A criteria. Much earlier, FOSL appeared in this section near $44 on 8/11/10 under the headline, "Breakaway Gap On More Than Triple Average Volume". It was featured in yellow in the 8/10/10 mid-day report (read here) and has subsequently traded as much as +200% higher.
|
|
|
Color Codes Explained :
Y - Better candidates highlighted by our
staff of experts.
G - Previously featured
in past reports as yellow but may no longer be buyable under the
guidelines.
***Last / Change / Volume data in this table is the closing quote data***
Symbol/Exchange
Company Name
Industry Group |
PRICE |
CHANGE
(%Change) |
Day High |
Volume
(% DAV)
(% 50 day avg vol) |
52 Wk Hi
% From Hi |
Featured
Date |
Price
Featured |
Pivot Featured |
|
Max Buy |
ATHN
-
NASDAQ
Athenahealth Inc
DIVERSIFIED SERVICES - Business/Management Services
|
$53.69
|
-0.48
-0.89% |
$55.25
|
895,056
166.62% of 50 DAV
50 DAV is 537,200
|
$61.78
-13.09%
|
7/22/2011
|
$57.30
|
PP = $50.66
|
|
MB = $53.19
|
Most Recent Note - 8/4/2011 5:01:18 PM
G - Down considerably today with above average volume. Prior highs in the $50 area define important chart support after its 7/22/11 breakaway gap.
>>> The latest Featured Stock Update with an annotated graph appeared on 7/27/2011. Click here.
View all notes |
Alert me of new notes |
CANSLIM.net Company Profile |
SEC |
Zacks Reports |
StockTalk |
News |
Chart |
Request a new note
C
A N
S L
I M


|
BIDU
-
NASDAQ
Baidu Inc Ads
INTERNET - Internet Information Providers
|
$140.99
|
-2.93
-2.04% |
$147.20
|
14,897,122
162.22% of 50 DAV
50 DAV is 9,183,100
|
$165.96
-15.05%
|
7/26/2011
|
$164.32
|
PP = $156.14
|
|
MB = $163.95
|
 Most Recent Note - 8/5/2011 6:19:31 PM
Rebounded after slumping below its 50 DMA line today, but the deterioration deeper into its prior base with another damaging loss on above average volume raised greater concerns. It will be dropped from the Featured Stocks list tonight.
>>> The latest Featured Stock Update with an annotated graph appeared on 7/28/2011. Click here.
View all notes |
Alert me of new notes |
CANSLIM.net Company Profile |
SEC |
Zacks Reports |
StockTalk |
News |
Chart |
Request a new note
C
A N
S L
I M
|
CACC
-
NASDAQ
Credit Acceptance Corp
FINANCIAL SERVICES - Credit Services
|
$74.00
|
-1.00
-1.33% |
$75.72
|
50,223
130.45% of 50 DAV
50 DAV is 38,500
|
$86.87
-14.82%
|
6/2/2011
|
$76.10
|
PP = $82.39
|
|
MB = $86.51
|
Most Recent Note - 8/5/2011 6:22:02 PM
Down today for a 4th consecutive loss with above average volume. Its 200 DMA line defines the next support near the $70 level. Based on weak action it will be dropped from the Featured Stocks list tonight.
>>> The latest Featured Stock Update with an annotated graph appeared on 6/27/2011. Click here.
View all notes |
Alert me of new notes |
CANSLIM.net Company Profile |
SEC |
Zacks Reports |
StockTalk |
News |
Chart |
Request a new note
C
A N
S L
I M
|
EXLS
-
NASDAQ
Exlservice Holdings Inc
DIVERSIFIED SERVICES - Business/Management Services
|
$25.88
|
-0.01
-0.04% |
$26.31
|
155,691
228.29% of 50 DAV
50 DAV is 68,200
|
$26.46
-2.19%
|
8/2/2011
|
$24.85
|
PP = $24.85
|
|
MB = $26.09
|
Most Recent Note - 8/5/2011 12:13:20 PM
Y - Holding its ground against a severely negative market backdrop. After featured in the 8/02/11 mid-day report its 8/03/11 gain triggered a technical buy signal with +170% above average volume behind its gain. The M criteria urges extreme caution, however, since 3 out of 4 stocks generally go along with the broader market averages.
>>> The latest Featured Stock Update with an annotated graph appeared on 8/2/2011. Click here.
View all notes |
Alert me of new notes |
CANSLIM.net Company Profile |
SEC |
Zacks Reports |
StockTalk |
News |
Chart |
Request a new note
C
A N
S L
I M
|
FCFS
-
NASDAQ
First Cash Financial Svs
SPECIALTY RETAIL - Specialty Retail, Other
|
$41.92
|
-1.21
-2.81% |
$43.80
|
577,476
256.88% of 50 DAV
50 DAV is 224,800
|
$46.42
-9.69%
|
5/31/2011
|
$42.00
|
PP = $40.23
|
|
MB = $42.24
|
Most Recent Note - 8/5/2011 5:47:30 PM
G - Down today with even heavier volume indicating more worrisome distributional pressure, testing its 50 DMA line and important near-term support in the $41 area.
>>> The latest Featured Stock Update with an annotated graph appeared on 7/18/2011. Click here.
View all notes |
Alert me of new notes |
CANSLIM.net Company Profile |
SEC |
Zacks Reports |
StockTalk |
News |
Chart |
Request a new note
C
A N
S L
I M
|
Symbol/Exchange
Company Name
Industry Group |
PRICE |
CHANGE
(%Change) |
Day High |
Volume
(% DAV)
(% 50 day avg vol) |
52 Wk Hi
% From Hi |
Featured
Date |
Price
Featured |
Pivot Featured |
|
Max Buy |
FOSL
-
NASDAQ
Fossil Inc
CONSUMER DURABLES - Recreational Goods, Other
|
$110.56
|
-3.31
-2.91% |
$114.00
|
1,416,786
192.26% of 50 DAV
50 DAV is 736,900
|
$134.98
-18.09%
|
2/1/2011
|
$73.30
|
PP = $74.44
|
|
MB = $78.16
|
Most Recent Note - 8/5/2011 6:23:44 PM
Down again today with above average volume, finishing in the middle of its intra-day range after slumping near the $107 area previously noted as the next important support level to watch. Damaging losses this week with above average volume violated its 50 DMA line and triggered a technical sell signal. It will be dropped from the Featured Stocks list tonight.
>>> The latest Featured Stock Update with an annotated graph appeared on 8/5/2011. Click here.
View all notes |
Alert me of new notes |
CANSLIM.net Company Profile |
SEC |
Zacks Reports |
StockTalk |
News |
Chart |
Request a new note
C
A N
S L
I M
|
LULU
-
NASDAQ
Lululemon Athletica
MANUFACTURING - Textile Manufacturing
|
$53.57
|
-2.42
-4.32% |
$57.41
|
8,115,688
193.47% of 50 DAV
50 DAV is 4,194,900
|
$64.49
-16.93%
|
6/21/2011
|
$51.48
|
PP = $50.57
|
|
MB = $53.10
|
Most Recent Note - 8/5/2011 6:12:56 PM
Damaging loss today with nearly 2 times average volume violated its 50 DMA line and raised concerns while triggering a technical sell signal. It tested prior resistance in the $51 area defining the next support level below its short-term average. Finished -17% off its 52-week high, and it will be dropped from the Featured Stocks list tonight based on its worrisome deterioration.
>>> The latest Featured Stock Update with an annotated graph appeared on 7/15/2011. Click here.
View all notes |
Alert me of new notes |
CANSLIM.net Company Profile |
SEC |
Zacks Reports |
StockTalk |
News |
Chart |
Request a new note
C
A N
S L
I M
|
MA
-
NYSE
Mastercard Inc Cl A
DIVERSIFIED SERVICES - Business/Management Services
|
$326.54
|
+3.94
1.22% |
$330.94
|
2,376,708
184.83% of 50 DAV
50 DAV is 1,285,900
|
$340.42
-4.08%
|
8/3/2011
|
$324.82
|
PP = $322.38
|
|
MB = $338.50
|
Most Recent Note - 8/5/2011 6:14:57 PM
Y - Positive reversal today was an encouraging sign of strength after a brief slump below its pivot point raised concerns. The considerable gap up gain on 8/03/11 for a new all-time high after a 4 week consolidation triggered a technical buy signal. The M criteria remains an overriding concern for disciplined investors, arguing against any new buying efforts until a confirmed uptrend in the major averages resumes.
>>> The latest Featured Stock Update with an annotated graph appeared on 8/3/2011. Click here.
View all notes |
Alert me of new notes |
CANSLIM.net Company Profile |
SEC |
Zacks Reports |
StockTalk |
News |
Chart |
Request a new note
C
A N
S L
I M
|
MKTX
-
NASDAQ
Marketaxess Holdings Inc
FINANCIAL SERVICES - Investment Brokerage - Nationa
|
$25.72
|
-0.80
-3.02% |
$27.00
|
205,078
121.49% of 50 DAV
50 DAV is 168,800
|
$27.21
-5.48%
|
7/29/2011
|
$25.87
|
PP = $26.35
|
|
MB = $27.67
|
Most Recent Note - 8/5/2011 5:41:58 PM
Y - Loss today with average volume led to a close back below its pivot point after the prior loss indicated distributional pressure. Its 8/03/11 gain with only +25% above average volume was below the volume threshold for a proper technical buy signal.
>>> The latest Featured Stock Update with an annotated graph appeared on 7/29/2011. Click here.
View all notes |
Alert me of new notes |
CANSLIM.net Company Profile |
SEC |
Zacks Reports |
StockTalk |
News |
Chart |
Request a new note
C
A N
S L
I M
|
MWIV
-
NASDAQ
M W I Veterinary Supply
HEALTH SERVICES - Medical Instruments and; Supplies
|
$81.24
|
-1.86
-2.24% |
$83.47
|
80,290
125.06% of 50 DAV
50 DAV is 64,200
|
$90.24
-9.97%
|
7/11/2011
|
$83.39
|
PP = $84.67
|
|
MB = $88.90
|
Most Recent Note - 8/5/2011 5:44:40 PM
Closed below its 50 DMA line today while suffering its 5th consecutive loss, slumping back into its prior base. Prior lows in the $77-78 area define the next very important chart support level to watch. Based on the noted fundamental and technical deterioration it will be dropped from the Featured Stocks list tonight.
>>> The latest Featured Stock Update with an annotated graph appeared on 6/30/2011. Click here.
View all notes |
Alert me of new notes |
CANSLIM.net Company Profile |
SEC |
Zacks Reports |
StockTalk |
News |
Chart |
Request a new note
C
A N
S L
I M
|
Symbol/Exchange
Company Name
Industry Group |
PRICE |
CHANGE
(%Change) |
Day High |
Volume
(% DAV)
(% 50 day avg vol) |
52 Wk Hi
% From Hi |
Featured
Date |
Price
Featured |
Pivot Featured |
|
Max Buy |
OTEX
-
NASDAQ
Open Text Corp
INTERNET - Internet Software and Services
|
$59.69
|
-0.58
-0.96% |
$61.17
|
417,255
147.44% of 50 DAV
50 DAV is 283,000
|
$72.32
-17.46%
|
6/1/2011
|
$65.86
|
PP = $67.18
|
|
MB = $70.54
|
Most Recent Note - 8/5/2011 6:08:32 PM
Down today with higher volume indicative of more distributional pressure, closing -17% off its 52-week high. Dipped below prior lows near $58 intra-day while slumping near its 200 DMA line. Based on deterioration it will be dropped from the Featured Stocks list tonight.
>>> The latest Featured Stock Update with an annotated graph appeared on 7/20/2011. Click here.
View all notes |
Alert me of new notes |
CANSLIM.net Company Profile |
SEC |
Zacks Reports |
StockTalk |
News |
Chart |
Request a new note
C
A N
S L
I M
|
PCLN
-
NASDAQ
Priceline.Com Inc
INTERNET - Internet Software and Services
|
$527.81
|
+44.47
9.20% |
$540.90
|
4,049,291
409.72% of 50 DAV
50 DAV is 988,300
|
$561.88
-6.06%
|
7/29/2011
|
$539.46
|
PP = $552.15
|
|
MB = $579.76
|
Most Recent Note - 8/5/2011 9:40:47 AM
G - Gapped up today after reporting earnings +78% on +44% sales revenues for the quarter ended June 30, 2011 versus the year ago period. Promptly repaired its 50 DMA line violation, but it faces resistance at prior chart highs. The M criteria overrides all other promising criteria, since 3 out of 4 stocks follow the direction of the major averages.
>>> The latest Featured Stock Update with an annotated graph appeared on 8/1/2011. Click here.
View all notes |
Alert me of new notes |
CANSLIM.net Company Profile |
SEC |
Zacks Reports |
StockTalk |
News |
Chart |
Request a new note
C
A N
S L
I M
|
PRGO
-
NASDAQ
Perrigo Co
DRUGS - Drug Related Products
|
$82.03
|
-1.76
-2.10% |
$84.81
|
1,297,029
266.66% of 50 DAV
50 DAV is 486,400
|
$94.61
-13.30%
|
7/13/2011
|
$92.89
|
PP = $92.40
|
|
MB = $97.02
|
Most Recent Note - 8/5/2011 5:56:53 PM
G - Traded near under prior lows near $81 and nearly tested its 200 DMA line at the session low before rebounding to close in the middle of its intra-day range.
>>> The latest Featured Stock Update with an annotated graph appeared on 7/13/2011. Click here.
View all notes |
Alert me of new notes |
CANSLIM.net Company Profile |
SEC |
Zacks Reports |
StockTalk |
News |
Chart |
Request a new note
C
A N
S L
I M
|
PSMT
-
NASDAQ
Pricesmart Inc
RETAIL - Drug Stores
|
$57.97
|
+2.19
3.93% |
$59.37
|
490,213
209.05% of 50 DAV
50 DAV is 234,500
|
$62.27
-6.91%
|
7/22/2011
|
$60.04
|
PP = $61.14
|
|
MB = $64.20
|
Most Recent Note - 8/5/2011 5:58:56 PM
G - Gain today with higher volume indicated impressive support near prior chart lows and well above its 50 DMA line. The negative bias in the broader market (M criteria) argues against new buying efforts for the near-term until a confirmation day occurs.
>>> The latest Featured Stock Update with an annotated graph appeared on 7/22/2011. Click here.
View all notes |
Alert me of new notes |
CANSLIM.net Company Profile |
SEC |
Zacks Reports |
StockTalk |
News |
Chart |
Request a new note
C
A N
S L
I M
|
QSII
-
NASDAQ
Quality Systems Inc
COMPUTER SOFTWARE and SERVICES - Healthcare Information Service
|
$81.32
|
-3.17
-3.75% |
$85.18
|
415,897
161.33% of 50 DAV
50 DAV is 257,800
|
$93.64
-13.16%
|
7/6/2011
|
$91.26
|
PP = $91.67
|
|
MB = $96.25
|
Most Recent Note - 8/5/2011 6:01:26 PM
Damaging loss today on above average volume, slumping near its 200 DMA line and prior lows in the $77 area defining the next important support level. Violated its 50 DMA line on the prior session, raising concerns after not triggering a proper technical buy signal. Based on its deterioration it will be dropped from the Featured Stocks list tonight.
>>> The latest Featured Stock Update with an annotated graph appeared on 7/6/2011. Click here.
View all notes |
Alert me of new notes |
CANSLIM.net Company Profile |
SEC |
Zacks Reports |
StockTalk |
News |
Chart |
Request a new note
C
A N
S L
I M
|
Symbol/Exchange
Company Name
Industry Group |
PRICE |
CHANGE
(%Change) |
Day High |
Volume
(% DAV)
(% 50 day avg vol) |
52 Wk Hi
% From Hi |
Featured
Date |
Price
Featured |
Pivot Featured |
|
Max Buy |
ZAGG
-
NASDAQ
Zagg Inc
SPECIALTY RETAIL - Specialty Retail, Other
|
$13.38
|
-1.66
-11.04% |
$15.69
|
2,797,326
112.11% of 50 DAV
50 DAV is 2,495,100
|
$16.90
-20.83%
|
6/1/2011
|
$10.92
|
PP = $10.59
|
|
MB = $11.12
|
Most Recent Note - 8/5/2011 6:06:00 PM
Down considerably today, diving to its 50 DMA line and finishing the session -20% off its 52-week high. Based on deterioration it will be dropped from the Featured Stocks list tonight. Prior low ($11.44 on 7/07/11) defines the next important chart support to watch. Weak market conditions (M criteria) are typically a problem for 3 out of 4 stocks, even when they have stellar growth characteristics.
>>> The latest Featured Stock Update with an annotated graph appeared on 7/19/2011. Click here.
View all notes |
Alert me of new notes |
CANSLIM.net Company Profile |
SEC |
Zacks Reports |
StockTalk |
News |
Chart |
Request a new note
C
A N
S L
I M
|
|
|
|
THESE ARE NOT BUY RECOMMENDATIONS!
Comments contained in the body of this report are technical
opinions only. The material herein has been obtained
from sources believed to be reliable and accurate, however,
its accuracy and completeness cannot be guaranteed.
This site is not an investment advisor, hence it does
not endorse or recommend any securities or other investments.
Any recommendation contained in this report may not
be suitable for all investors and it is not to be deemed
an offer or solicitation on our part with respect to
the purchase or sale of any securities. All trademarks,
service marks and trade names appearing in this report
are the property of their respective owners, and are
likewise used for identification purposes only.
This report is a service available
only to active Paid Premium Members.
You may opt-out of receiving report notifications
at any time. Questions or comments may be submitted
by writing to Premium Membership Services 665 S.E. 10 Street, Suite 201 Deerfield Beach, FL 33441-5634 or by calling 1-800-965-8307
or 954-785-1121.
|
|
|

