You are not logged in.
This means you
CAN ONLY VIEW reports that were published prior to Tuesday, April 15, 2025.
You
MUST UPGRADE YOUR MEMBERSHIP if you want to see any current reports.
AFTER MARKET UPDATE - MONDAY, AUGUST 8TH, 2011
Previous After Market Report Next After Market Report >>>
|
|
|
|
DOW |
-634.76 |
10,809.85 |
-5.55% |
|
Volume |
2,543,568,980 |
+13% |
|
Volume |
3,926,355,400 |
+6% |
|
NASDAQ |
-174.72 |
2,357.69 |
-6.90% |
|
Advancers |
44 |
1% |
|
Advancers |
124 |
5% |
|
S&P 500 |
-79.92 |
1,119.46 |
-6.66% |
|
Decliners |
3,115 |
98% |
|
Decliners |
2,596 |
94% |
|
Russell 2000 |
-63.67 |
650.96 |
-8.91% |
|
52 Wk Highs |
3 |
|
|
52 Wk Highs |
4 |
|
|
S&P 600 |
-33.06 |
356.83 |
-8.48% |
|
52 Wk Lows |
1,282 |
|
|
52 Wk Lows |
725 |
|
|
 |
Extremely Negative Breadth While Market Nosedives
Kenneth J. Gruneisen - Passed the CAN SLIM® Master's Exam
The S&P downgrade of U.S. sovereign debt sent shock waves through Wall Street as the major averages plunged on Monday. Volume totals were reported even higher than the prior session totals on the NYSE and on the Nasdaq exchange, continuing the previously noted market correction (M criteria) with more distributional selling from the institutional crowd. Declining issues beat advancers by 70-1 on the NYSE and by 20-1 on the Nasdaq exchange. New 52-week lows substantially outnumbered new 52-week highs on the NYSE and on the Nasdaq exchange. New highs totals were in the single digits on both major exchanges for the second day in a row. There was 1 high-ranked company from the CANSLIM.net Leaders List that made a new 52-week high and appeared on the CANSLIM.net BreakOuts Page, down from the prior total of 2 stocks. There were no gainers out of the 9 high-ranked leaders currently included on the Featured Stocks Page.
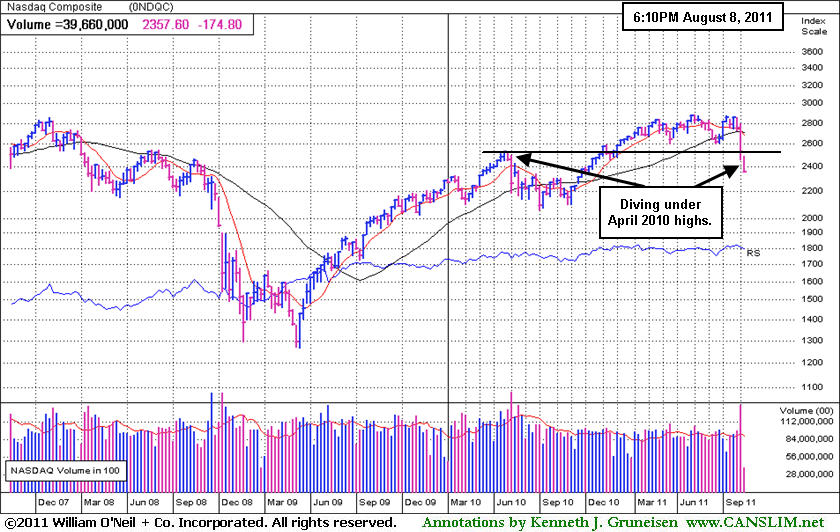
The S&P 500 Index extended its worst slump since the bear market in 2008 and the Dow closed below 11,000 for the first time since October. S&P also lowered credit ratings on Fannie Mae, Freddie Mac and other lenders with a "direct reliance" on the U.S. government. The action spurred concern over the ripple effects from the loss of America's Triple-A credit rating. The 10-year Treasury note was sharply higher, and the yield fell to 2.34%.
Crude oil fell more than $5 a barrel to an eight-month low. Gold topped $1,700 an ounce. European stock markets plunged even though the European Central Bank began buying Italian and Spanish bonds in an attempt to tame the continent's debt crisis.
Financials and energy stocks were the hardest hit sectors. Bank of America Corp (BAC -20.3%) dove lower after American International Group Inc (AIG -10%) filed suit against the company, claiming losses of over $10 billion on mortgage bond instruments.
The current market correction leaves disciplined investors in a defensive stance, looking toward protecting capital rather than adding more market exposure. A new rally confirmed by a solid follow-through day would be an important reassurance worth waiting for before new buying efforts may be justified. Meanwhile, the indices remain below their respective 200-day moving average (DMA) lines after a well-noted and damaging streak of losses. Fans of the fact-based investment system may recognize the major indices below their 200 DMA lines as a worrisome sign of an "unhealthy" market environment (M criteria).
The August 2011 issue of CANSLIM.net News will be published soon! Links to all prior reports are available on the Premium Member Homepage.
PICTURED: The Nasdaq Composite Index closed at its low for the session after diving deep below its old April 2010 highs.
|
 Kenneth J. Gruneisen started out as a licensed stockbroker in August 1987, a couple of months prior to the historic stock market crash that took the Dow Jones Industrial Average down -22.6% in a single day. He has published daily fact-based fundamental and technical analysis on high-ranked stocks online for two decades. Through FACTBASEDINVESTING.COM, Kenneth provides educational articles, news, market commentary, and other information regarding proven investment systems that work in good times and bad.
Comments contained in the body of this report are technical opinions only and are not necessarily those of Gruneisen Growth Corp. The material herein has been obtained from sources believed to be reliable and accurate, however, its accuracy and completeness cannot be guaranteed. Our firm, employees, and customers may effect transactions, including transactions contrary to any recommendation herein, or have positions in the securities mentioned herein or options with respect thereto. Any recommendation contained in this report may not be suitable for all investors and it is not to be deemed an offer or solicitation on our part with respect to the purchase or sale of any securities. |
|
 |
Investors Flee Financial Stocks Like Poison
Kenneth J. Gruneisen - Passed the CAN SLIM® Master's Exam
Financial stocks were treated like poison as the Bank Index ($BKX -10.70%) and Broker/Dealer Index ($XBD -9.24%) led the market's sharp decline on Monday. The Oil Services Index ($OSX -10.04%) and Integrated Oil Index ($XOI -8.54%) suffered large losses as crude prices plunged. The Healthcare Index ($HMO -8.66%) continued rapidly giving back the year's previously impressive gains. The Networking Index ($NWX -9.02%) led the tech sector's retreat while the Internet Index ($IIX -6.62%), Biotechnology Index ($BTK -6.57%), and Semiconductor Index ($SOX -5.39%) were also smacked with big losses. The Retail Index ($RLX -6.07%) also rung up a large loss. The Gold & Silver Index ($XAU -1.69%) edged lower, unable to rise against the overwhelmingly negative market backdrop.
Charts courtesy www.stockcharts.com
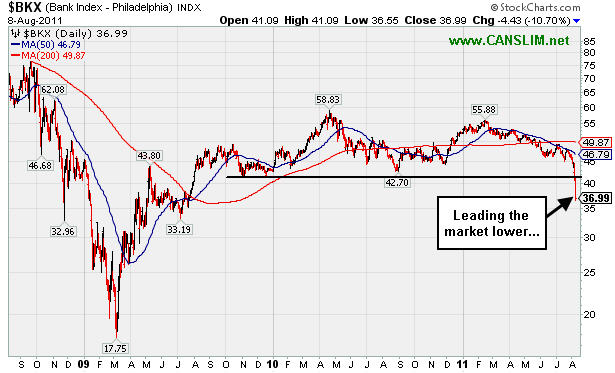
PICTURED: The Bank Index ($BKX -10.70%) continues leading the market lower.
| Oil Services |
$OSX |
213.39 |
-23.81 |
-10.04% |
-12.94% |
| Healthcare |
$HMO |
1,754.38 |
-166.29 |
-8.66% |
+3.69% |
| Integrated Oil |
$XOI |
1,050.78 |
-98.12 |
-8.54% |
-13.38% |
| Semiconductor |
$SOX |
331.33 |
-18.89 |
-5.39% |
-19.54% |
| Networking |
$NWX |
216.91 |
-21.51 |
-9.02% |
-22.68% |
| Internet |
$IIX |
262.17 |
-18.59 |
-6.62% |
-14.80% |
| Broker/Dealer |
$XBD |
86.61 |
-8.82 |
-9.24% |
-28.73% |
| Retail |
$RLX |
465.36 |
-30.07 |
-6.07% |
-8.46% |
| Gold & Silver |
$XAU |
192.74 |
-3.32 |
-1.69% |
-14.94% |
| Bank |
$BKX |
36.99 |
-4.43 |
-10.70% |
-29.15% |
| Biotech |
$BTK |
1,065.66 |
-74.92 |
-6.57% |
-17.88% |
|
|
|
 |
Negative Reversal to a Close Below its Pivot Point
Kenneth J. Gruneisen - Passed the CAN SLIM® Master's Exam
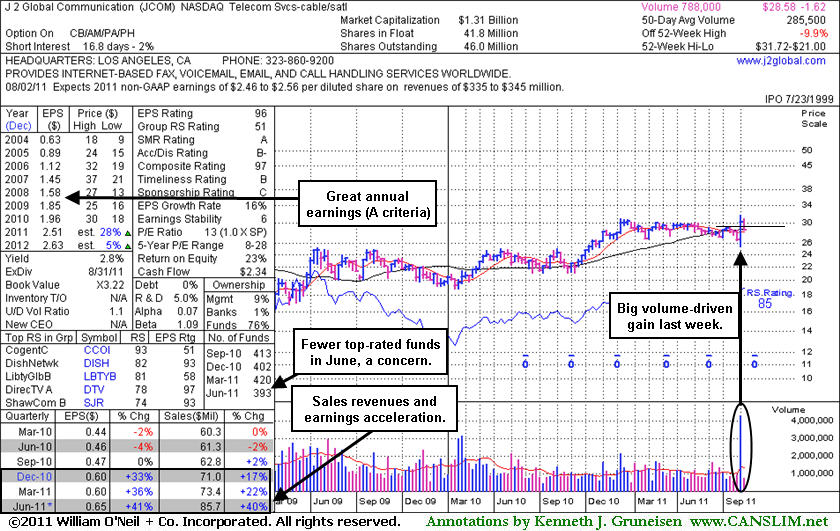
J 2 Global Communication (JCOM -$1.62 or -5.36% to $28.58) finished the session with a loss after a worrisome negative reversal leading to a close back below its pivot point. It has no overhead supply remaining to act as resistance, but the negative backdrop of the broader market (M criteria) bodes poorly for most stocks. Its color code was changed to yellow in today's mid-day report with an annotated daily graph (read here) showing a pivot point based on its 7/07/11 high after a "double bottom" type base.
Technically JCOM has been enduring distributional pressure near previously stubborn resistance in the $30 area since gapping up on 8/03/11 from below its 50-day moving average (DMA) and 200 DMA lines. The 3 latest quarterly comparisons through June '11 show sales revenues and earnings acceleration and the high-ranked Telecom Services - Cable/Satellite firm has a strong annual earnings history, satisfying the C and A criteria. The weekly graph below is packed with a lot of additional data. One concern we have highlighted is the waning ownership by top-rated funds, falling from 420 in Mar '11 to 393 in June '11. Normally, increasing interest from top-rated funds is preferred with respect to the I criteria.
|
|
|
Color Codes Explained :
Y - Better candidates highlighted by our
staff of experts.
G - Previously featured
in past reports as yellow but may no longer be buyable under the
guidelines.
***Last / Change / Volume data in this table is the closing quote data***
Symbol/Exchange
Company Name
Industry Group |
PRICE |
CHANGE
(%Change) |
Day High |
Volume
(% DAV)
(% 50 day avg vol) |
52 Wk Hi
% From Hi |
Featured
Date |
Price
Featured |
Pivot Featured |
|
Max Buy |
ATHN
-
NASDAQ
Athenahealth Inc
DIVERSIFIED SERVICES - Business/Management Services
|
$48.69
|
-5.00
-9.31% |
$52.80
|
1,173,628
213.58% of 50 DAV
50 DAV is 549,500
|
$61.78
-21.19%
|
7/22/2011
|
$57.30
|
PP = $50.66
|
|
MB = $53.19
|
 Most Recent Note - 8/8/2011 4:50:39 PM
Gapped down for another considerable loss today, violating prior highs in the $50 area that were noted as important chart support. Due to its technical deterioration more than -21% off its high it will be dropped from the Featured Stocks list tonight.
>>> The latest Featured Stock Update with an annotated graph appeared on 7/27/2011. Click here.
View all notes |
Alert me of new notes |
CANSLIM.net Company Profile |
SEC |
Zacks Reports |
StockTalk |
News |
Chart |
Request a new note
C
A N
S L
I M


|
EXLS
-
NASDAQ
Exlservice Holdings Inc
DIVERSIFIED SERVICES - Business/Management Services
|
$25.28
|
-0.60
-2.32% |
$26.00
|
309,563
441.60% of 50 DAV
50 DAV is 70,100
|
$26.46
-4.46%
|
8/2/2011
|
$24.85
|
PP = $24.85
|
|
MB = $26.09
|
Most Recent Note - 8/8/2011 11:58:34 AM
Y - Stubbornly holding its ground against a severely negative market backdrop. After featured in the 8/02/11 mid-day report its 8/03/11 gain triggered a technical buy signal with +170% above average volume behind its gain. The M criteria urges extreme caution, however, since 3 out of 4 stocks generally go along with the broader market averages.
>>> The latest Featured Stock Update with an annotated graph appeared on 8/2/2011. Click here.
View all notes |
Alert me of new notes |
CANSLIM.net Company Profile |
SEC |
Zacks Reports |
StockTalk |
News |
Chart |
Request a new note
C
A N
S L
I M
|
FCFS
-
NASDAQ
First Cash Financial Svs
SPECIALTY RETAIL - Specialty Retail, Other
|
$39.98
|
-1.94
-4.63% |
$41.95
|
762,930
327.72% of 50 DAV
50 DAV is 232,800
|
$46.42
-13.87%
|
5/31/2011
|
$42.00
|
PP = $40.23
|
|
MB = $42.24
|
Most Recent Note - 8/8/2011 5:02:39 PM
G - More worrisome distributional pressure today led to a 50 DMA line violation and it closed at the session low. It slumped near prior resistance in the $40 area.
>>> The latest Featured Stock Update with an annotated graph appeared on 7/18/2011. Click here.
View all notes |
Alert me of new notes |
CANSLIM.net Company Profile |
SEC |
Zacks Reports |
StockTalk |
News |
Chart |
Request a new note
C
A N
S L
I M
|
JCOM
-
NASDAQ
J 2 Global Communication
INTERNET - Internet Software and Services
|
$28.58
|
-1.62
-5.36% |
$31.01
|
804,086
281.64% of 50 DAV
50 DAV is 285,500
|
$31.72
-9.90%
|
8/8/2011
|
$30.38
|
PP = $29.31
|
|
MB = $30.78
|
Most Recent Note - 8/8/2011 6:48:31 PM
Y - No overhead supply remains to act as resistance, but the negative market (M criteria) contributed to a negative reversal today. Color code was changed to yellow with pivot point based on its 7/07/11 high after a double bottom type base. Technically it has been enduring distributional pressure near previously stubborn resistance in the $30 area since gapping up on 8/03/11 from below its 50 and 200 DMA lines. The 3 latest quarterly comparisons through June '11 show sales revenues and earnings acceleration and has a strong annual earnings, satisfying the C and A criteria. See the latest FSU analysis for an annotated weekly graph after the daily graph annotated below.

>>> The latest Featured Stock Update with an annotated graph appeared on 8/8/2011. Click here.
View all notes |
Alert me of new notes |
CANSLIM.net Company Profile |
SEC |
Zacks Reports |
StockTalk |
News |
Chart |
Request a new note
C
A N
S L
I M
|
MA
-
NYSE
Mastercard Inc Cl A
DIVERSIFIED SERVICES - Business/Management Services
|
$291.96
|
-34.58
-10.59% |
$322.30
|
2,869,358
218.25% of 50 DAV
50 DAV is 1,314,700
|
$340.42
-14.24%
|
8/3/2011
|
$324.82
|
PP = $322.38
|
|
MB = $338.50
|
Most Recent Note - 8/8/2011 4:55:26 PM
G - Gapped down and suffered a considerable loss today on higher volume, violating its 50 DMA line and triggering a technical sell signal. Color code is changed to green after quickly negating its considerable 8/03/11 gap up gain and closing deep in its prior base, promptly negating the powerful technical breakout.
>>> The latest Featured Stock Update with an annotated graph appeared on 8/3/2011. Click here.
View all notes |
Alert me of new notes |
CANSLIM.net Company Profile |
SEC |
Zacks Reports |
StockTalk |
News |
Chart |
Request a new note
C
A N
S L
I M
|
Symbol/Exchange
Company Name
Industry Group |
PRICE |
CHANGE
(%Change) |
Day High |
Volume
(% DAV)
(% 50 day avg vol) |
52 Wk Hi
% From Hi |
Featured
Date |
Price
Featured |
Pivot Featured |
|
Max Buy |
MKTX
-
NASDAQ
Marketaxess Holdings Inc
FINANCIAL SERVICES - Investment Brokerage - Nationa
|
$23.41
|
-2.31
-8.98% |
$26.06
|
359,782
210.28% of 50 DAV
50 DAV is 171,100
|
$27.21
-13.97%
|
7/29/2011
|
$25.87
|
PP = $26.35
|
|
MB = $27.67
|
Most Recent Note - 8/8/2011 4:57:41 PM
G - Violated its 50 DMA line and triggered a technical sell signal with today's damaging loss. Color code is changed to green after damaging distributional pressure raised concerns.
>>> The latest Featured Stock Update with an annotated graph appeared on 7/29/2011. Click here.
View all notes |
Alert me of new notes |
CANSLIM.net Company Profile |
SEC |
Zacks Reports |
StockTalk |
News |
Chart |
Request a new note
C
A N
S L
I M
|
PCLN
-
NASDAQ
Priceline.Com Inc
INTERNET - Internet Software and Services
|
$505.00
|
-22.81
-4.32% |
$523.49
|
2,461,560
234.81% of 50 DAV
50 DAV is 1,048,300
|
$561.88
-10.12%
|
7/29/2011
|
$539.46
|
PP = $552.15
|
|
MB = $579.76
|
Most Recent Note - 8/8/2011 4:58:59 PM
G - Down with above average volume and closing below its 50 DMA line today, raising concerns. The M criteria overrides all other promising criteria, since 3 out of 4 stocks follow the direction of the major averages.
>>> The latest Featured Stock Update with an annotated graph appeared on 8/1/2011. Click here.
View all notes |
Alert me of new notes |
CANSLIM.net Company Profile |
SEC |
Zacks Reports |
StockTalk |
News |
Chart |
Request a new note
C
A N
S L
I M
|
PRGO
-
NASDAQ
Perrigo Co
DRUGS - Drug Related Products
|
$77.19
|
-4.84
-5.90% |
$80.45
|
1,217,032
241.81% of 50 DAV
50 DAV is 503,300
|
$94.61
-18.41%
|
7/13/2011
|
$92.89
|
PP = $92.40
|
|
MB = $97.02
|
Most Recent Note - 8/8/2011 4:59:53 PM
Today it gapped down under prior lows near $81 and tested its 200 DMA line, closing -18% off its high. Based on its weak technical action it will be dropped from the Featured Stocks list tonight.
>>> The latest Featured Stock Update with an annotated graph appeared on 7/13/2011. Click here.
View all notes |
Alert me of new notes |
CANSLIM.net Company Profile |
SEC |
Zacks Reports |
StockTalk |
News |
Chart |
Request a new note
C
A N
S L
I M
|
PSMT
-
NASDAQ
Pricesmart Inc
RETAIL - Drug Stores
|
$52.20
|
-5.77
-9.95% |
$57.80
|
365,908
151.01% of 50 DAV
50 DAV is 242,300
|
$62.27
-16.17%
|
7/22/2011
|
$60.04
|
PP = $61.14
|
|
MB = $64.20
|
Most Recent Note - 8/8/2011 4:47:42 PM
Considerable loss today undercutting prior chart lows and slumping to its 50 DMA line. That important short-term average may act as support, but based on weak action it now faces overhead supply up through $62. PSMT will be dropped from the Featured Stocks list tonight.
>>> The latest Featured Stock Update with an annotated graph appeared on 7/22/2011. Click here.
View all notes |
Alert me of new notes |
CANSLIM.net Company Profile |
SEC |
Zacks Reports |
StockTalk |
News |
Chart |
Request a new note
C
A N
S L
I M
|
|
|
|
THESE ARE NOT BUY RECOMMENDATIONS!
Comments contained in the body of this report are technical
opinions only. The material herein has been obtained
from sources believed to be reliable and accurate, however,
its accuracy and completeness cannot be guaranteed.
This site is not an investment advisor, hence it does
not endorse or recommend any securities or other investments.
Any recommendation contained in this report may not
be suitable for all investors and it is not to be deemed
an offer or solicitation on our part with respect to
the purchase or sale of any securities. All trademarks,
service marks and trade names appearing in this report
are the property of their respective owners, and are
likewise used for identification purposes only.
This report is a service available
only to active Paid Premium Members.
You may opt-out of receiving report notifications
at any time. Questions or comments may be submitted
by writing to Premium Membership Services 665 S.E. 10 Street, Suite 201 Deerfield Beach, FL 33441-5634 or by calling 1-800-965-8307
or 954-785-1121.
|
|
|

