You are not logged in.
This means
you CAN ONLY VIEW reports that were published prior to Monday, April 14, 2025.
You
MUST UPGRADE YOUR MEMBERSHIP if you want to see any current reports.
 MIDDAY BREAKOUTS REPORT - MONDAY, AUGUST 8TH, 2011 MIDDAY BREAKOUTS REPORT - MONDAY, AUGUST 8TH, 2011
Previous Mid Day Report Next Mid Day Report >>>
|
|
DOW 11104.3 -340.01 (-2.97%) | NASDAQ 2439.44 -93.17 (-3.68%) | S&P 500 1153.72 -45.66 (-3.81%)
|
Time of Screening :
8/8/2011 11:47:03 AM Report Released :
8/8/2011 12:53:40 PM
Price is:
Above 52W High and Less Than 52W High
but within 10% of the 52 Week High
Volume Is:
At least 57.5% of 50 Day Average at
the time of the screening.
More details about this report...
At around
mid-way through each trading day we run
a screen against our database of
high-ranked stocks, searching for
possible buy candidates that are trading
at or near their 52-week high on above
average volume. The results of that
screen are split into the two sections
you see below. The first, titled
"TODAY's FEATURED STOCKS" shows stocks
that our experts have recently
identified as among the strongest candidates to
consider. Stocks highlighted in yellow
are the most timely and noteworthy, so
particular attention and prompt action
may be appropriate. The second section,
titled "TODAY's BREAKOUT SCREEN" shows
the remainder of stocks meeting today's
screen parameters. Our experts have
reviewed and included notes on these
stocks as well, but found that they may
not match up as favorably.
|
|
Y - Today's strongest
candidates
highlighted
by our staff
of experts.
|
|
G - Previously featured in
this report as yellow and
now may no longer be buyable
under the guidelines.
|
|
|
Symbol/Exchange
Company Name
Industry Group |
PRICE |
CHANGE
(%Change) |
Day High |
Volume
(% DAV)
(50 DAV) |
52 Wk Hi
% From Hi |
Date
Featured |
Price
Featured |
Pivot Point |
|
Max Buy |
EXLS
- NASDAQ
Exlservice Holdings Inc
|
$25.76
|
-0.12
-0.46%
|
$26.00
|
144,814
206.58% of 50 DAV
50 DAV is 70,100
|
$26.46
-2.65%
|
8/2/2011 |
$24.85
|
PP = $24.85
MB = $26.09 |
Most Recent Note - 8/8/2011 11:58:34 AM
Y - Stubbornly holding its ground against a severely negative market backdrop. After featured in the 8/02/11 mid-day report its 8/03/11 gain triggered a technical buy signal with +170% above average volume behind its gain. The M criteria urges extreme caution, however, since 3 out of 4 stocks generally go along with the broader market averages.
>>> The latest Featured Stock Update with an annotated graph appeared on 8/2/2011. Click here.
|
|
View all notes |
Alert me of new notes |
Company Profile |
SEC |
News |
Chart | C
A N
S L
I M
|
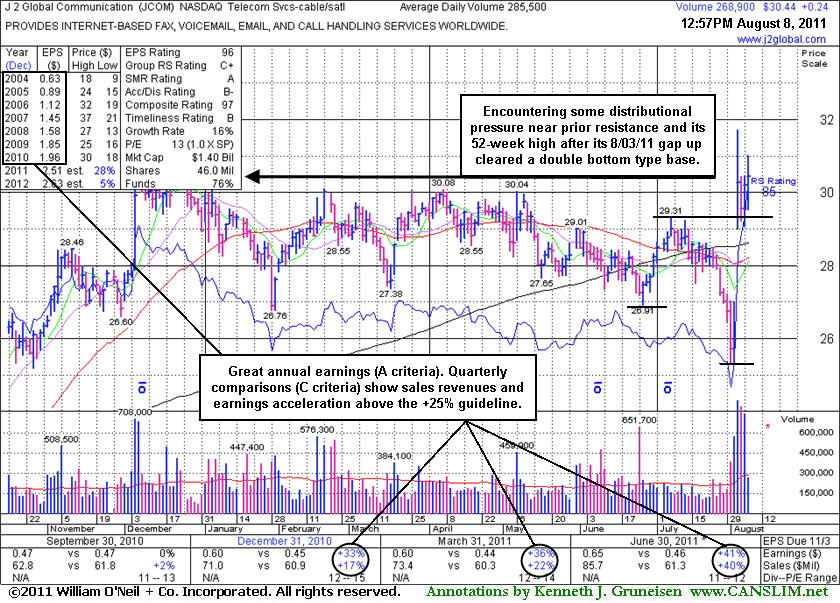
JCOM
- NASDAQ
J 2 Global Inc
|
$30.38
|
+0.18
0.60%
|
$31.01
|
213,200
74.68% of 50 DAV
50 DAV is 285,500
|
$31.72
-4.22%
|
8/8/2011 |
$30.38
|
PP = $29.31
MB = $30.78 |
Most Recent Note - 8/8/2011
Y - No overhead supply remains to act as resistance. Color code is changed to yellow with pivot point based on its 7/07/11 high after a double bottom type base. Technically it has been enduring distributional pressure near previously stubborn resistance in the $30 area since gapping up on 8/03/11 from below its 50 and 200 DMA lines. The 3 latest quarterly comparisons through June '11 show sales revenues and earnings acceleration and has a strong annual earnings, satisfying the C and A criteria.
There are no Featured Stock Updates™ available for this stock at this time. You may request one by clicking the Request a New Note link below
|
|
View all notes |
Alert me of new notes |
Company Profile |
SEC |
News |
Chart | C
A N
S L
I M
|
MKTX
- NASDAQ
Marketaxess Holdings Inc
|
$25.54
|
-0.18
-0.70%
|
$26.06
|
116,612
68.15% of 50 DAV
50 DAV is 171,100
|
$27.21
-6.14%
|
7/29/2011 |
$25.87
|
PP = $26.35
MB = $27.67 |
Most Recent Note - 8/8/2011 12:25:14 PM
Y - Rebounded to the middle of its intra-day range after early weakness today tested its 50 DMA line and briefly undercut last week's low. Concerns were raised after slumping back below its pivot point following distributional pressure. Its 8/03/11 gain with only +25% above average volume was below the volume threshold for a proper technical buy signal.
>>> The latest Featured Stock Update with an annotated graph appeared on 7/29/2011. Click here.
|
|
View all notes |
Alert me of new notes |
Company Profile |
SEC |
News |
Chart | C
A N
S L
I M
|
PCLN
- NASDAQ
Priceline.com Inc
|
$517.00
|
-10.81
-2.05%
|
$523.49
|
1,062,333
101.34% of 50 DAV
50 DAV is 1,048,300
|
$561.88
-7.99%
|
7/29/2011 |
$539.46
|
PP = $552.15
MB = $579.76 |
Most Recent Note - 8/8/2011 12:27:19 PM
G - Holding its ground just above its 50 DMA line today. Gapped up on 8/05/11 after reporting earnings +78% on +44% sales revenues for the quarter ended June 30, 2011 versus the year ago period. Promptly repaired its 50 DMA line violation, but it faces resistance at prior chart highs. The M criteria overrides all other promising criteria, since 3 out of 4 stocks follow the direction of the major averages.
>>> The latest Featured Stock Update with an annotated graph appeared on 8/1/2011. Click here.
|
|
View all notes |
Alert me of new notes |
Company Profile |
SEC |
News |
Chart | C
A N
S L
I M
|
|
 |
Symbol - Exchange - Industry Group
Company Name |
Last |
Chg |
Day
High |
52 WK Hi |
% From Hi |
Volume
% DAV |
DAV |
AUY
- NYSE - METALS & MINING - Gold
Yamana Gold Inc
|
$13.89 |
+0.67
5.07%
|
$13.90
|
$14.42
|
-3.68% |
9,787,209
109.65%
|
8,926,200
|
Most Recent Note for AUY - 8/8/2011 11:52:20 AM
Gain today has it poised for its best close of the year with no resistance remaining due to overhead supply. Quarterly sales revenues and earnings increases in the 4 latest comparisons through June 30, 2011 were well above the +25% guideline satisfying the C criteria. The downturn in FY '09 earnings is a fundamental flaw concerning the A criteria. With respect to the I criteria, the number of top rated funds owning its shares fell from 906 in Mar '11 to 860 in Jun '11. It survived but failed to impress since 4/23/2008 when it was dropped from the Featured Stocks list and subsequently fell from $13 to $3 over the next 6 months. First it had traded up as much as +25.4% after it was first featured at $15.89 in the February 2008 CANSLIM.net News (read here).
|
|
View all notes |
Alert me of new notes |
Company Profile |
SEC |
News |
Chart | C
A N
S L
I M
|
BLX
- NYSE - BANKING - Foreign Regional Banks
Banco Latinoamericano C
|
$17.23 |
-0.53
-2.98%
|
$17.69
|
$19.05
|
-9.55% |
85,590
74.88%
|
114,300
|
Most Recent Note for BLX - 8/8/2011 11:55:46 AM
Slumping below its nearby 50 and 200 DMA lines today and trading near prior lows in the $16.50 area that may act as support. When challenging its 52-week high it was last noted in the 8/02/11 mid-day report - "It has formed an orderly 7-month flat base during which it found support at its 200 DMA line. Recent quarterly comparisons showed strong sales revenues and earning increases but its up and down annual earnings (A criteria) is a concern."
|
|
View all notes |
Alert me of new notes |
Company Profile |
SEC |
News |
Chart | C
A N
S L
I M
|
ECOL
- NASDAQ - MATERIALS & CONSTRUCTION - Waste Management
U S Ecology Inc
|
$17.52 |
-0.17
-0.96%
|
$17.99
|
$18.85
|
-7.06% |
84,272
139.29%
|
60,500
|
Most Recent Note for ECOL - 8/8/2011 11:57:22 AM
The 8/05/11 mid-day report noted - "The 3 latest quarterly comparisons through Jun '11 showed strong sales and earnings increases, but its prior quarterly and annual earnings (A criteria) history has been below the investment system guidelines."
|
|
View all notes |
Alert me of new notes |
Company Profile |
SEC |
News |
Chart | C
A N
S L
I M
|
HRL
- NYSE - FOOD & BEVERAGE - Meat Products
Hormel Foods Co
|
$27.45 |
-0.47
-1.68%
|
$27.73
|
$30.50
|
-10.00% |
654,066
57.75%
|
1,132,600
|
Most Recent Note for HRL - 8/8/2011 12:00:49 PM
Testing support at its 200 DMA line. Quarterly and annual earnings history (C and A criteria) are below guidelines of the fact-based investment system.
|
|
View all notes |
Alert me of new notes |
Company Profile |
SEC |
News |
Chart | C
A N
S L
I M
|
HURN
- NASDAQ - DIVERSIFIED SERVICES - Business/Management Services
Huron Consulting Grp Inc
|
$31.17 |
-0.99
-3.08%
|
$32.16
|
$34.50
|
-9.65% |
94,850
70.31%
|
134,900
|
Most Recent Note for HURN - 8/8/2011 12:01:36 PM
Earnings history is below the guidelines of the fact-based system. It survived but failed to impress since dropped from the Featured Stocks list on 8/15/2007.
|
|
View all notes |
Alert me of new notes |
Company Profile |
SEC |
News |
Chart | C
A N
S L
I M
|
IBM
- NYSE - COMPUTER HARDWARE - Diversified Computer Systems
Intl Business Machines
|
$170.20 |
-2.03
-1.18%
|
$172.61
|
$185.63
|
-8.31% |
5,353,655
96.12%
|
5,569,800
|
Most Recent Note for IBM - 8/8/2011 12:04:22 PM
Consolidating -8.4% from its all-time high and slumping below its 50 DMA line today. Reported earnings +18% on +12% sales revenues for the quarter ended June 30, 2011 versus the year ago period, and prior mid-day reports noted - "Quarterly sales revenues and earnings increases have not met the investment system guidelines. It has maintained a solid annual earnings (A criteria) history since it was dropped from the Featured Stocks list on 9/05/08. Earnings growth has been slow and steady in the +13-18% range in quarterly comparisons versus the year ago period, however sales revenue growth in prior periods has been in the +2-8% range, farther below guidelines."
|
|
View all notes |
Alert me of new notes |
Company Profile |
SEC |
News |
Chart | C
A N
S L
I M
|
MCD
- NYSE - LEISURE - Restaurants
Mcdonalds Corp
|
$83.11 |
-1.97
-2.32%
|
$84.94
|
$89.57
|
-7.21% |
5,365,590
87.62%
|
6,124,000
|
Most Recent Note for MCD - 8/8/2011 12:19:55 PM
The global burger giant's stock is viewed as a "safe haven" and longtime favorite for some institutional investors, however, with 1.04 billion shares outstanding it is unlikely to be a sprinter capable of many-fold price increases. Earnings increases in the quarterly comparisons have not met the +25% minimum guideline, and sales revenues increases have been sub par.
|
|
View all notes |
Alert me of new notes |
Company Profile |
SEC |
News |
Chart | C
A N
S L
I M
|
PM
- NYSE - CONSUMER NON-DURABLES - Tobacco Products
Philip Morris Intl Inc
|
$68.12 |
-1.23
-1.77%
|
$69.17
|
$72.74
|
-6.35% |
4,734,102
69.76%
|
6,786,200
|
Most Recent Note for PM - 8/8/2011 12:32:02 PM
Trading back and forth above and below its 50 DMA line since last noted in the 5/03/11 mid-day report - "Hitting new all-time highs. Quarterly comparisons show sales and earnings increases below the fact-based investment system's guidelines."
|
|
View all notes |
Alert me of new notes |
Company Profile |
SEC |
News |
Chart | C
A N
S L
I M
|
RGLD
- NASDAQ - METALS & MINING - Gold
Royal Gold Inc
|
$68.53 |
+1.99
2.99%
|
$68.69
|
$70.86
|
-3.29% |
552,982
88.85%
|
622,400
|
Most Recent Note for RGLD - 8/8/2011 12:34:57 PM
Trading wider than usual intra-day price swings during the past week while spiking to new 52-week and all-time highs. No resistance remains to hinder its progress. Prior mid-day reports noted - "Its up and down annual earnings (A criteria) history does not meet the investment system guidelines, but recent quarterly comparisons showed mostly strong sales revenues and earnings increases versus the year ago period."
|
|
View all notes |
Alert me of new notes |
Company Profile |
SEC |
News |
Chart | C
A N
S L
I M
|
STMP
- NASDAQ - Retail-Internet
Stamps.com Inc
|
$17.21 |
-0.20
-1.15%
|
$17.74
|
$17.88
|
-3.75% |
69,684
78.56%
|
88,700
|
Most Recent Note for STMP - 8/8/2011 12:39:02 PM
Pulling back today after holding its ground stubbornly following previously noted volume-driven gains. Its considerable breakaway gap up on 7/29/11 for a new 52-week high, technically cleared a long base pattern, and it was noted in the mid-day report - "Earnings increased by +125% on +26% sales revenues for the quarter ended June 30, 2011. Showing impressive sequential acceleration in recent quarterly comparisons, but prior quarterly comparisons showed lackluster sales revenues increases well below the +25% guideline, leaving some fundamental concerns."
|
|
View all notes |
Alert me of new notes |
Company Profile |
SEC |
News |
Chart | C
A N
S L
I M
|
TNH
- NYSE - CHEMICALS - Agricultural Chemicals
Terra Nitrogen Co Lp
|
$152.05 |
-8.45
-5.26%
|
$155.95
|
$167.83
|
-9.40% |
85,058
125.27%
|
67,900
|
Most Recent Note for TNH - 8/8/2011 12:42:53 PM
Wider than usual intra-day price swings indicate recent uncertainty after repeatedly noted as extended from any sound base pattern. Reported earnings +78% on +19% sales revenues for the quarter ended June 30, 2011 versus the year ago period and recent quarters were strong, but its up and down annual earnings (questionable A) history remains a fundamental concern. There is a small supply of only 4.26 million shares in its float, which can contribute to greater price volatility in the event of institutional buying or selling.
|
|
View all notes |
Alert me of new notes |
Company Profile |
SEC |
News |
Chart | C
A N
S L
I M
|
UL
- NYSE - FOOD & BEVERAGE - Food - Major Diversified
Unilever Plc
|
$31.67 |
-1.16
-3.53%
|
$32.04
|
$33.40
|
-5.18% |
1,959,381
139.00%
|
1,409,600
|
Most Recent Note for UL - 8/8/2011 12:45:05 PM
Gapped down today, slumping below its 50 DMA line. Annual and quarterly earnings history have been below guidelines.
|
|
View all notes |
Alert me of new notes |
Company Profile |
SEC |
News |
Chart | C
A N
S L
I M
|
UN
- NYSE - FOOD & BEVERAGE - Food - Major Diversified
Unilever N V Ny Shrs
|
$31.87 |
-1.09
-3.31%
|
$32.16
|
$33.76
|
-5.60% |
3,706,951
156.10%
|
2,374,700
|
Most Recent Note for UN - 8/8/2011 12:47:00 PM
Gapped down today, slumping below its 50 DMA line. Annual and quarterly earnings history have been below guidelines.
|
|
View all notes |
Alert me of new notes |
Company Profile |
SEC |
News |
Chart | C
A N
S L
I M
|
VASC
- NASDAQ - HEALTH SERVICES - Medical Instruments & Supplies
Vascular Solutions
|
$12.67 |
-0.42
-3.19%
|
$13.01
|
$13.75
|
-7.84% |
32,392
58.36%
|
55,500
|
Most Recent Note for VASC - 8/8/2011 12:52:32 PM
Gapped down today, pulling back from its 52-week high hit last week. Annual earnings (A criteria) history has been good. The 2 latest quarterly comparisons versus the year ago period showed sales revenues increases in the +14-17% range with earnings per share increases in the +25-44% range. Ownership by top-rated funds fell from 124 in Dec '10 to 116 in Jun '11, whereas increasing institutional interest (I criteria) is clearly desired.
|
|
View all notes |
Alert me of new notes |
Company Profile |
SEC |
News |
Chart | C
A N
S L
I M
|
|
|
|
THESE ARE NOT BUY RECOMMENDATIONS!
Comments contained in the body of this report are technical
opinions only. The material herein has been obtained
from sources believed to be reliable and accurate, however,
its accuracy and completeness cannot be guaranteed.
We are not an investment advisor, hence it does
not endorse or recommend any securities or other investments.
Any recommendation contained in this report may not
be suitable for all investors and it is not to be deemed
an offer or solicitation on our part with respect to
the purchase or sale of any securities. All trademarks,
service marks and trade names appearing in this report
are the property of their respective owners, and are
likewise used for identification purposes only.
This report is a service available
only to active Paid Premium Members.
You may opt-out of receiving report notifications
at any time. Questions or comments may be submitted
by writing to FactBasedInvesting.com c/o Premium
Member Services 665 S.E. 10 Street, Suite 201
Deerfield Beach, FL 33441-5634 or by calling 954-785-1121.
We appreciate any feedback
members may wish to send via the inquiry form
here.
|
|
|


