You are not logged in.
This means you
CAN ONLY VIEW reports that were published prior to Tuesday, April 15, 2025.
You
MUST UPGRADE YOUR MEMBERSHIP if you want to see any current reports.
AFTER MARKET UPDATE - THURSDAY, AUGUST 4TH, 2011
Previous After Market Report Next After Market Report >>>
|
|
|
|
DOW |
-512.76 |
11,383.68 |
-4.31% |
|
Volume |
1,821,309,860 |
+35% |
|
Volume |
3,221,784,300 |
+27% |
|
NASDAQ |
-136.68 |
2,556.39 |
-5.08% |
|
Advancers |
151 |
5% |
|
Advancers |
209 |
8% |
|
S&P 500 |
-60.27 |
1,200.07 |
-4.78% |
|
Decliners |
2,971 |
94% |
|
Decliners |
2,464 |
91% |
|
Russell 2000 |
-45.98 |
726.80 |
-5.95% |
|
52 Wk Highs |
10 |
|
|
52 Wk Highs |
14 |
|
|
S&P 600 |
-21.81 |
395.87 |
-5.22% |
|
52 Wk Lows |
445 |
|
|
52 Wk Lows |
305 |
|
|
 |
Meltdown For Major Market Averages Gets Worse
Kenneth J. Gruneisen - Passed the CAN SLIM® Master's Exam
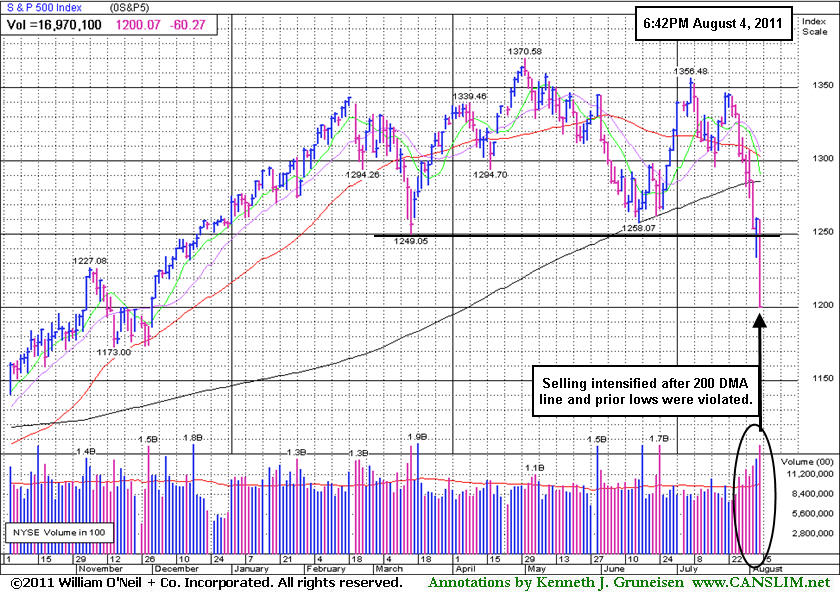
Wall Street got clobbered on Thursday as selling approached intense levels. The S&P 500 Index plunged -4.8%, the biggest one-day percentage drop since 2009. All of the major indices have erased the year's prior gains and abruptly slumped into the red. Volume totals were reported higher than the prior session totals on the NYSE and on the Nasdaq exchange, continuing the previously noted market correction (M criteria) with more distributional selling from the institutional crowd. New 52-week lows substantially outnumbered new 52-week highs on the NYSE and on the Nasdaq exchange. Declining issues overwhelmed advancers by nearly 20-1 on the NYSE and by 12-1 on the Nasdaq exchange. There were 7 high-ranked companies from the CANSLIM.net Leaders List that made new 52-week highs and appeared on the CANSLIM.net BreakOuts Page, down from the prior total of 14 stocks. There were unanimous losses from the 17 high-ranked leaders currently included on the Featured Stocks Page.
Escalating concerns about the U.S. economy and European debt and a series of breaks in technical-support levels contributed to the carnage. European markets sold off sharply as the European Central Bank refused to rule out future rate hikes. The yield on Spanish bonds approached the 7% level that heralded the bailouts of Greece, Portugal and Ireland. The ECB signaled it would offer banks additional cash as the region's debt crisis spreads.
Crude closed below $87 a barrel to wipe out its gains for the year. Energy stocks were the weakest sector as a rally in the US dollar dragged down commodities.The 10-year Treasury note was up more than a point, with the yield falling to 2.42%.
Dow component Exxon Mobil Corp's (XOM -4.99%) loss was tame compared to fellow Dow member Alcoa Inc (AA -9.3%) which was smacked for a considerable loss. Kraft Foods Inc (KFT -1.5%) held up the best on the Dow Industrials after it announced plans to spin off its grocery business. Its shares were up for much of the day before closing down.
The current market correction leaves disciplined investors in a defensive stance, looking toward protecting capital rather than adding more market exposure. A new rally confirmed by a solid follow-through day would be an important reassurance worth waiting for before new buying efforts may be justified. Meanwhile, the indices remain below their respective 200-day moving average (DMA) lines after a well-noted and damaging streak of losses. Fans of the fact-based investment system may recognize the major indices below their 200 DMA lines as a worrisome sign of an "unhealthy" market environment (M criteria).
The August 2011 issue of CANSLIM.net News will be published soon! Links to all prior reports are available on the Premium Member Homepage.
PICTURED: The U.S. benchmark S&P 500 Index has declined more than -12.4% from its 2011 high hit on May 2nd. Prior lows and its 200-day moving average line were abruptly violated. Selling pressure has only intensified following President Obama's signing off on the latest raise to the nation's debt ceiling.
|
 Kenneth J. Gruneisen started out as a licensed stockbroker in August 1987, a couple of months prior to the historic stock market crash that took the Dow Jones Industrial Average down -22.6% in a single day. He has published daily fact-based fundamental and technical analysis on high-ranked stocks online for two decades. Through FACTBASEDINVESTING.COM, Kenneth provides educational articles, news, market commentary, and other information regarding proven investment systems that work in good times and bad.
Comments contained in the body of this report are technical opinions only and are not necessarily those of Gruneisen Growth Corp. The material herein has been obtained from sources believed to be reliable and accurate, however, its accuracy and completeness cannot be guaranteed. Our firm, employees, and customers may effect transactions, including transactions contrary to any recommendation herein, or have positions in the securities mentioned herein or options with respect thereto. Any recommendation contained in this report may not be suitable for all investors and it is not to be deemed an offer or solicitation on our part with respect to the purchase or sale of any securities. |
|
 |
Large and Widespread Losses Weigh Down All Groups
Kenneth J. Gruneisen - Passed the CAN SLIM® Master's Exam
Large losses were widespread and no industry groups benefited from Thursday's worrisome downdraft. The Biotechnology Index ($BTK -10.61%) led the tech sector's losses while the Networking Index ($NWX -6.35%), Semiconductor Index ($SOX -5.82%), and Internet Index ($IIX -5.30%) collectively fell hard. The Oil Services Index ($OSX -8.58%) and Integrated Oil Index ($XOI -6.79%) were smacked with large losses along with the Gold & Silver Index ($XAU -6.04%). The Broker/Dealer Index ($XBD -5.64%) and Bank Index ($BKX -5.30%) had no backbone, and the Retail Index ($RLX -4.47%) was also a negative influence. The Healthcare Index ($HMO -5.37%) also continued to quickly erase the year's previous big gains.
Charts courtesy www.stockcharts.com
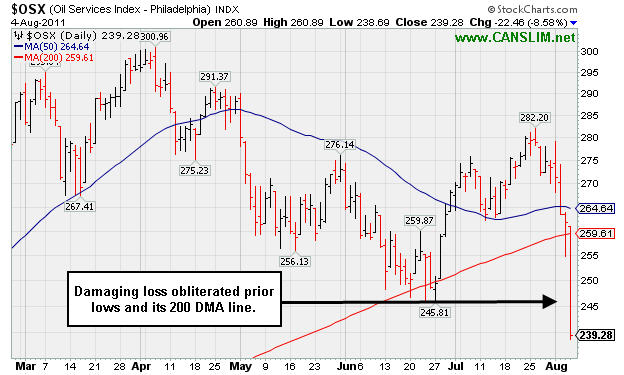
PICTURED: The Oil Services Index ($OSX -8.58%)suffered a damaging loss that obliterated the prior lows and its 200-day moving average (DMA) line.
| Oil Services |
$OSX |
239.28 |
-22.46 |
-8.58% |
-2.38% |
| Healthcare |
$HMO |
1,933.86 |
-109.76 |
-5.37% |
+14.29% |
| Integrated Oil |
$XOI |
1,151.53 |
-83.91 |
-6.79% |
-5.08% |
| Semiconductor |
$SOX |
357.32 |
-22.07 |
-5.82% |
-13.23% |
| Networking |
$NWX |
237.36 |
-16.08 |
-6.35% |
-15.40% |
| Internet |
$IIX |
282.90 |
-15.83 |
-5.30% |
-8.07% |
| Broker/Dealer |
$XBD |
96.90 |
-5.79 |
-5.64% |
-20.25% |
| Retail |
$RLX |
492.68 |
-23.04 |
-4.47% |
-3.09% |
| Gold & Silver |
$XAU |
197.12 |
-12.68 |
-6.04% |
-13.00% |
| Bank |
$BKX |
42.34 |
-2.37 |
-5.30% |
-18.90% |
| Biotech |
$BTK |
1,144.93 |
-135.86 |
-10.61% |
-11.77% |
|
|
|
 |
Profit Should Be Protected After Featured Stock Produced Great Gains
Kenneth J. Gruneisen - Passed the CAN SLIM® Master's Exam
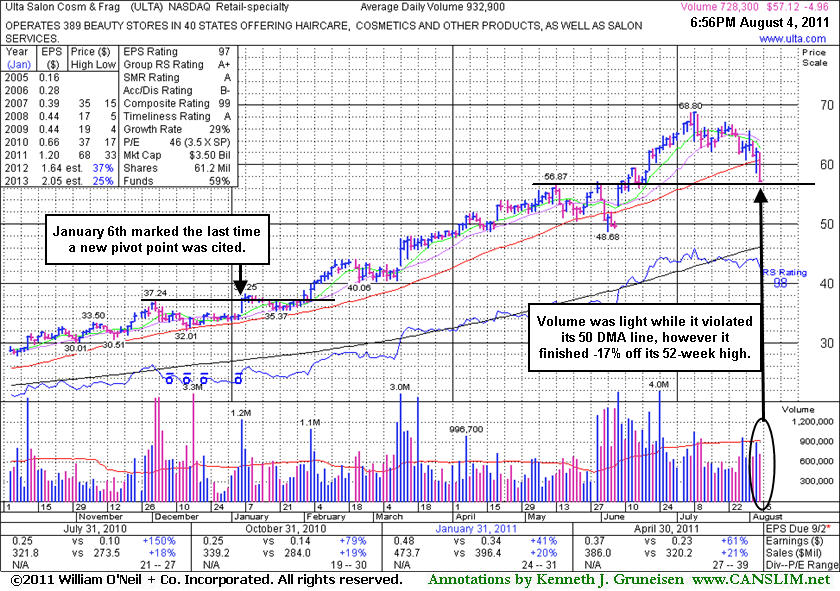
Ulta Salon Cosmetics & Fragrance, Inc. (ULTA -$4.96 or -7.99% to $57.12) closed near the session low today with a loss on below average volume. The damaging loss violated its 50-day moving average (DMA) line, raising concerns and triggering a technical sell signal. It will be dropped from the Featured Stocks list tonight. Typically after any Featured Stock has slumped -16% or more off its high it is dropped from the Featured Stocks list because technical damage has occurred. If a subsequent base forms they may be featured again in the future with a new pivot point cited. Its last appearance in this FSU section was on 7/14/11 with analysis and an annotated graph under the headline, "Quietly Pulling Back, But Extended From Any Sound Base".
Since first featured in yellow in the 3/12/10 mid-day report at $22.81 and (read here) and in a more detailed Stock Bulletin later that afternoon under the headline "Strong Earnings Increases Help Leader Meet Key Criteria", in just over 16 months it traded up as much as +200%. Its choppy ascent did not allow a sound base to be noted since the last time a pivot point was cited when it was rallying on January 6, 2011. Recent highs that were a resistance level may act as support, however the overwhelmingly negative market (M criteria) is an urgent call for investors to protect profits rather than ride it out. The number of top-rated funds with an ownership interest has grown from 274 funds in Mar '10 to 472 funds as of Jun '11 which is an encouraging sign of increasing institutional interest (the I criteria). Management's 25% ownership stake (after the latest offering) still keeps the company's directors very motivated to look after and build shareholder value. Its strong quarterly earnings increases above the +25% guideline in the 8 latest comparisons satisfies the C criteria, and its solid annual earnings (A criteria) history is also very reassuring.
 |
|
|
Color Codes Explained :
Y - Better candidates highlighted by our
staff of experts.
G - Previously featured
in past reports as yellow but may no longer be buyable under the
guidelines.
***Last / Change / Volume data in this table is the closing quote data***
Symbol/Exchange
Company Name
Industry Group |
PRICE |
CHANGE
(%Change) |
Day High |
Volume
(% DAV)
(% 50 day avg vol) |
52 Wk Hi
% From Hi |
Featured
Date |
Price
Featured |
Pivot Featured |
|
Max Buy |
ATHN
-
NASDAQ
Athenahealth Inc
DIVERSIFIED SERVICES - Business/Management Services
|
$54.17
|
-5.83
-9.72% |
$59.47
|
1,293,188
248.31% of 50 DAV
50 DAV is 520,800
|
$61.78
-12.32%
|
7/22/2011
|
$57.30
|
PP = $50.66
|
|
MB = $53.19
|
 Most Recent Note - 8/4/2011 5:01:18 PM
G - Down considerably today with above average volume. Prior highs in the $50 area define important chart support after its 7/22/11 breakaway gap.
>>> The latest Featured Stock Update with an annotated graph appeared on 7/27/2011. Click here.
View all notes |
Alert me of new notes |
CANSLIM.net Company Profile |
SEC |
Zacks Reports |
StockTalk |
News |
Chart |
Request a new note
C
A N
S L
I M


|
BIDU
-
NASDAQ
Baidu Inc Ads
INTERNET - Internet Information Providers
|
$143.92
|
-8.51
-5.58% |
$149.59
|
9,647,075
105.99% of 50 DAV
50 DAV is 9,101,600
|
$165.96
-13.28%
|
7/26/2011
|
$164.32
|
PP = $156.14
|
|
MB = $163.95
|
Most Recent Note - 8/4/2011 5:08:39 PM
G - Gapped down today, slumping more than -7% below its pivot point and completely negating its recent breakout by sinking deep into its prior base. Color code is changed to green. Weak market (M criteria) environment is currently a concern, since 3 out of 4 stocks tend to go in the direction of the major averages.
>>> The latest Featured Stock Update with an annotated graph appeared on 7/28/2011. Click here.
View all notes |
Alert me of new notes |
CANSLIM.net Company Profile |
SEC |
Zacks Reports |
StockTalk |
News |
Chart |
Request a new note
C
A N
S L
I M
|
CACC
-
NASDAQ
Credit Acceptance Corp
FINANCIAL SERVICES - Credit Services
|
$75.00
|
-0.67
-0.89% |
$76.15
|
52,119
135.73% of 50 DAV
50 DAV is 38,400
|
$86.87
-13.66%
|
6/2/2011
|
$76.10
|
PP = $82.39
|
|
MB = $86.51
|
Most Recent Note - 8/4/2011 5:12:00 PM
G - Down slightly more today after a gap down and damaging loss on heavy volume, triggering worrisome technical sell signals while violating the prior chart lows in the $75 area noted as important support. Its 200 DMA line defines the next support near the $70 level.
>>> The latest Featured Stock Update with an annotated graph appeared on 6/27/2011. Click here.
View all notes |
Alert me of new notes |
CANSLIM.net Company Profile |
SEC |
Zacks Reports |
StockTalk |
News |
Chart |
Request a new note
C
A N
S L
I M
|
EXLS
-
NASDAQ
Exlservice Holdings Inc
DIVERSIFIED SERVICES - Business/Management Services
|
$25.89
|
-0.09
-0.35% |
$26.46
|
154,834
234.60% of 50 DAV
50 DAV is 66,000
|
$26.00
-0.42%
|
8/2/2011
|
$24.85
|
PP = $24.85
|
|
MB = $26.09
|
Most Recent Note - 8/4/2011 5:15:31 PM
Y - Held its ground today against a severely negative market backdrop. After featured in the 8/02/11 mid-day report its 8/03/11 gain triggered a technical buy signal with +170% above average volume behind its gain. The M criteria urges extreme caution, however, since 3 out of 4 stocks generally go along with the broader market averages. See the latest FSU analysis for more details and an annotated graph.
>>> The latest Featured Stock Update with an annotated graph appeared on 8/2/2011. Click here.
View all notes |
Alert me of new notes |
CANSLIM.net Company Profile |
SEC |
Zacks Reports |
StockTalk |
News |
Chart |
Request a new note
C
A N
S L
I M
|
FCFS
-
NASDAQ
First Cash Financial Svs
SPECIALTY RETAIL - Specialty Retail, Other
|
$43.13
|
-1.28
-2.88% |
$44.29
|
303,636
137.21% of 50 DAV
50 DAV is 221,300
|
$46.42
-7.09%
|
5/31/2011
|
$42.00
|
PP = $40.23
|
|
MB = $42.24
|
Most Recent Note - 8/4/2011 5:16:54 PM
G - Pulled back today after churning heavy volume without making meaningful price progress earlier this week, which was noted as a sign of distributional pressure. Extended from its prior base, meanwhile recent chart lows and its 50 DMA line define important near-term support to watch in the $41 area.
>>> The latest Featured Stock Update with an annotated graph appeared on 7/18/2011. Click here.
View all notes |
Alert me of new notes |
CANSLIM.net Company Profile |
SEC |
Zacks Reports |
StockTalk |
News |
Chart |
Request a new note
C
A N
S L
I M
|
Symbol/Exchange
Company Name
Industry Group |
PRICE |
CHANGE
(%Change) |
Day High |
Volume
(% DAV)
(% 50 day avg vol) |
52 Wk Hi
% From Hi |
Featured
Date |
Price
Featured |
Pivot Featured |
|
Max Buy |
FOSL
-
NASDAQ
Fossil Inc
CONSUMER DURABLES - Recreational Goods, Other
|
$113.87
|
-9.70
-7.85% |
$122.25
|
1,292,903
179.22% of 50 DAV
50 DAV is 721,400
|
$134.98
-15.64%
|
2/1/2011
|
$73.30
|
PP = $74.44
|
|
MB = $78.16
|
Most Recent Note - 8/4/2011 5:19:04 PM
G - Damaging loss today with above average volume violated its 50 DMA line triggering a technical sell signal. Prior highs in the $107 area are the next important support level to watch if it does not promptly find support near its short-term average.
>>> The latest Featured Stock Update with an annotated graph appeared on 7/21/2011. Click here.
View all notes |
Alert me of new notes |
CANSLIM.net Company Profile |
SEC |
Zacks Reports |
StockTalk |
News |
Chart |
Request a new note
C
A N
S L
I M
|
LULU
-
NASDAQ
Lululemon Athletica
MANUFACTURING - Textile Manufacturing
|
$55.99
|
-4.48
-7.41% |
$59.99
|
4,175,892
100.24% of 50 DAV
50 DAV is 4,165,800
|
$64.49
-13.18%
|
6/21/2011
|
$51.48
|
PP = $50.57
|
|
MB = $53.10
|
Most Recent Note - 8/4/2011 5:21:45 PM
G - Considerable loss today with average volume was a sign of distributional pressure after recent gains lacking volume conviction. Its 50 DMA line and prior resistance in the $51 area define support levels to watch. A 2:1 split effective 7/12/11 impacted prices (prior Featured Price, Pivot Point, and Max Buy levels were adjusted).
>>> The latest Featured Stock Update with an annotated graph appeared on 7/15/2011. Click here.
View all notes |
Alert me of new notes |
CANSLIM.net Company Profile |
SEC |
Zacks Reports |
StockTalk |
News |
Chart |
Request a new note
C
A N
S L
I M
|
MA
-
NYSE
Mastercard Inc Cl A
DIVERSIFIED SERVICES - Business/Management Services
|
$322.60
|
-15.87
-4.69% |
$335.61
|
2,454,375
195.94% of 50 DAV
50 DAV is 1,252,600
|
$340.42
-5.23%
|
8/3/2011
|
$324.82
|
PP = $322.38
|
|
MB = $338.50
|
Most Recent Note - 8/4/2011 5:23:32 PM
Y - Pulled back today with above average volume, slumping to a close near its pivot point and finishing at the session low. The considerable gap up gain on 8/03/11 for a new all-time high after a 4 week consolidation triggered a technical buy signal. The M criteria remains an overriding concern for disciplined investors, arguing against any new buying efforts until a confirmed uptrend in the major averages resumes. See the latest FSU analysis for more details and an annotated graph.
>>> The latest Featured Stock Update with an annotated graph appeared on 8/3/2011. Click here.
View all notes |
Alert me of new notes |
CANSLIM.net Company Profile |
SEC |
Zacks Reports |
StockTalk |
News |
Chart |
Request a new note
C
A N
S L
I M
|
MKTX
-
NASDAQ
Marketaxess Holdings Inc
FINANCIAL SERVICES - Investment Brokerage - Nationa
|
$26.52
|
-0.56
-2.07% |
$27.21
|
313,698
190.24% of 50 DAV
50 DAV is 164,900
|
$27.13
-2.25%
|
7/29/2011
|
$25.87
|
PP = $26.35
|
|
MB = $27.67
|
Most Recent Note - 8/4/2011 5:25:33 PM
Y - Loss today with heavier volume indicated distributional pressure after a gain for a new high on the prior session with only +25% above average volume, below the volume threshold for a proper technical buy signal.
>>> The latest Featured Stock Update with an annotated graph appeared on 7/29/2011. Click here.
View all notes |
Alert me of new notes |
CANSLIM.net Company Profile |
SEC |
Zacks Reports |
StockTalk |
News |
Chart |
Request a new note
C
A N
S L
I M
|
MWIV
-
NASDAQ
M W I Veterinary Supply
HEALTH SERVICES - Medical Instruments and; Supplies
|
$83.10
|
-2.19
-2.57% |
$85.53
|
70,589
110.30% of 50 DAV
50 DAV is 64,000
|
$90.24
-7.91%
|
7/11/2011
|
$83.39
|
PP = $84.67
|
|
MB = $88.90
|
Most Recent Note - 8/4/2011 5:28:43 PM
G - Down today for a 4th consecutive loss, slumping back into its prior base. Its 7/29/11 gain was backed by only +26% above average volume, below the threshold to trigger a proper technical buy signal. A sub par earnings increase (below the +25% guideline) for the June '11 quarter coupled with broader market (M criteria) weakness may give investors reasons to avoid new buying efforts.
>>> The latest Featured Stock Update with an annotated graph appeared on 6/30/2011. Click here.
View all notes |
Alert me of new notes |
CANSLIM.net Company Profile |
SEC |
Zacks Reports |
StockTalk |
News |
Chart |
Request a new note
C
A N
S L
I M
|
Symbol/Exchange
Company Name
Industry Group |
PRICE |
CHANGE
(%Change) |
Day High |
Volume
(% DAV)
(% 50 day avg vol) |
52 Wk Hi
% From Hi |
Featured
Date |
Price
Featured |
Pivot Featured |
|
Max Buy |
OTEX
-
NASDAQ
Open Text Corp
INTERNET - Internet Software and Services
|
$60.27
|
-3.09
-4.88% |
$63.47
|
334,290
117.79% of 50 DAV
50 DAV is 283,800
|
$72.32
-16.66%
|
6/1/2011
|
$65.86
|
PP = $67.18
|
|
MB = $70.54
|
Most Recent Note - 8/4/2011 5:37:15 PM
G - Violated the prior session low with another damaging loss today. Prior lows near $58 define the next support level above its 200 DMA line.
>>> The latest Featured Stock Update with an annotated graph appeared on 7/20/2011. Click here.
View all notes |
Alert me of new notes |
CANSLIM.net Company Profile |
SEC |
Zacks Reports |
StockTalk |
News |
Chart |
Request a new note
C
A N
S L
I M
|
PCLN
-
NASDAQ
Priceline.Com Inc
INTERNET - Internet Software and Services
|
$483.34
|
-38.63
-7.40% |
$519.45
|
3,013,430
313.67% of 50 DAV
50 DAV is 960,700
|
$561.88
-13.98%
|
7/29/2011
|
$539.46
|
PP = $552.15
|
|
MB = $579.76
|
Most Recent Note - 8/4/2011 5:39:08 PM
G - Violated its 50 DMA line today with a damaging loss on heavy volume triggering a technical sell signal. Color code is changed to green. The M criteria overrides all other promising criteria, since 3 out of 4 stocks follow the direction of the major averages.
>>> The latest Featured Stock Update with an annotated graph appeared on 8/1/2011. Click here.
View all notes |
Alert me of new notes |
CANSLIM.net Company Profile |
SEC |
Zacks Reports |
StockTalk |
News |
Chart |
Request a new note
C
A N
S L
I M
|
PRGO
-
NASDAQ
Perrigo Co
DRUGS - Drug Related Products
|
$83.79
|
-4.19
-4.76% |
$86.80
|
1,253,007
266.60% of 50 DAV
50 DAV is 470,000
|
$94.61
-11.44%
|
7/13/2011
|
$92.89
|
PP = $92.40
|
|
MB = $97.02
|
Most Recent Note - 8/4/2011 5:46:17 PM
G - Gapped down today for another damaging loss with above average volume, closing further below its 50 DMA line. Prior lows near $81 define near-term support to watch above its 200 DMA line.
>>> The latest Featured Stock Update with an annotated graph appeared on 7/13/2011. Click here.
View all notes |
Alert me of new notes |
CANSLIM.net Company Profile |
SEC |
Zacks Reports |
StockTalk |
News |
Chart |
Request a new note
C
A N
S L
I M
|
PSMT
-
NASDAQ
Pricesmart Inc
RETAIL - Drug Stores
|
$55.78
|
-5.76
-9.36% |
$60.58
|
363,575
157.26% of 50 DAV
50 DAV is 231,200
|
$62.27
-10.42%
|
7/22/2011
|
$60.04
|
PP = $61.14
|
|
MB = $64.20
|
Most Recent Note - 8/4/2011 5:48:48 PM
G - Gapped down today for a damaging loss with +57% above average volume, promptly negating the prior session's gain and more, negating the half-hearted breakout attempt. Color code is changed to green. The negative bias in the broader market (M criteria) argues against new buying efforts for the near-term until a confirmation day occurs.
>>> The latest Featured Stock Update with an annotated graph appeared on 7/22/2011. Click here.
View all notes |
Alert me of new notes |
CANSLIM.net Company Profile |
SEC |
Zacks Reports |
StockTalk |
News |
Chart |
Request a new note
C
A N
S L
I M
|
QSII
-
NASDAQ
Quality Systems Inc
COMPUTER SOFTWARE and SERVICES - Healthcare Information Service
|
$84.49
|
-4.88
-5.46% |
$88.55
|
274,429
106.95% of 50 DAV
50 DAV is 256,600
|
$93.64
-9.77%
|
7/6/2011
|
$91.26
|
PP = $91.67
|
|
MB = $96.25
|
Most Recent Note - 8/4/2011 5:51:24 PM
G - Violated its 50 DMA line today and slumped more than -7% below pivot point, and its color code is changed to green. It did not trigger a recent technical buy signal, and now the weaker market action (M criteria) is arguing against any new buying efforts.
>>> The latest Featured Stock Update with an annotated graph appeared on 7/6/2011. Click here.
View all notes |
Alert me of new notes |
CANSLIM.net Company Profile |
SEC |
Zacks Reports |
StockTalk |
News |
Chart |
Request a new note
C
A N
S L
I M
|
Symbol/Exchange
Company Name
Industry Group |
PRICE |
CHANGE
(%Change) |
Day High |
Volume
(% DAV)
(% 50 day avg vol) |
52 Wk Hi
% From Hi |
Featured
Date |
Price
Featured |
Pivot Featured |
|
Max Buy |
ULTA
-
NASDAQ
Ulta Salon Cosm & Frag
SPECIALTY RETAIL - Specialty Retail, Other
|
$57.12
|
-4.96
-7.99% |
$61.99
|
733,265
78.60% of 50 DAV
50 DAV is 932,900
|
$68.80
-16.98%
|
1/6/2011
|
$36.12
|
PP = $37.34
|
|
MB = $39.21
|
Most Recent Note - 8/4/2011 5:55:19 PM
Closed near the session low today with a loss on below average volume. The damaging loss violated its 50 DMA line, raising concerns and triggering a technical sell signal. It will be dropped from the Featured Stocks list tonight. It rallied +200% since first featured in yellow at $22.81 in the 3/12/10 mid-day report.
>>> The latest Featured Stock Update with an annotated graph appeared on 8/4/2011. Click here.
View all notes |
Alert me of new notes |
CANSLIM.net Company Profile |
SEC |
Zacks Reports |
StockTalk |
News |
Chart |
Request a new note
C
A N
S L
I M
|
ZAGG
-
NASDAQ
Zagg Inc
SPECIALTY RETAIL - Specialty Retail, Other
|
$15.04
|
-1.58
-9.51% |
$16.39
|
2,154,428
87.31% of 50 DAV
50 DAV is 2,467,600
|
$16.90
-11.01%
|
6/1/2011
|
$10.92
|
PP = $10.59
|
|
MB = $11.12
|
Most Recent Note - 8/4/2011 5:57:24 PM
G - Down today on below average volume. Extended from a sound base, and its 50 DMA line defines chart support to watch.
>>> The latest Featured Stock Update with an annotated graph appeared on 7/19/2011. Click here.
View all notes |
Alert me of new notes |
CANSLIM.net Company Profile |
SEC |
Zacks Reports |
StockTalk |
News |
Chart |
Request a new note
C
A N
S L
I M
|
|
|
|
THESE ARE NOT BUY RECOMMENDATIONS!
Comments contained in the body of this report are technical
opinions only. The material herein has been obtained
from sources believed to be reliable and accurate, however,
its accuracy and completeness cannot be guaranteed.
This site is not an investment advisor, hence it does
not endorse or recommend any securities or other investments.
Any recommendation contained in this report may not
be suitable for all investors and it is not to be deemed
an offer or solicitation on our part with respect to
the purchase or sale of any securities. All trademarks,
service marks and trade names appearing in this report
are the property of their respective owners, and are
likewise used for identification purposes only.
This report is a service available
only to active Paid Premium Members.
You may opt-out of receiving report notifications
at any time. Questions or comments may be submitted
by writing to Premium Membership Services 665 S.E. 10 Street, Suite 201 Deerfield Beach, FL 33441-5634 or by calling 1-800-965-8307
or 954-785-1121.
|
|
|

