You are not logged in.
This means you
CAN ONLY VIEW reports that were published prior to Monday, April 14, 2025.
You
MUST UPGRADE YOUR MEMBERSHIP if you want to see any current reports.
AFTER MARKET UPDATE - WEDNESDAY, AUGUST 4TH, 2010
Previous After Market Report Next After Market Report >>>
|
|
|
|
DOW |
+44.05 |
10,680.43 |
+0.41% |
|
Volume |
975,770,350 |
-2% |
|
Volume |
1,980,947,620 |
+1% |
|
NASDAQ |
+20.05 |
2,303.57 |
+0.88% |
|
Advancers |
2,301 |
73% |
|
Advancers |
1,755 |
64% |
|
S&P 500 |
+6.78 |
1,127.24 |
+0.61% |
|
Decliners |
782 |
25% |
|
Decliners |
885 |
32% |
|
Russell 2000 |
+7.30 |
662.96 |
+1.11% |
|
52 Wk Highs |
287 |
|
|
52 Wk Highs |
54 |
|
|
S&P 600 |
+3.87 |
354.26 |
+1.10% |
|
52 Wk Lows |
13 |
|
|
52 Wk Lows |
23 |
|
|
 |
Breadth Positive As Indices Rise
Adam Sarhan, Contributing Writer,
The major averages rallied after two favorable economic reports were released. Volume totals were reported lighter on the NYSE and higher on the Nasdaq exchanges versus the prior session. Advancers led decliners by almost a 3-to-1 ratio and the NYSE and by a 2-to-1 ratio on the Nasdaq exchange. New 52-week highs easily outnumbered new 52-week lows on the NYSE and the Nasdaq exchange. There were 35 high-ranked companies from the CANSLIM.net Leaders List that made a new 52-week high and appeared on the CANSLIM.net BreakOuts Page, higher from the 27 issues that appeared on the prior session.
Stocks closed higher after the ADP said private employers added more jobs than expected last month and the ISM's service index topped estimates. ADP Employer Services, the country's largest private payrolls report, showed companies in the US added 42,000 employees to payrolls in July, topping the Street's forecast of 30,000 increase. This report bodes well for Friday's non farm payrolls report.
Elsewhere, the Institute for Supply Management’s index of non-manufacturing businesses, which covers over +85% of the economy, rose to 54.3 from 53.8 in June. Analysts were looking for a decline to 53. It is also important to note that any reading above 50 signals expansion.
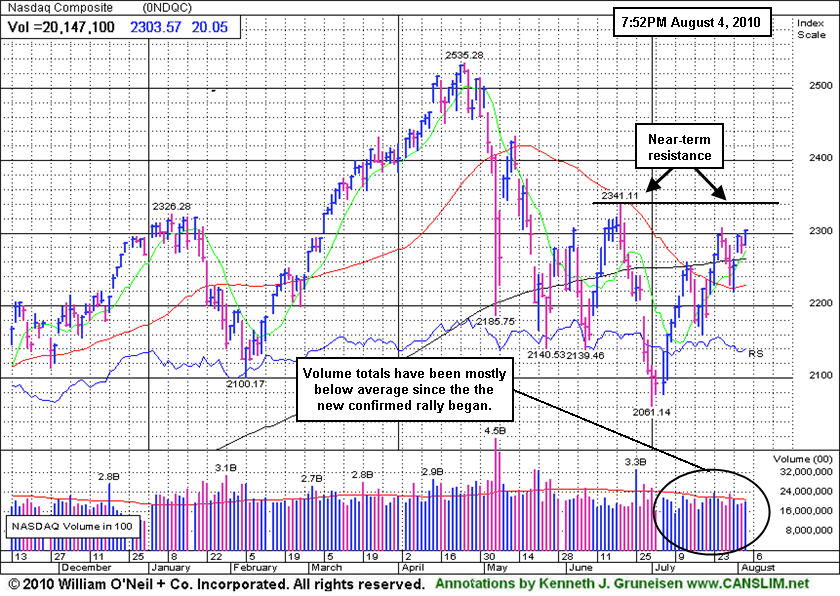
At this point, the Dow Jones Industrial Average and the NYSE Composite Index have traded above resistance at their long term 200-day moving average (DMA) lines and recent chart highs. The tech-heavy Nasdaq Composite, benchmark S&P 500, and small-cap Russell 2000 index remain slightly below their recent chart highs. However, the fact that all of the major averages are trading above their respective 2-month downward trendlines bodes well for this five week rally. In order for a new leg higher to begin, all the major averages must close and remain above their respective resistance levels. Remember that the window remains open for for high-ranked stocks to be accumulated when they trigger fresh technical buy signals. Trade accordingly.
PICTURED: The Nasdaq Composite Index is above its 50 and 200 DMA lines and has been approaching near-term resistance at its June highs. However, the daily volume totals have been mostly below average since the latest confirmed rally began.
|
|
|
 |
Healthcare Group's Winning Streak Has It In Healthier Shape
Kenneth J. Gruneisen - Passed the CAN SLIM® Master's Exam
Gains for the Retail Index ($RLX +2.16%) and Broker/Dealer Index ($XBD +1.90%) helped underpin the major averages' rally while the Bank Index ($BKX -0.24%) paused. The Biotechnology Index ($BTK +2.54%) and the Internet Index ($IIX +2.22%) led the tech sector's gainers while the Networking Index ($NWX +0.54%) and the Semiconductor Index ($SOX +0.99%) posted smaller gains. The Gold & Silver Index ($XAU +2.15%) posted a solid gain and energy-related shares had a slightly positive bias as the Integrated Oil Index ($XOI +0.66%) and Oil Services Index ($OSX +1.46%) rose.
Charts courtesy www.stockcharts.com

PICTURED: The Healthcare Index ($HMO +2.40%) is rallying from below its 50 and 200 DMA lines toward prior highs with a streak of 5 consecutive gains.
| Oil Services |
$OSX |
190.18 |
+2.74 |
+1.46% |
-2.43% |
| Healthcare |
$HMO |
1,559.14 |
+36.54 |
+2.40% |
+5.85% |
| Integrated Oil |
$XOI |
1,024.48 |
+6.72 |
+0.66% |
-4.09% |
| Semiconductor |
$SOX |
354.71 |
+3.46 |
+0.99% |
-1.44% |
| Networking |
$NWX |
245.33 |
+1.32 |
+0.54% |
+6.18% |
| Internet |
$IIX |
252.00 |
+5.48 |
+2.22% |
+7.76% |
| Broker/Dealer |
$XBD |
110.28 |
+2.05 |
+1.90% |
-4.15% |
| Retail |
$RLX |
414.45 |
+8.78 |
+2.16% |
+0.81% |
| Gold & Silver |
$XAU |
173.91 |
+3.66 |
+2.15% |
+3.36% |
| Bank |
$BKX |
49.40 |
-0.12 |
-0.24% |
+15.66% |
| Biotech |
$BTK |
1,114.67 |
+27.59 |
+2.54% |
+18.31% |
|
|
|
 |
Strong Leader May Be Dangerous To Chase While Extended
Kenneth J. Gruneisen - Passed the CAN SLIM® Master's Exam
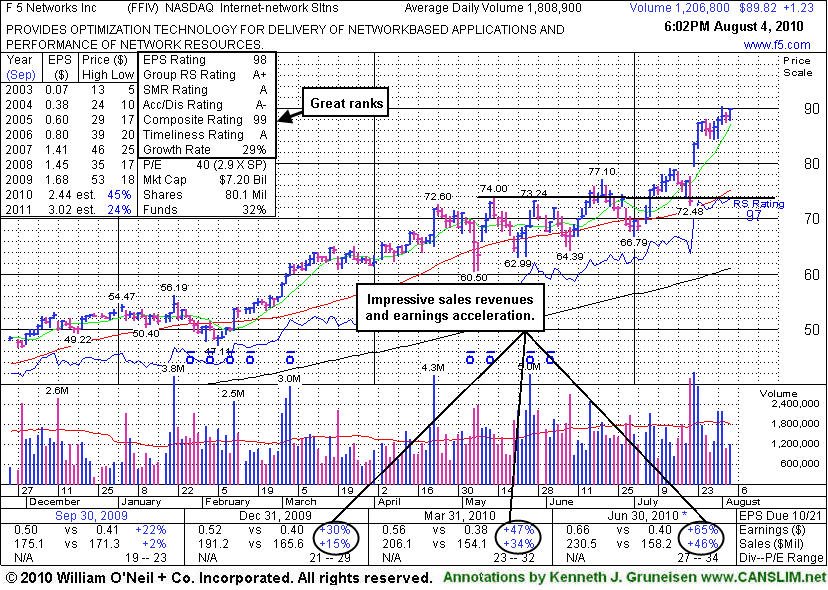
F5 Networks Inc. (FFIV +$1.23 or +1.39% to $89.82) finished at a new high close after a gain today with light volume. Patient investors might wait for a secondary buy point to develop, and disciplined investors avoid chasing stocks extended more than +5% above prior chart highs. It has been recently noted - "Extended from any sound base after recent volume-driven gains, it could go on to produce more climactic gains."
In its last FSU section appearance on 7/07/10 an annotated graph was included under the headline "Gain Today For New High Close Bodes Well" and further described the action as it - "Posted a considerable gain today with +28% above average volume that helped it rally above its previously cited pivot point for a new high close. Its color code was changed to yellow based on its recent resilience. It is now clear of virtually all resistance due to overhead supply, and the path of least resistance is more likely to lead it even higher."
The company currently sports a very healthy Earnings Per Share (EPS) rating of 98 and a Relative Strength (RS) rating of 97. It resides in the Internet- Networking Solutions group which is an Industry Group showing lots of leadership, satisfying the "L" criteria. Its quarterly sales and earnings results showed impressive acceleration in the Dec '09, Mar and Jun '10 periods satisfying the C criteria. The company has maintained a good annual earnings (A criteria) history. This stock was first featured in the January 2004 edition of CANSLIM.net News (read here) with a $26.85 pivot point. During the past 6 years, FFIV has built several bases, and it has also been through some tough consolidation periods.
|
|
|
Color Codes Explained :
Y - Better candidates highlighted by our
staff of experts.
G - Previously featured
in past reports as yellow but may no longer be buyable under the
guidelines.
***Last / Change / Volume data in this table is the closing quote data***
Symbol/Exchange
Company Name
Industry Group |
PRICE |
CHANGE
(%Change) |
Day High |
Volume
(% DAV)
(% 50 day avg vol) |
52 Wk Hi
% From Hi |
Featured
Date |
Price
Featured |
Pivot Featured |
|
Max Buy |
AAPL
-
NASDAQ
Apple Inc
COMPUTER HARDWARE - Personal Computers
|
$262.98
|
+1.05
0.40% |
$264.28
|
15,008,198
56.32% of 50 DAV
50 DAV is 26,646,500
|
$279.01
-5.75%
|
6/17/2010
|
$270.95
|
PP = $272.56
|
|
MB = $286.19
|
 Most Recent Note - 8/4/2010 5:26:38 PM
Y - Still quietly consolidating in a tight range above its 50 DMA line, it has been 7 weeks since its negative reversal on 6/21/10 at its all-time high. Recent chart low ($239) defines an important support level.
>>> The latest Featured Stock Update with an annotated graph appeared on 7/12/2010. Click here.
View all notes |
Alert me of new notes |
CANSLIM.net Company Profile |
SEC |
Zacks Reports |
StockTalk |
News |
Chart |
Request a new note
C
A N
S L
I M


|
ABV
-
NYSE
Comp De Bebidas Adr
FOOD and BEVERAGE - Beverages - Brewers
|
$108.57
|
-0.13
-0.12% |
$109.22
|
669,743
92.51% of 50 DAV
50 DAV is 724,000
|
$112.60
-3.58%
|
6/29/2010
|
$104.74
|
PP = $109.33
|
|
MB = $114.80
|
Most Recent Note - 8/4/2010 5:31:16 PM
Y - This Brazil-based beverage firm churned a lot of volume this week without making great price progress above prior chart highs.
>>> The latest Featured Stock Update with an annotated graph appeared on 7/20/2010. Click here.
View all notes |
Alert me of new notes |
CANSLIM.net Company Profile |
SEC |
Zacks Reports |
StockTalk |
News |
Chart |
Request a new note
C
A N
S L
I M
|
BIDU
-
NASDAQ
Baidu Inc Ads
INTERNET - Internet Information Providers
|
$86.60
|
+1.81
2.13% |
$86.91
|
11,704,121
97.73% of 50 DAV
50 DAV is 11,976,200
|
$85.35
1.46%
|
7/14/2010
|
$75.03
|
PP = $78.59
|
|
MB = $82.52
|
Most Recent Note - 8/4/2010 5:37:03 PM
G - Gain today for a new all-time high above its "max buy" level. Steadily rose above prior highs in the $78 area and upward without great volume conviction. Color code is changed to green as it gets extended from prior chart highs. No overhead supply remains to act as resistance.
>>> The latest Featured Stock Update with an annotated graph appeared on 7/14/2010. Click here.
View all notes |
Alert me of new notes |
CANSLIM.net Company Profile |
SEC |
Zacks Reports |
StockTalk |
News |
Chart |
Request a new note
C
A N
S L
I M
|
CACC
-
NASDAQ
Credit Acceptance Corp
FINANCIAL SERVICES - Credit Services
|
$58.57
|
+3.54
6.43% |
$58.66
|
109,887
226.10% of 50 DAV
50 DAV is 48,600
|
$56.67
3.35%
|
7/29/2010
|
$52.04
|
PP = $54.07
|
|
MB = $56.77
|
Most Recent Note - 8/4/2010 5:39:10 PM
G - Considerable gain today with more than 2 times average volume for a new all-time high. Color code is changed to green after rising well above its "max buy" level. Recently reported +38% earnings on +21% sales revenues for the quarter ended June 30, 2010.
>>> The latest Featured Stock Update with an annotated graph appeared on 8/2/2010. Click here.
View all notes |
Alert me of new notes |
CANSLIM.net Company Profile |
SEC |
Zacks Reports |
StockTalk |
News |
Chart |
Request a new note
C
A N
S L
I M
|
CRM
-
NYSE
Salesforce.Com Inc
INTERNET - Internet Software and Services
|
$103.56
|
+2.55
2.52% |
$103.77
|
1,480,002
58.05% of 50 DAV
50 DAV is 2,549,500
|
$102.49
1.04%
|
6/2/2010
|
$88.44
|
PP = $89.60
|
|
MB = $94.08
|
Most Recent Note - 8/4/2010 5:41:09 PM
G - Gain today for another new 52-week high with light volume. Prior highs near $97 define near-term support to watch above its 50 DMA line.
>>> The latest Featured Stock Update with an annotated graph appeared on 7/15/2010. Click here.
View all notes |
Alert me of new notes |
CANSLIM.net Company Profile |
SEC |
Zacks Reports |
StockTalk |
News |
Chart |
Request a new note
C
A N
S L
I M
|
Symbol/Exchange
Company Name
Industry Group |
PRICE |
CHANGE
(%Change) |
Day High |
Volume
(% DAV)
(% 50 day avg vol) |
52 Wk Hi
% From Hi |
Featured
Date |
Price
Featured |
Pivot Featured |
|
Max Buy |
DTSI
-
NASDAQ
D T S Inc
CONSUMER DURABLES - Electronic Equipment
|
$37.17
|
+0.20
0.54% |
$37.59
|
31,659
31.22% of 50 DAV
50 DAV is 101,400
|
$37.53
-0.96%
|
7/27/2010
|
$37.00
|
PP = $36.28
|
|
MB = $38.09
|
Most Recent Note - 8/4/2010 5:55:05 PM
Y - Quietly edged higher today and ended 6 cents off its best ever close after a considerable gain on 8/03/10 with above average volume. It will report earnings after the close on Monday, August 9th, and Street estimates calling for lower FY '10 earnings have been noted as a concern. Prior highs in the $35-36 area define support above its 50 DMA line.
>>> The latest Featured Stock Update with an annotated graph appeared on 7/27/2010. Click here.
View all notes |
Alert me of new notes |
CANSLIM.net Company Profile |
SEC |
Zacks Reports |
StockTalk |
News |
Chart |
Request a new note
C
A N
S L
I M
|
FFIV
-
NASDAQ
F 5 Networks Inc
INTERNET - Internet Software and Services
|
$89.82
|
+1.23
1.39% |
$90.00
|
1,211,519
66.98% of 50 DAV
50 DAV is 1,808,900
|
$90.25
-0.48%
|
6/16/2010
|
$74.50
|
PP = $74.10
|
|
MB = $77.81
|
Most Recent Note - 8/4/2010 6:00:48 PM
G - New high close after a gain today with light volume. Extended from any sound base after recent volume-driven gains, it could go on to produce more climactic gains.
>>> The latest Featured Stock Update with an annotated graph appeared on 8/4/2010. Click here.
View all notes |
Alert me of new notes |
CANSLIM.net Company Profile |
SEC |
Zacks Reports |
StockTalk |
News |
Chart |
Request a new note
C
A N
S L
I M
|
MELI
-
NASDAQ
Mercadolibre Inc
INTERNET - Internet Software and; Services
|
$62.68
|
+0.42
0.67% |
$63.41
|
881,948
92.47% of 50 DAV
50 DAV is 953,800
|
$65.99
-5.02%
|
5/13/2010
|
$54.21
|
PP = $55.85
|
|
MB = $58.64
|
Most Recent Note - 8/4/2010 6:04:28 PM
G - Quiet gain today, making a stand near prior chart highs in the $62 area. It has been consolidating after a gap up gain on 7/26/10.
>>> The latest Featured Stock Update with an annotated graph appeared on 7/23/2010. Click here.
View all notes |
Alert me of new notes |
CANSLIM.net Company Profile |
SEC |
Zacks Reports |
StockTalk |
News |
Chart |
Request a new note
C
A N
S L
I M
|
MWIV
-
NASDAQ
M W I Veterinary Supply
HEALTH SERVICES - Medical Instruments and; Supplies
|
$53.32
|
+0.22
0.41% |
$54.21
|
55,586
79.07% of 50 DAV
50 DAV is 70,300
|
$54.48
-2.13%
|
7/29/2010
|
$52.05
|
PP = $52.09
|
|
MB = $54.69
|
Most Recent Note - 8/4/2010 6:06:47 PM
Y - Holding its ground in a tight range near all-time highs since it rallied above its pivot point and finished strong after featured in the 7/29/10 mid-day report (read here).
>>> The latest Featured Stock Update with an annotated graph appeared on 7/30/2010. Click here.
View all notes |
Alert me of new notes |
CANSLIM.net Company Profile |
SEC |
Zacks Reports |
StockTalk |
News |
Chart |
Request a new note
C
A N
S L
I M
|
NEM
-
NYSE
Newmont Mining Corp
METALS and MINING - Gold
|
$56.25
|
+0.78
1.41% |
$56.46
|
7,160,145
83.47% of 50 DAV
50 DAV is 8,578,600
|
$63.38
-11.25%
|
6/22/2010
|
$59.60
|
PP = $59.67
|
|
MB = $62.65
|
Most Recent Note - 8/4/2010 6:09:10 PM
G - Halted its slide and held its ground in a tight range since its damaging gap down on 7/27/10. Technically, a rebound above its 50 DMA line would help its outlook improve.
>>> The latest Featured Stock Update with an annotated graph appeared on 7/9/2010. Click here.
View all notes |
Alert me of new notes |
CANSLIM.net Company Profile |
SEC |
Zacks Reports |
StockTalk |
News |
Chart |
Request a new note
C
A N
S L
I M
|
Symbol/Exchange
Company Name
Industry Group |
PRICE |
CHANGE
(%Change) |
Day High |
Volume
(% DAV)
(% 50 day avg vol) |
52 Wk Hi
% From Hi |
Featured
Date |
Price
Featured |
Pivot Featured |
|
Max Buy |
NEOG
-
NASDAQ
Neogen Corp
DRUGS - Diagnostic Substances
|
$29.91
|
+0.46
1.56% |
$30.00
|
41,862
44.20% of 50 DAV
50 DAV is 94,700
|
$30.39
-1.58%
|
7/22/2010
|
$27.19
|
PP = $27.87
|
|
MB = $29.26
|
Most Recent Note - 8/4/2010 6:26:44 PM
G - Today's gain with light volume led to its best ever close above "max buy" level. It made steady progress and stubbornly held its gains since featured in the 7/22/10 mid-day report.
>>> The latest Featured Stock Update with an annotated graph appeared on 7/22/2010. Click here.
View all notes |
Alert me of new notes |
CANSLIM.net Company Profile |
SEC |
Zacks Reports |
StockTalk |
News |
Chart |
Request a new note
C
A N
S L
I M
|
NETL
-
NASDAQ
Netlogic Microsystems
ELECTRONICS - Semiconductor - Memory Chips
|
$29.73
|
+0.26
0.88% |
$29.98
|
835,950
62.51% of 50 DAV
50 DAV is 1,337,200
|
$35.00
-15.06%
|
7/28/2010
|
$33.44
|
PP = $35.10
|
|
MB = $36.86
|
Most Recent Note - 8/4/2010 6:32:57 PM
G - Halted its slide and trading in a tight range above its 50 DMA line since its damaging 7/29/10 loss. It did not trigger a technical buy signal after it was featured in the 7/28/10 mid-day report. While consolidating, its 7/30/10 low ($28.27) now defines the only support above its 200 DMA and earlier chart lows.
>>> The latest Featured Stock Update with an annotated graph appeared on 7/28/2010. Click here.
View all notes |
Alert me of new notes |
CANSLIM.net Company Profile |
SEC |
Zacks Reports |
StockTalk |
News |
Chart |
Request a new note
C
A N
S L
I M
|
ROVI
-
NASDAQ
Rovi Corp
COMPUTER SOFTWARE andamp; SERVICES - Security Software andamp; Services
|
$43.51
|
+1.47
3.50% |
$43.61
|
1,478,809
118.55% of 50 DAV
50 DAV is 1,247,400
|
$44.96
-3.23%
|
6/3/2010
|
$38.70
|
PP = $40.16
|
|
MB = $42.17
|
Most Recent Note - 8/4/2010 6:35:02 PM
G - Finished near its session high today with a solid gain. Support is defined by highs in the $40 area and its 50 DMA line.
>>> The latest Featured Stock Update with an annotated graph appeared on 7/21/2010. Click here.
View all notes |
Alert me of new notes |
CANSLIM.net Company Profile |
SEC |
Zacks Reports |
StockTalk |
News |
Chart |
Request a new note
C
A N
S L
I M
|
ULTA
-
NASDAQ
Ulta Salon Cosm & Frag
SPECIALTY RETAIL - Specialty Retail, Other
|
$24.90
|
-0.43
-1.70% |
$25.45
|
339,656
46.75% of 50 DAV
50 DAV is 726,500
|
$26.75
-6.92%
|
8/4/2010
|
$24.90
|
PP = $26.85
|
|
MB = $28.19
|
Most Recent Note - 8/4/2010 6:41:45 PM
Y - Working on a near 8-week cup shaped base and perched above its 50 DMA and -7% off its 52-week high, its color code is changed to yellow with new pivot point cited based on its 6/21/10 high plus ten cents.
>>> The latest Featured Stock Update with an annotated graph appeared on 7/19/2010. Click here.
View all notes |
Alert me of new notes |
CANSLIM.net Company Profile |
SEC |
Zacks Reports |
StockTalk |
News |
Chart |
Request a new note
C
A N
S L
I M
|
VIT
-
NYSE
Vanceinfo Tech Inc Ads
COMPUTER SOFTWARE and SERVICES - Business Software and Services
|
$27.30
|
+0.70
2.63% |
$27.47
|
234,635
44.50% of 50 DAV
50 DAV is 527,300
|
$27.59
-1.05%
|
7/8/2010
|
$25.20
|
PP = $26.58
|
|
MB = $27.91
|
Most Recent Note - 8/4/2010 7:39:58 PM
Y - Gain today on very light volume helped it finish 10 cents off its best ever close. It has not produced a gain with above average volume or triggered a buy signal yet since featured in the 7/08/10 mid-day report. Its 7/19/10 low ($23.78) defines near-term support above its 50 DMA line.
>>> The latest Featured Stock Update with an annotated graph appeared on 7/26/2010. Click here.
View all notes |
Alert me of new notes |
CANSLIM.net Company Profile |
SEC |
Zacks Reports |
StockTalk |
News |
Chart |
Request a new note
C
A N
S L
I M
|
Symbol/Exchange
Company Name
Industry Group |
PRICE |
CHANGE
(%Change) |
Day High |
Volume
(% DAV)
(% 50 day avg vol) |
52 Wk Hi
% From Hi |
Featured
Date |
Price
Featured |
Pivot Featured |
|
Max Buy |
|
|
|
THESE ARE NOT BUY RECOMMENDATIONS!
Comments contained in the body of this report are technical
opinions only. The material herein has been obtained
from sources believed to be reliable and accurate, however,
its accuracy and completeness cannot be guaranteed.
This site is not an investment advisor, hence it does
not endorse or recommend any securities or other investments.
Any recommendation contained in this report may not
be suitable for all investors and it is not to be deemed
an offer or solicitation on our part with respect to
the purchase or sale of any securities. All trademarks,
service marks and trade names appearing in this report
are the property of their respective owners, and are
likewise used for identification purposes only.
This report is a service available
only to active Paid Premium Members.
You may opt-out of receiving report notifications
at any time. Questions or comments may be submitted
by writing to Premium Membership Services 665 S.E. 10 Street, Suite 201 Deerfield Beach, FL 33441-5634 or by calling 1-800-965-8307
or 954-785-1121.
|
|
|


