You are not logged in.
This means you
CAN ONLY VIEW reports that were published prior to Monday, February 26, 2024.
You
MUST UPGRADE YOUR MEMBERSHIP if you want to see any current reports.
AFTER MARKET UPDATE - WEDNESDAY, JULY 29TH, 2020
Previous After Market Report Next After Market Report >>>
|
|
|
|
DOW |
+160.29 |
26,539.57 |
+0.61% |
|
Volume |
860,689,099 |
+19% |
|
Volume |
3,953,844,500 |
+3% |
|
NASDAQ |
+140.85 |
10,542.94 |
+1.35% |
|
Advancers |
2,387 |
81% |
|
Advancers |
2,179 |
67% |
|
S&P 500 |
+40.00 |
3,258.44 |
+1.24% |
|
Decliners |
574 |
19% |
|
Decliners |
1,082 |
33% |
|
Russell 2000 |
+30.87 |
1,500.63 |
+2.10% |
|
52 Wk Highs |
123 |
|
|
52 Wk Highs |
120 |
|
|
S&P 600 |
+22.03 |
877.44 |
+2.58% |
|
52 Wk Lows |
13 |
|
|
52 Wk Lows |
19 |
|
|
 |
Leadership Expanded as Major Indices Rose With Higher Volume
Kenneth J. Gruneisen - Passed the CAN SLIM® Master's Exam
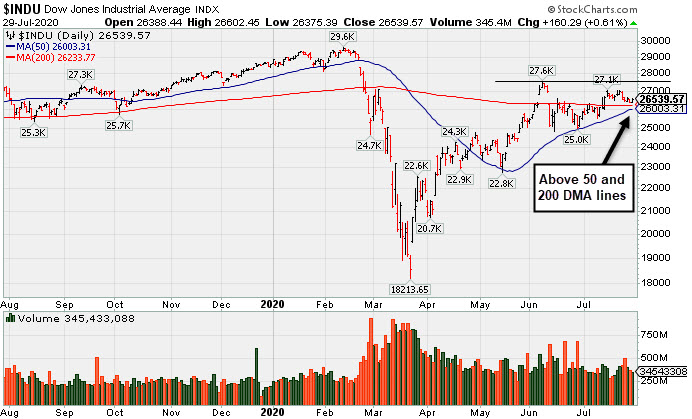
The Dow added 160 points, while the S&P 500 rose 1.2%. The Nasdaq Composite advanced 1.4%. The reported volume totals were higher than the prior session on the NYSE and on the Nasdaq exchange, a reassuring sign that institutional buying increased. There were 72 high-ranked companies from the Leaders List that hit new 52-week highs and were listed on the BreakOuts Page, versus the total of 44 on the prior session. New 52-week highs totals expanded and solidly outnumbered new 52-week lows totals on both the NYSE and the Nasdaq exchange.The major indices are in a confirmed uptrend (M criteria). Any sustainable rally requires a healthy crop of new leaders, so it remains ever-important to see substantial new highs totals. Charts used courtesy of www.stockcharts.com
PICTURED: The Dow Jones Industrial Average is consolidating well above its 50-day and 200-day moving average (DMA) lines. The Blue Chip index is -10.2% off its record high.
Stocks finished higher Wednesday as investors digested a slew of corporate earnings reports and assessed central bank updates. At the conclusion of the July FOMC meeting, the Federal Reserve left its benchmark interest rate unchanged at the near zero bound range and pledged to utilize its “full range of tools” to support the U.S. economy during the pandemic.
All 11 S&P 500 sectors ended the day in positive territory with the Energy group pacing gains. Healthcare also outperformed, with Anthem (ANTH +6.16%) rose after beating expectations and reiterating its 2020 earnings projection. Advanced Micro Devices (AMD +12.54%) gapped up for a new all-time high after raising its full-year revenue forecasts. Starbucks (SBUX +3.72%) rose after posting a smaller than anticipated loss and raising its forward guidance for its fiscal fourth quarter. Meanwhile, Boeing (BA -2.83%) fell following a quarterly loss that nearly doubled analysts’ projections. L Brands (LB +35.36%) rose after reporting stronger than expected sales and announcing a cost reduction strategy. Elsewhere, shares of Wingstop (WING +16.72%) rose following a top and bottom line beat driven by a 31.9% increase in same-store sales. In other corporate news, shares of Facebook (FB), Apple (AAPL), Amazon (AMZN), and Microsoft (MSFT) all finished higher by more than 1.0% despite the CEOs testifying before the House Judiciary Committee related to antitrust and regulatory scrutiny.
On the data front, pending home sales rose 16.6% in June, above economists’ forecasts, but below the previous month’s record increase of 44.3%. Treasuries strengthened, with the yield on the 10-year note losing two basis points to 0.56%.
|
 Kenneth J. Gruneisen started out as a licensed stockbroker in August 1987, a couple of months prior to the historic stock market crash that took the Dow Jones Industrial Average down -22.6% in a single day. He has published daily fact-based fundamental and technical analysis on high-ranked stocks online for two decades. Through FACTBASEDINVESTING.COM, Kenneth provides educational articles, news, market commentary, and other information regarding proven investment systems that work in good times and bad.
Comments contained in the body of this report are technical opinions only and are not necessarily those of Gruneisen Growth Corp. The material herein has been obtained from sources believed to be reliable and accurate, however, its accuracy and completeness cannot be guaranteed. Our firm, employees, and customers may effect transactions, including transactions contrary to any recommendation herein, or have positions in the securities mentioned herein or options with respect thereto. Any recommendation contained in this report may not be suitable for all investors and it is not to be deemed an offer or solicitation on our part with respect to the purchase or sale of any securities. |
|
 |
Financial, Energy, Semiconductor, and Networking Indexes Rose
Kenneth J. Gruneisen - Passed the CAN SLIM® Master's Exam
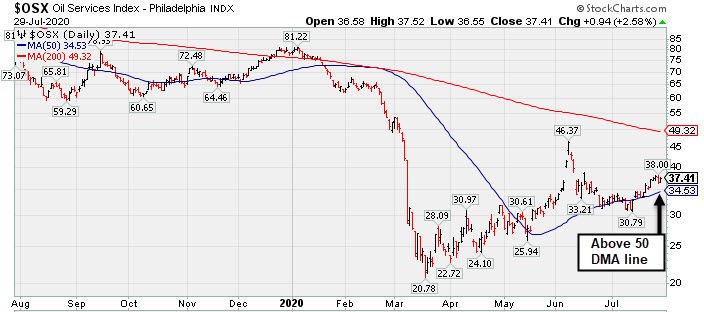
Financial groups helped boost the major indices higher as the Broker/Dealer Index ($XBD +1.95%) and the Bank Index ($BKX +3.13%) rose. The Retail Index ($RLX +0.95%) also notched a modest gain. The Semiconductor Index ($SOX +2.23%) and Networking Index ($NWX +2.64%) each posted a solid gain, but the Biotech Index ($BTK -1.23%) lost ground. Commodity-linked groups were mixed as the Oil Services Index ($OSX +2.58%) and Integrated Oil Index ($XOI +2.54%) both notched solid gains while the Gold & Silver Index ($XAU -1.00%) retreated.
PICTURED: The Oil Services Index ($OSX +2.58%) has been consolidating above its 50-day moving average (DMA) line.
| Oil Services |
$OSX |
37.41 |
+0.94 |
+2.58% |
-52.22% |
| Integrated Oil |
$XOI |
777.92 |
+19.26 |
+2.54% |
-38.77% |
| Semiconductor |
$SOX |
2,106.30 |
+45.90 |
+2.23% |
+13.88% |
| Networking |
$NWX |
592.43 |
+15.21 |
+2.64% |
+1.55% |
| Broker/Dealer |
$XBD |
285.26 |
+5.45 |
+1.95% |
-1.76% |
| Retail |
$RLX |
3,245.97 |
+30.55 |
+0.95% |
+32.53% |
| Gold & Silver |
$XAU |
155.70 |
-1.58 |
-1.00% |
+45.62% |
| Bank |
$BKX |
76.49 |
+2.32 |
+3.13% |
-32.52% |
| Biotech |
$BTK |
5,744.26 |
-71.25 |
-1.23% |
+13.36% |
|
|
|
 |
Consolidating After Getting Extended From Prior Base
Kenneth J. Gruneisen - Passed the CAN SLIM® Master's Exam
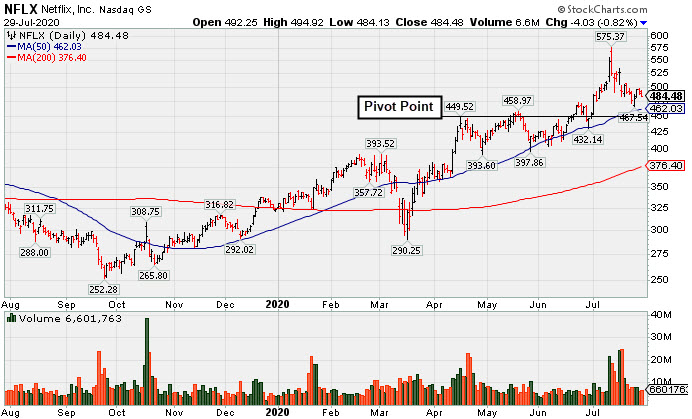
Netflix Inc (NFLX -$4.03 or -0.82% to $484.48) has been pulling back toward its "max buy" level after getting very extended from the prior base. Its 50-day moving average (DMA) line ($462.03) defines near-term support above prior highs in the $458 area.
Fundamentals remain strong. NFLX has been consolidating after reporting Jun '20 earnings +165% on +25% sales revenues versus the year ago period. It has tallied 4 consecutive quarterly comparisons well above the +25% minimum guideline (C criteria). NFLX finished strong after it was highlighted in yellow with pivot point cited based on its 3/03/20 high plus 10 cents in the 4/13/20 mid-day report (read here). The gain above the pivot point was backed by +55% above average volume and triggered a technical buy signal. NFLX was last shown in this FSU section on 7/02/20 with an annotated graph under the headline, "Powered to New High on Prior Session With Volume Driven Gain". A previously noted downturn in FY '15 earnings (A criteria) has been followed by very strong growth. The number of top-rated funds owning its shares (I criteria) rose from 1,534 in Mar '17 to 2,638 in Jun '20, a reassuring sign concerning the I criteria. Its current Up/Down Volume Ratio of 0.9 is an unbiased indication its shares have been under slight distributional pressure over the past 50 days. The company has 423.4 million shares in the public float (S criteria) which can make it a less likely sprinter. It has a Timeliness rating of A, a Sponsorship rating of B, and an Accumulation/Distribution Rating of B-. Charts courtesy of www.stockcharts.com
 |
|
|
Color Codes Explained :
Y - Better candidates highlighted by our
staff of experts.
G - Previously featured
in past reports as yellow but may no longer be buyable under the
guidelines.
***Last / Change / Volume data in this table is the closing quote data***
Symbol/Exchange
Company Name
Industry Group |
PRICE |
CHANGE
(%Change) |
Day High |
Volume
(% DAV)
(% 50 day avg vol) |
52 Wk Hi
% From Hi |
Featured
Date |
Price
Featured |
Pivot Featured |
|
Max Buy |
 FTNT
-
NASDAQ
FTNT
-
NASDAQ
Fortinet Inc
Computer Sftwr-Security
|
$136.84
|
+3.42
2.56% |
$137.86
|
707,263
42.28% of 50 DAV
50 DAV is 1,673,000
|
$151.95
-9.94%
|
6/22/2020
|
$142.68
|
PP = $149.79
|
|
MB = $157.28
|
Most Recent Note - 7/27/2020 6:06:49 PM
G - Its 50 DMA line ($137.68) has been acting as resistance after damaging losses, and a rebound above that important short-term average is needed for its outlook to improve.
>>> FEATURED STOCK ARTICLE : Best Ever Close With Volume-Driven Gain Approaching Pivot Point - 7/8/2020 |
View all notes |
Set NEW NOTE alert |
Company Profile |
SEC
News |
Chart |
Request a new note
C
A
S
I |
CRL
-
NYSE
Charles River Labs Intl
DRUGS - Biotechnology
|
$199.58
|
+2.21
1.12% |
$201.11
|
271,322
71.03% of 50 DAV
50 DAV is 382,000
|
$202.95
-1.66%
|
7/15/2020
|
$192.66
|
PP = $189.95
|
|
MB = $199.45
|
Most Recent Note - 7/27/2020 5:56:43 PM
G - Color code is changed to green after quietly rising and closing above its "max buy" level with today's gain backed by below average volume. The prior high ($189.85 on 6/03/20) defines initial support to watch above its 50 DMA line ($181.12).
>>> FEATURED STOCK ARTICLE : Volume +71% Above Average Behind Breakout - 7/15/2020 |
View all notes |
Set NEW NOTE alert |
Company Profile |
SEC
News |
Chart |
Request a new note
C
A
S
I |
EBS
-
NYSE
Emergent Biosolutions
DRUGS - Biotechnology
|
$94.23
|
+1.73
1.87% |
$94.66
|
605,732
65.84% of 50 DAV
50 DAV is 920,000
|
$107.16
-12.07%
|
7/7/2020
|
$89.47
|
PP = $93.68
|
|
MB = $98.36
|
Most Recent Note - 7/27/2020 5:54:13 PM
Y - Posted a big gain today with near average volume. There was a noted "negative reversal" on 7/20/20 at its all-time high. The next important support to watch is its 50 DMA line ($83.78). Due to report Jun '20 quarterly earnings news on 7/30/20. Volume and volatility often increase near earnings news.
>>> FEATURED STOCK ARTICLE : Impressive Rebound to Hit a New High - 7/9/2020 |
View all notes |
Set NEW NOTE alert |
Company Profile |
SEC
News |
Chart |
Request a new note
C
A
S
I |
NBIX
-
NASDAQ
Neurocrine Biosciences
DRUGS - Biotechnology
|
$120.84
|
-0.81
-0.67% |
$122.36
|
882,475
102.38% of 50 DAV
50 DAV is 862,000
|
$136.27
-11.32%
|
5/19/2020
|
$123.71
|
PP = $119.75
|
|
MB = $125.74
|
Most Recent Note - 7/28/2020 6:07:46 PM
G - Violated its 50 DMA line ($124.49) with a big loss today on below average volume triggering a technical sell signal. Only a prompt rebound above the 50 DMA line would help its outlook improve. Due to report Jun '20 quarterly earnings results on Monday 8/03/20. See the latest FSU analysis for more details and an annotated graph.
>>> FEATURED STOCK ARTICLE : Consolidating Near 50-Day Moving Average; Earnings Report Due - 7/27/2020 |
View all notes |
Set NEW NOTE alert |
Company Profile |
SEC
News |
Chart |
Request a new note
C
A
S
I |
BMRN
-
NASDAQ
Biomarin Pharmaceutical
DRUGS - Drug Manufacturers - Other
|
$120.53
|
-2.30
-1.87% |
$123.67
|
1,025,777
68.39% of 50 DAV
50 DAV is 1,500,000
|
$131.95
-8.65%
|
6/17/2020
|
$110.95
|
PP = $112.67
|
|
MB = $118.30
|
 Most Recent Note - 7/29/2020 6:11:01 PM
G - Pulling back from its all-time high and slumping near its "max buy" level with light volume behind recent losses. Due to report earnings news on 8/04/20. Its 50 DMA line ($116.38) defines important near-term support to watch above the prior high ($112.57 on 6/04/20).
>>> FEATURED STOCK ARTICLE : Hovering Near High With Volume Totals Cooling - 7/10/2020 |
View all notes |
Set NEW NOTE alert |
Company Profile |
SEC
News |
Chart |
Request a new note
C
A
S
I |
Symbol/Exchange
Company Name
Industry Group |
PRICE |
CHANGE
(%Change) |
Day High |
Volume
(% DAV)
(% 50 day avg vol) |
52 Wk Hi
% From Hi |
Featured
Date |
Price
Featured |
Pivot Featured |
|
Max Buy |
AUDC
-
NASDAQ
Audiocodes Ltd
ELECTRONICS - Scientific and Technical Instrum
|
$37.02
|
-0.19
-0.51% |
$38.79
|
1,839,858
234.68% of 50 DAV
50 DAV is 784,000
|
$44.94
-17.62%
|
7/17/2020
|
$37.16
|
PP = $40.16
|
|
MB = $42.17
|
Most Recent Note - 7/28/2020 6:05:39 PM
G - Reported Jun '20 quarterly earnings +45% on +8% sales revenues versus the year-ago period. Volume and volatility often increase near earnings news. It gapped down today and suffered a big volume-driven loss while slumping back below the pivot point and falling into the prior base, raising concerns. Disciplined investors always limit losses by selling any stock that falls more than 7-8% from their purchase price.
>>> FEATURED STOCK ARTICLE : Resilient and High-Ranked VOIP Firm Rebounding Near Highs - 7/17/2020 |
View all notes |
Set NEW NOTE alert |
Company Profile |
SEC
News |
Chart |
Request a new note
C
A
S
I |
AMD
-
NASDAQ
Advanced Micro Devices
ELECTRONICS - Semiconductor - Broad Line
|
$76.09
|
+8.48
12.54% |
$77.19
|
132,720,951
222.82% of 50 DAV
50 DAV is 59,565,000
|
$71.63
6.23%
|
7/22/2020
|
$61.73
|
PP = $59.10
|
|
MB = $62.06
|
Most Recent Note - 7/29/2020 12:42:47 PM
G - Gapped up today for another considerable volume-driven gain after reporting earnings +125% on +26% sales revenues for the Jun '20 quarter versus the year ago period. Getting very extended from the previously noted base. Disciplined investors avoid chasing stocks more than +5% above prior highs. The prior highs in the $59 area define initial support to watch on pullbacks.
>>> FEATURED STOCK ARTICLE : Pullback After Breakout Gain Backed by +152% Above Average Volume - 7/23/2020 |
View all notes |
Set NEW NOTE alert |
Company Profile |
SEC
News |
Chart |
Request a new note
C
A
S
I |
TREX
-
NYSE
Trex Company Inc
MATERIALS and CONSTRUCTION - General Building Materials
|
$139.63
|
+4.78
3.54% |
$140.06
|
354,750
37.30% of 50 DAV
50 DAV is 951,000
|
$139.98
-0.25%
|
6/26/2020
|
$109.05
|
PP = $132.94
|
|
MB = $139.59
|
Most Recent Note - 7/29/2020 6:24:42 PM
Y - Keep in mind it is due to report Jun '20 quarterly results after the close on Monday, 8/03/20. Volume and volatility often increase near earnings news. Posted a gain with light volume today and touched a new all-time high. Recent gains above the pivot point have not had the +40% above average volume necessary to trigger a proper new (or add-on) technical buy signal. Important near-term support is at its 50 DMA line ($125.41).
>>> FEATURED STOCK ARTICLE : Quietly Perched Near All-Time High After Forming a New Base - 7/6/2020 |
View all notes |
Set NEW NOTE alert |
Company Profile |
SEC
News |
Chart |
Request a new note
C
A
S
I |
NFLX
-
NASDAQ
Netflix Inc
SPECIALTY RETAIL - Music and Video Stores
|
$484.48
|
-4.03
-0.82% |
$494.92
|
6,600,096
84.11% of 50 DAV
50 DAV is 7,847,000
|
$575.37
-15.80%
|
5/14/2020
|
$441.95
|
PP = $449.62
|
|
MB = $472.10
|
Most Recent Note - 7/29/2020 6:06:59 PM
G - Consolidating above its 50 DMA line ($462) and prior highs in the $458 area defining important near-term support. Extended from the prior base, and consolidating after reporting Jun '20 earnings +165% on +25% sales revenues versus the year ago period. See the latest FSU analysis for more details and a new annotated graph.
>>> FEATURED STOCK ARTICLE : Consolidating After Getting Extended From Prior Base - 7/29/2020 |
View all notes |
Set NEW NOTE alert |
Company Profile |
SEC
News |
Chart |
Request a new note
C
A
S
I |
CHGG
-
NYSE
Chegg Inc
Consumer Svcs-Education
|
$74.99
|
+2.15
2.95% |
$75.45
|
2,530,071
75.23% of 50 DAV
50 DAV is 3,363,000
|
$79.09
-5.18%
|
6/17/2020
|
$63.71
|
PP = $68.08
|
|
MB = $71.48
|
Most Recent Note - 7/29/2020 6:30:17 PM
G - Due to report Jun '20 quarterly results on Monday, August 3, 2020, after the market close. Extended from any sound base. Prior high in the $68 area defines initial support to watch above its 50 DMA line ($66.44) where any losses leading to violations would raise concerns and trigger technical sell signals.
>>> FEATURED STOCK ARTICLE : Negative Reversal After Recently Wedging into New High Territory - 7/13/2020 |
View all notes |
Set NEW NOTE alert |
Company Profile |
SEC
News |
Chart |
Request a new note
C
A
S
I |
Symbol/Exchange
Company Name
Industry Group |
PRICE |
CHANGE
(%Change) |
Day High |
Volume
(% DAV)
(% 50 day avg vol) |
52 Wk Hi
% From Hi |
Featured
Date |
Price
Featured |
Pivot Featured |
|
Max Buy |
LGIH
-
NASDAQ
L G I Homes Inc
Bldg-Resident/Comml
|
$118.11
|
+4.13
3.62% |
$118.71
|
260,356
72.52% of 50 DAV
50 DAV is 359,000
|
$120.54
-2.02%
|
7/7/2020
|
$99.19
|
PP = $95.82
|
|
MB = $100.61
|
Most Recent Note - 7/29/2020 6:33:33 PM
G - Volume was below average behind today's big gain for yet another new best-ever close. Stubbornly holding its ground. It is extended from the previously noted base. Prior highs in the $95 area and its 50 DMA line ($94.03) define near-term support to watch on pullbacks.
>>> FEATURED STOCK ARTICLE : Breakout to New High Backed by 53% Above Average Volume - 7/7/2020 |
View all notes |
Set NEW NOTE alert |
Company Profile |
SEC
News |
Chart |
Request a new note
C
A
S
I |
NOW
-
NYSE
Servicenow Inc
Computer Sftwr-Enterprse
|
$445.71
|
+10.67
2.45% |
$446.51
|
2,141,731
128.86% of 50 DAV
50 DAV is 1,662,000
|
$454.70
-1.98%
|
4/30/2020
|
$343.05
|
PP = $363.05
|
|
MB = $381.20
|
Most Recent Note - 7/28/2020 6:20:36 PM
G - Due to report Jun '20 quarterly results after the close on Wednesday, 7/29/20. Volume and volatility often increase near earnings news. Volume totals have been cooling while hovering near its all-time high, stubbornly holding its ground. It has not formed a sound base. Its 50 DMA line ($403) defines important near-term support to watch where a violation may trigger a technical sell signal.
>>> FEATURED STOCK ARTICLE : Perched Near All-Time High With Earnings News Due Next Week - 7/22/2020 |
View all notes |
Set NEW NOTE alert |
Company Profile |
SEC
News |
Chart |
Request a new note
C
A
S
I |
TEAM
-
NASDAQ
Atlassian Corp Plc Cl A
Comp Sftwr-Spec Enterprs
|
$187.11
|
+3.75
2.05% |
$189.50
|
895,119
48.02% of 50 DAV
50 DAV is 1,864,000
|
$198.41
-5.70%
|
7/7/2020
|
$190.44
|
PP = $191.82
|
|
MB = $201.41
|
Most Recent Note - 7/29/2020 6:21:00 PM
Y - Consolidating above its 50 DMA line ($181.23) with volume totals cooling. Recent gains above the pivot point lacked the +40% above average volume necessary to trigger a convincing new (or add-on) technical buy signal. Confirming volume-driven gains would be a reassuring sign of fresh institutional buying demand. The prior low ($169.11 on 7/14/20) defines the next important support below its 50 DMA line. Keep in mind it is due to report earnings news after the close on Thursday, on 7/30/20. Volume and volatility often increase near earnings news.
>>> FEATURED STOCK ARTICLE : Consolidating Near High With Earnings News Due Soon - 7/24/2020 |
View all notes |
Set NEW NOTE alert |
Company Profile |
SEC
News |
Chart |
Request a new note
C
A
S
I |
TTD
-
NASDAQ
The Trade Desk Inc Cl A
Comml Svcs-Advertising
|
$427.84
|
+8.38
2.00% |
$432.11
|
700,701
41.22% of 50 DAV
50 DAV is 1,700,000
|
$475.67
-10.06%
|
6/3/2020
|
$340.61
|
PP = $327.35
|
|
MB = $343.72
|
Most Recent Note - 7/28/2020 6:39:16 PM
G - Volume totals have been cooling while consolidating near its all-time high. Very extended from any sound base, and its 50 DMA line ($385) defines near-term support to watch.
>>> FEATURED STOCK ARTICLE : Rebounded Near All-Time High With Gain Backed by Light Volume - 7/20/2020 |
View all notes |
Set NEW NOTE alert |
Company Profile |
SEC
News |
Chart |
Request a new note
C
A
S
I |
DOCU
-
NASDAQ
Docusign Inc
Computer Sftwr-Enterprse
|
$209.15
|
+12.42
6.31% |
$210.48
|
4,522,006
80.31% of 50 DAV
50 DAV is 5,631,000
|
$217.00
-3.62%
|
6/10/2020
|
$149.73
|
PP = $152.10
|
|
MB = $159.71
|
Most Recent Note - 7/29/2020 6:13:24 PM
G - Posted a 3rd consecutive gain today with below average volume. Still very extended from any sound base. Its 50 DMA line ($169) defines near-term support to watch. DOCU is now priced +102% above its 200 DMA price, and it is taught in the Certification that a stock trading +70-100% or more above the 200 DMA is to be recognized as a "sell signal". See the latest FSU analysis for more details and an annotated graph.
>>> FEATURED STOCK ARTICLE : E-Signature Firm is Extended From Any Sound Base - 7/28/2020 |
View all notes |
Set NEW NOTE alert |
Company Profile |
SEC
News |
Chart |
Request a new note
C
A
S
I |
Symbol/Exchange
Company Name
Industry Group |
PRICE |
CHANGE
(%Change) |
Day High |
Volume
(% DAV)
(% 50 day avg vol) |
52 Wk Hi
% From Hi |
Featured
Date |
Price
Featured |
Pivot Featured |
|
Max Buy |
PING
-
NYSE
Ping Identity Hldg Corp
Computer Sftwr-Security
|
$34.35
|
+1.39
4.22% |
$34.62
|
692,083
45.99% of 50 DAV
50 DAV is 1,505,000
|
$35.79
-4.02%
|
6/1/2020
|
$29.24
|
PP = $29.90
|
|
MB = $31.40
|
Most Recent Note - 7/29/2020 6:17:22 PM
G - Posted a gain today with light volume for its second-best ever close. Its 50 DMA line ($30.94) and prior highs in the $29 area define important near-term support. It has not formed a sound base of sufficient length. Completed Secondary Offerings on 7/09/20 and 5/15/20.
>>> FEATURED STOCK ARTICLE : Consolidating Above 50-Day Moving Average Following Secondary - 7/16/2020 |
View all notes |
Set NEW NOTE alert |
Company Profile |
SEC
News |
Chart |
Request a new note
C
A
S
I |
ZEN
-
NYSE
Zendesk Inc
Computer Sftwr-Enterprse
|
$99.32
|
+4.21
4.43% |
$100.34
|
2,102,233
99.87% of 50 DAV
50 DAV is 2,105,000
|
$97.67
1.69%
|
7/21/2020
|
$94.29
|
PP = $94.97
|
|
MB = $99.72
|
Most Recent Note - 7/29/2020 6:27:23 PM
Y - Posted a gain today with average volume for a new all-time high as it challenged it "max buy" level. Due to report Jun '20 quarterly earnings news after the close on Thursday, 7/30/20. Volume and volatility often increase near earnings news.
>>> FEATURED STOCK ARTICLE : Pullback Below Pivot Point Following Breakout Gain - 7/21/2020 |
View all notes |
Set NEW NOTE alert |
Company Profile |
SEC
News |
Chart |
Request a new note
C
A
S
I |
|
|
|
THESE ARE NOT BUY RECOMMENDATIONS!
Comments contained in the body of this report are technical
opinions only. The material herein has been obtained
from sources believed to be reliable and accurate, however,
its accuracy and completeness cannot be guaranteed.
This site is not an investment advisor, hence it does
not endorse or recommend any securities or other investments.
Any recommendation contained in this report may not
be suitable for all investors and it is not to be deemed
an offer or solicitation on our part with respect to
the purchase or sale of any securities. All trademarks,
service marks and trade names appearing in this report
are the property of their respective owners, and are
likewise used for identification purposes only.
This report is a service available
only to active Paid Premium Members.
You may opt-out of receiving report notifications
at any time. Questions or comments may be submitted
by writing to Premium Membership Services 665 S.E. 10 Street, Suite 201 Deerfield Beach, FL 33441-5634 or by calling 1-800-965-8307
or 954-785-1121.
|
|
|