You are not logged in.
This means you
CAN ONLY VIEW reports that were published prior to Sunday, March 23, 2025.
You
MUST UPGRADE YOUR MEMBERSHIP if you want to see any current reports.
AFTER MARKET UPDATE - FRIDAY, JULY 17TH, 2020
Previous After Market Report Next After Market Report >>>
|
|
|
|
DOW |
-62.76 |
26,671.95 |
-0.23% |
|
Volume |
868,884,990 |
+12% |
|
Volume |
4,276,764,400 |
+1% |
|
NASDAQ |
+28.17 |
10,502.00 |
+0.27% |
|
Advancers |
1,609 |
55% |
|
Advancers |
1,933 |
60% |
|
S&P 500 |
+9.16 |
3,224.73 |
+0.28% |
|
Decliners |
1,318 |
45% |
|
Decliners |
1,313 |
40% |
|
Russell 2000 |
+5.76 |
1,473.32 |
+0.39% |
|
52 Wk Highs |
81 |
|
|
52 Wk Highs |
123 |
|
|
S&P 600 |
-0.13 |
847.18 |
-0.02% |
|
52 Wk Lows |
1 |
|
|
52 Wk Lows |
16 |
|
|
 |
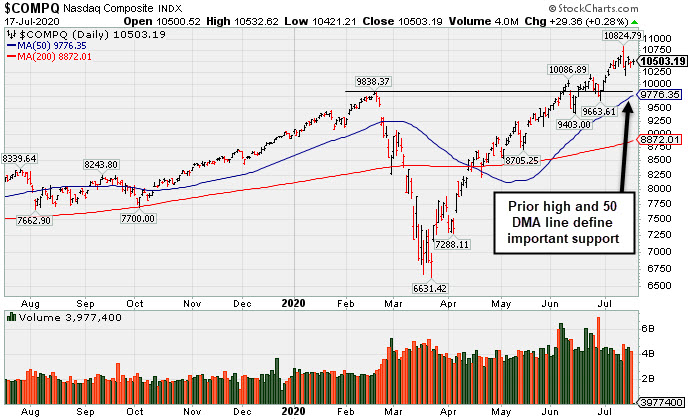
Major Indices Closed Mixed as Leadership Remained Strong
Kenneth J. Gruneisen - Passed the CAN SLIM® Master's Exam
The Dow fell 62 points, but still managed to notch a weekly advance of 2.3%. The S&P 500 rose 0.3%, and capped a five day gain of 1.3%. Meanwhile, the Nasdaq Composite also added 0.3%, however was negative on the week by 1.1%. Breadth was negative as decliners led advancers by an 8-7 margin on the NYSE and 3-2 on the Nasdaq exchange. The reported volume totals were higher than the prior session on the NYSE and on the Nasdaq exchange, inflated by options expirations. There were 60 high-ranked companies from the Leaders List that hit new 52-week highs and were listed on the BreakOuts Page, versus the total of 43 on the prior session. New 52-week highs totals expanded and solidly outnumbered new 52-week lows totals which were in the single digits on the NYSE for a third consecutive session. The major indices are in a confirmed uptrend (M criteria). Any sustainable rally requires a healthy crop of new leaders, so it remains ever-important to see substantial new highs totals. Charts used courtesy of www.stockcharts.com
PICTURED: The Nasdaq Composite Index is perched near its all-time high. Its prior high and 50-day moving average (DMA) line define near-term support to watch. The tech-heavy index is up +17% year-to-date.
U.S. equities ended the day mostly higher Friday as investors digested the latest economic releases and corporate earnings reports. Seven of 11 S&P 500 sectors finished the day in positive territory, with the Utilities and Real Estate groups pacing the gains. In earnings, shares of Netflix slipped 6.5% after the streaming giant topped consensus revenue projections, but offered disappointing forward guidance. BlackRock jumped 3.7% after the world’s largest asset manager saw its profit jump 21% citing strong inflows to its cash management services. Elsewhere, JB Hunt Transport rose 3.2% after the company bested analyst earnings estimates. In other corporate news, the cruise line industry came under pressure after the CDC extended its No Sail Order through the end of September.
On the data front, a flash reading of June consumer sentiment from the University of Michigan unexpectedly fell to 73.2 from last month’s 78.1 reading. Separate releases showed housing starts rose 17.3%, in June, while building permits climbed 2.1% during the same period, with both updates falling short of consensus estimates. Treasuries were mixed with the yield on the 10-year note steady at 0.62%. In commodities, WTI crude lost 0.3% to $40.63/barrel, while gold advanced 0.7% to $1,812.60/ounce.
|
 Kenneth J. Gruneisen started out as a licensed stockbroker in August 1987, a couple of months prior to the historic stock market crash that took the Dow Jones Industrial Average down -22.6% in a single day. He has published daily fact-based fundamental and technical analysis on high-ranked stocks online for two decades. Through FACTBASEDINVESTING.COM, Kenneth provides educational articles, news, market commentary, and other information regarding proven investment systems that work in good times and bad.
Comments contained in the body of this report are technical opinions only and are not necessarily those of Gruneisen Growth Corp. The material herein has been obtained from sources believed to be reliable and accurate, however, its accuracy and completeness cannot be guaranteed. Our firm, employees, and customers may effect transactions, including transactions contrary to any recommendation herein, or have positions in the securities mentioned herein or options with respect thereto. Any recommendation contained in this report may not be suitable for all investors and it is not to be deemed an offer or solicitation on our part with respect to the purchase or sale of any securities. |
|
 |
Tech Sector and Gold & Silver Index Rose
Kenneth J. Gruneisen - Passed the CAN SLIM® Master's Exam
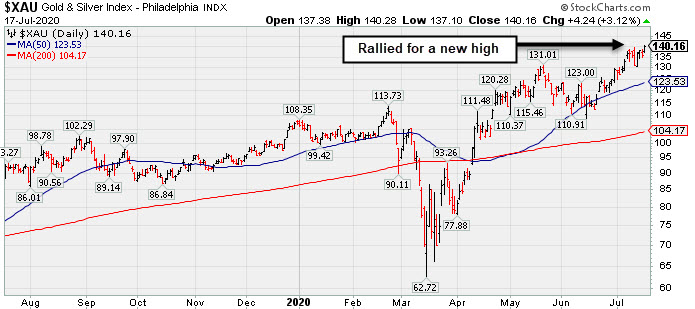
Financials created a drag on the major indices as the Broker/Dealer ($XBD -1.00%) and Bank ($BKX -2.47%) both lost ground. The Retail ($RLX -0.67%) also edged lower. The tech sector saw unanimous gains from the Semiconductor ($SOX +0.66%), Biotech ($BTK +1.16%), and the Networking ($NWX +2.27%). Commodity-linked groups were mixed as the Gold & Silver ($XAU +3.12%) posted a standout gain but the Oil Services ($OSX -1.53%) and Integrated Oil ($XOI -1.43%) both lost ground.
PICTURED: The Gold & Silver ($XAU +3.12%) rallied to a new high.
| Oil Services |
$OSX |
33.47 |
-0.52 |
-1.53% |
-57.25% |
| Integrated Oil |
$XOI |
756.43 |
-10.96 |
-1.43% |
-40.46% |
| Semiconductor |
$SOX |
2,069.52 |
+13.60 |
+0.66% |
+11.89% |
| Networking |
$NWX |
567.44 |
+12.58 |
+2.27% |
-2.74% |
| Broker/Dealer |
$XBD |
285.86 |
-2.88 |
-1.00% |
-1.56% |
| Retail |
$RLX |
3,179.57 |
-21.33 |
-0.67% |
+29.82% |
| Gold & Silver |
$XAU |
140.16 |
+4.24 |
+3.12% |
+31.09% |
| Bank |
$BKX |
73.11 |
-1.85 |
-2.47% |
-35.51% |
| Biotech |
$BTK |
6,040.61 |
+69.55 |
+1.16% |
+19.20% |
|
|
|
 |
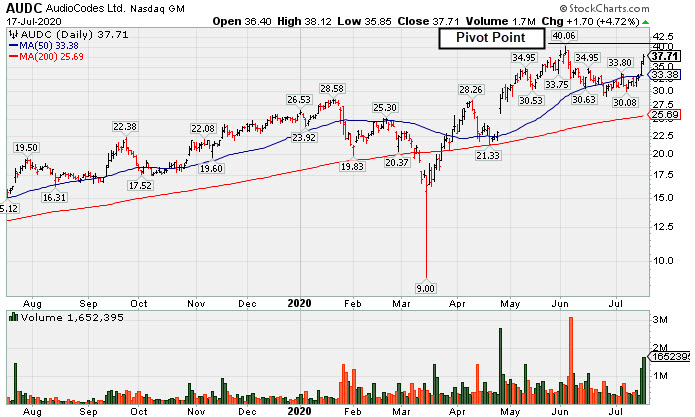
Resilient and High-Ranked VOIP Firm Rebounding Near Highs
Kenneth J. Gruneisen - Passed the CAN SLIM® Master's Exam
Audiocodes Ltd (AUDC +$1.70 or +4.72% to $37.71) was highlighted in yellow in the earlier mid-day report with new pivot point cited based on its 6/03/20 high plus 10 cents. It has been rebounding toward its 52-week high with 4 consecutive gains. Its outlook has improved after recovering above its 50-day moving average (DMA) line ($33.30). Subsequent gains above the pivot point backed by at least +40% above average volume are needed to trigger a technical buy signal.
AUDC completed a new Public Offering on 6/08/20. Fundamentals remain strong after it reported earnings +39% on +12% sales revenues for the Mar '20 quarter. Rebounded impressively after a deep pullback since dropped from the Featured Stocks list on 2/27/20.
Its strong earnings track record has 13 consecutive quarterly comparisons above the +25% minimum guideline (C criteria). Annual earnings growth has been strong and it has a 99 Earnings Per Share Rating.
This Israel-based designer of advanced voice-over-IP products suffered more damaging losses after it was last shown in this FSU section on 1/27/20 with an annotated graph under the headline, "". Its current Up/Down Volume Ratio of 1.0 is an unbiased indication its shares have been neutral concerning accumulation/distributional pressure over the past 50 days.
The number of top-rated funds owning its shares rose from 33 in Mar '18 to 94 in Jun '20, a reassuring sign concerning the I criteria. It has a Timeliness Rating of B and Sponsorship Rating of A. The small supply of 29.5 million shares (S criteria) outstanding can contribute to greater price volatility in the event of institutional buying or selling.
Charts courtesy of www.stockcharts.com
 |
|
|
Color Codes Explained :
Y - Better candidates highlighted by our
staff of experts.
G - Previously featured
in past reports as yellow but may no longer be buyable under the
guidelines.
***Last / Change / Volume data in this table is the closing quote data***
Symbol/Exchange
Company Name
Industry Group |
PRICE |
CHANGE
(%Change) |
Day High |
Volume
(% DAV)
(% 50 day avg vol) |
52 Wk Hi
% From Hi |
Featured
Date |
Price
Featured |
Pivot Featured |
|
Max Buy |
 FTNT
-
NASDAQ
FTNT
-
NASDAQ
Fortinet Inc
Computer Sftwr-Security
|
$129.12
|
+1.77
1.39% |
$129.65
|
1,368,994
73.96% of 50 DAV
50 DAV is 1,851,000
|
$151.95
-15.02%
|
6/22/2020
|
$142.68
|
PP = $149.79
|
|
MB = $157.28
|
Most Recent Note - 7/15/2020 7:28:50 PM
G - Undercut prior lows in the $128 area with today's damaging volume-driven loss raising greater concerns. A rebound above its 50 DMA line ($137.32) is needed for its outlook to improve.
>>> FEATURED STOCK ARTICLE : Best Ever Close With Volume-Driven Gain Approaching Pivot Point - 7/8/2020 |
View all notes |
Set NEW NOTE alert |
Company Profile |
SEC
News |
Chart |
Request a new note
C
A
S
I |
CRL
-
NYSE
Charles River Labs Intl
DRUGS - Biotechnology
|
$196.26
|
+5.56
2.92% |
$197.47
|
358,244
87.59% of 50 DAV
50 DAV is 409,000
|
$195.15
0.57%
|
7/15/2020
|
$192.66
|
PP = $189.95
|
|
MB = $199.45
|
Most Recent Note - 7/15/2020 7:23:32 PM
Y - Finished strong after highlighted in yellow in the earlier mid-day report with a pivot point cited based on its 6/03/20 high plus 10 cents. Hit a new all-time high and closed above the pivot point with s solid gain backed by +71% above average volume triggering a proper technical buy signal. Reported earnings +31% on +17% sales revenues for the Mar '20 quarter, its 2nd quarterly earnings increase above the +25% minimum guideline (C criteria) of the fact-based investment system. It has a 96 Earnings Per Share Rating. Sequential quarterly comparisons show encouraging sales revenues and earnings acceleration. Annual earnings (A criteria) history has been strong and steady. See the latest FSU analysis for more details and a new annotated graph.
>>> FEATURED STOCK ARTICLE : Volume +71% Above Average Behind Breakout - 7/15/2020 |
View all notes |
Set NEW NOTE alert |
Company Profile |
SEC
News |
Chart |
Request a new note
C
A
S
I |
EBS
-
NYSE
Emergent Biosolutions
DRUGS - Biotechnology
|
$104.20
|
+4.73
4.76% |
$106.74
|
1,062,397
167.57% of 50 DAV
50 DAV is 634,000
|
$101.34
2.82%
|
7/7/2020
|
$89.47
|
PP = $93.68
|
|
MB = $98.36
|
 Most Recent Note - 7/17/2020 12:36:58 PM
G - Getting extended from the latest base with today's 4th consecutive gain. Recent gains above the new pivot point cited lacked great volume conviction. Prior high ($93.58 on 6/01/20) defines initial support to watch on pullbacks. Fundamentals remain strong.
>>> FEATURED STOCK ARTICLE : Impressive Rebound to Hit a New High - 7/9/2020 |
View all notes |
Set NEW NOTE alert |
Company Profile |
SEC
News |
Chart |
Request a new note
C
A
S
I |
NBIX
-
NASDAQ
Neurocrine Biosciences
DRUGS - Biotechnology
|
$130.52
|
-2.85
-2.14% |
$134.77
|
737,073
79.68% of 50 DAV
50 DAV is 925,000
|
$136.27
-4.22%
|
5/19/2020
|
$123.71
|
PP = $119.75
|
|
MB = $125.74
|
Most Recent Note - 7/15/2020 7:31:39 PM
G - Gapped up and posted a solid gain today with near average volume for its best ever close. Its 50 DMA line ($121.11) and prior highs in the $119 area define important near-term support to watch. Fundamentals remain strong.
>>> FEATURED STOCK ARTICLE : Pulled Back Below "Max Buy" Level With Loss on Average Volume - 6/30/2020 |
View all notes |
Set NEW NOTE alert |
Company Profile |
SEC
News |
Chart |
Request a new note
C
A
S
I |
BMRN
-
NASDAQ
Biomarin Pharmaceutical
DRUGS - Drug Manufacturers - Other
|
$128.21
|
+0.43
0.34% |
$129.34
|
932,551
57.18% of 50 DAV
50 DAV is 1,631,000
|
$130.04
-1.41%
|
6/17/2020
|
$110.95
|
PP = $112.67
|
|
MB = $118.30
|
Most Recent Note - 7/14/2020 5:29:06 PM
G - Managed a "positive reversal" today and it remains perched near its all-time high, very extended from any sound base. Fundamentals remain strong. Prior high ($112.57) and its 50 DMA line ($109.34) define near-term support to watch on pullbacks.
>>> FEATURED STOCK ARTICLE : Hovering Near High With Volume Totals Cooling - 7/10/2020 |
View all notes |
Set NEW NOTE alert |
Company Profile |
SEC
News |
Chart |
Request a new note
C
A
S
I |
Symbol/Exchange
Company Name
Industry Group |
PRICE |
CHANGE
(%Change) |
Day High |
Volume
(% DAV)
(% 50 day avg vol) |
52 Wk Hi
% From Hi |
Featured
Date |
Price
Featured |
Pivot Featured |
|
Max Buy |
AUDC
-
NASDAQ
Audiocodes Ltd
ELECTRONICS - Scientific and Technical Instrum
|
$37.71
|
+1.70
4.72% |
$38.12
|
1,652,394
259.40% of 50 DAV
50 DAV is 637,000
|
$40.06
-5.87%
|
7/17/2020
|
$37.16
|
PP = $40.16
|
|
MB = $42.17
|
Most Recent Note - 7/17/2020 5:01:41 PM
Y - Finished strong today after highlighted in yellow with new pivot point cited based on its 6/03/20 high plus 10 cents. Rebounding toward its 52-week high with today's 4th consecutive gain. Its outlook has improved after recovering above its 50 DMA line ($33.30). Subsequent gains above the pivot point backed by at least +40% above average volume are needed to trigger a technical buy signal. Completed a new Public Offering on 6/08/20. Fundamentals remain strong after it reported earnings +39% on +12% sales revenues for the Mar '20 quarter. Rebounded impressively after a deep pullback since dropped from the Featured Stocks list on 2/27/20. See the latest FSU analysis for more details and a new annotated graph.
>>> FEATURED STOCK ARTICLE : Resilient and High-Ranked VOIP Firm Rebounding Near Highs - 7/17/2020 |
View all notes |
Set NEW NOTE alert |
Company Profile |
SEC
News |
Chart |
Request a new note
C
A
S
I |
AMD
-
NASDAQ
Advanced Micro Devices
ELECTRONICS - Semiconductor - Broad Line
|
$55.04
|
+0.12
0.22% |
$55.81
|
34,241,367
63.78% of 50 DAV
50 DAV is 53,683,000
|
$59.27
-7.14%
|
6/9/2020
|
$55.41
|
PP = $56.98
|
|
MB = $59.83
|
Most Recent Note - 7/14/2020 5:34:14 PM
Y - Managed a "positive reversal" today after undercutting its 50 DMA line ($53.66). Previously met stubborn resistance in the $57-59 area. Subsequent gains above the pivot point backed by at least +40% above average volume may trigger a technical buy signal.
>>> FEATURED STOCK ARTICLE : Slump Below 50-Day Average Toward Prior Low Raises Concerns - 6/26/2020 |
View all notes |
Set NEW NOTE alert |
Company Profile |
SEC
News |
Chart |
Request a new note
C
A
S
I |
TREX
-
NYSE
Trex Company Inc
MATERIALS and CONSTRUCTION - General Building Materials
|
$134.03
|
+1.44
1.09% |
$134.54
|
379,385
37.56% of 50 DAV
50 DAV is 1,010,000
|
$135.32
-0.95%
|
6/26/2020
|
$109.05
|
PP = $132.94
|
|
MB = $139.59
|
Most Recent Note - 7/14/2020 5:27:09 PM
Y - Posted a solid gain today with light volume. Remains perched near its all-time high. Subsequent volume-driven gains and a close above the pivot point may clinch a new (or add-on) technical buy signal. Important near-term support is at its 50 DMA line ($120.55). Fundamentals remain strong.
>>> FEATURED STOCK ARTICLE : Quietly Perched Near All-Time High After Forming a New Base - 7/6/2020 |
View all notes |
Set NEW NOTE alert |
Company Profile |
SEC
News |
Chart |
Request a new note
C
A
S
I |
NFLX
-
NASDAQ
Netflix Inc
SPECIALTY RETAIL - Music and Video Stores
|
$492.99
|
-34.40
-6.52% |
$503.59
|
24,875,210
344.77% of 50 DAV
50 DAV is 7,215,000
|
$575.37
-14.32%
|
5/14/2020
|
$441.95
|
PP = $449.62
|
|
MB = $472.10
|
Most Recent Note - 7/17/2020 12:51:43 PM
G - Gapped down today after reporting Jun '20 earnings +165% on +25% sales revenues versus the year ago period. Very extended from any sound base. Prior highs in the $458 area define near-term support along with its 50 DMA line ($454.44).
>>> FEATURED STOCK ARTICLE : Powered to New High on Prior Session With Volume Driven Gain - 7/2/2020 |
View all notes |
Set NEW NOTE alert |
Company Profile |
SEC
News |
Chart |
Request a new note
C
A
S
I |
CHGG
-
NYSE
Chegg Inc
Consumer Svcs-Education
|
$73.00
|
+2.00
2.82% |
$73.50
|
1,752,339
43.81% of 50 DAV
50 DAV is 4,000,000
|
$77.42
-5.71%
|
6/17/2020
|
$63.71
|
PP = $68.08
|
|
MB = $71.48
|
Most Recent Note - 7/13/2020 6:29:50 PM
Y - Color code is changed to yellow after pulling back below its "max buy" level with today's loss on average volume. Prior high in the $68 area defines initial support to watch on pullbacks. See the latest FSU analysis for more details and a new annotated graph.
>>> FEATURED STOCK ARTICLE : Negative Reversal After Recently Wedging into New High Territory - 7/13/2020 |
View all notes |
Set NEW NOTE alert |
Company Profile |
SEC
News |
Chart |
Request a new note
C
A
S
I |
Symbol/Exchange
Company Name
Industry Group |
PRICE |
CHANGE
(%Change) |
Day High |
Volume
(% DAV)
(% 50 day avg vol) |
52 Wk Hi
% From Hi |
Featured
Date |
Price
Featured |
Pivot Featured |
|
Max Buy |
LGIH
-
NASDAQ
L G I Homes Inc
Bldg-Resident/Comml
|
$111.48
|
+1.32
1.20% |
$114.49
|
350,098
91.17% of 50 DAV
50 DAV is 384,000
|
$111.43
0.04%
|
7/7/2020
|
$99.19
|
PP = $95.82
|
|
MB = $100.61
|
Most Recent Note - 7/15/2020 7:30:10 PM
G - Rallied further above its "max buy" level with another big gain today on only +7% above average volume. Prior highs in the $95 area define initial support to watch following its recent technical breakout.
>>> FEATURED STOCK ARTICLE : Breakout to New High Backed by 53% Above Average Volume - 7/7/2020 |
View all notes |
Set NEW NOTE alert |
Company Profile |
SEC
News |
Chart |
Request a new note
C
A
S
I |
NOW
-
NYSE
Servicenow Inc
Computer Sftwr-Enterprse
|
$421.81
|
+7.93
1.92% |
$423.40
|
1,089,739
59.22% of 50 DAV
50 DAV is 1,840,000
|
$430.83
-2.09%
|
4/30/2020
|
$343.05
|
PP = $363.05
|
|
MB = $381.20
|
Most Recent Note - 7/16/2020 6:31:26 PM
G - Pulled back from its all-time high with a gap down and loss today on below average volume. It has not formed a sound base. Its 50 DMA line ($393) defines important near-term support to watch where a violation may trigger a technical sell signal.
>>> FEATURED STOCK ARTICLE : Hovering Near All-Time High With Volume Totals Cooling - 6/25/2020 |
View all notes |
Set NEW NOTE alert |
Company Profile |
SEC
News |
Chart |
Request a new note
C
A
S
I |
TEAM
-
NASDAQ
Atlassian Corp Plc Cl A
Comp Sftwr-Spec Enterprs
|
$172.86
|
+1.62
0.95% |
$173.49
|
899,950
47.52% of 50 DAV
50 DAV is 1,894,000
|
$198.41
-12.88%
|
7/7/2020
|
$190.44
|
PP = $191.82
|
|
MB = $201.41
|
Most Recent Note - 7/16/2020 6:27:13 PM
G - Slumped further below its 50 DMA line ($179.85) with today's loss on average volume. A rebound above the 50 DMA line is needed for its outlook to improve after recently triggering a technical sell signal. Recent gains above the pivot point lacked the +40% above average volume necessary to trigger a convincing new (or add-on) technical buy signal. The prior low ($160.20 on 5/27/20) defines its next important support above prior highs in the $156 area.
>>> FEATURED STOCK ARTICLE : 50-Day Moving Average Defines Important Near-Term Support - 6/29/2020 |
View all notes |
Set NEW NOTE alert |
Company Profile |
SEC
News |
Chart |
Request a new note
C
A
S
I |
TTD
-
NASDAQ
The Trade Desk Inc Cl A
Comml Svcs-Advertising
|
$433.03
|
+3.92
0.91% |
$436.83
|
760,418
37.44% of 50 DAV
50 DAV is 2,031,000
|
$475.67
-8.96%
|
6/3/2020
|
$340.61
|
PP = $327.35
|
|
MB = $343.72
|
Most Recent Note - 7/13/2020 6:49:47 PM
G - Suffered a "negative reversal today after hitting a new all-time high. Very extended from any sound base. Its 50 DMA line ($356.80) defines near-term support to watch.
>>> FEATURED STOCK ARTICLE : Pullback Breaks Streak of 8 Straight Gains Into New High Ground - 6/24/2020 |
View all notes |
Set NEW NOTE alert |
Company Profile |
SEC
News |
Chart |
Request a new note
C
A
S
I |
DOCU
-
NASDAQ
Docusign Inc
Computer Sftwr-Enterprse
|
$196.41
|
+4.69
2.45% |
$196.84
|
3,089,716
54.97% of 50 DAV
50 DAV is 5,621,000
|
$217.00
-9.49%
|
6/10/2020
|
$149.73
|
PP = $152.10
|
|
MB = $159.71
|
Most Recent Note - 7/14/2020 12:37:07 PM
G - Abruptly retreated with a big loss on above average volume on the prior session. Very extended from any sound base. Its 50 DMA line ($151.33) defines near-term support to watch on pullbacks. DOCU is now priced +99% above its 200 DMA price, and it is taught in the Certification that a stock trading +70-100% or more above the 200 DMA is to be recognized as a "sell signal".
>>> FEATURED STOCK ARTICLE : Rally From Ascending Base Leaves Stock Very Extended - 7/1/2020 |
View all notes |
Set NEW NOTE alert |
Company Profile |
SEC
News |
Chart |
Request a new note
C
A
S
I |
Symbol/Exchange
Company Name
Industry Group |
PRICE |
CHANGE
(%Change) |
Day High |
Volume
(% DAV)
(% 50 day avg vol) |
52 Wk Hi
% From Hi |
Featured
Date |
Price
Featured |
Pivot Featured |
|
Max Buy |
PING
-
NYSE
Ping Identity Hldg Corp
Computer Sftwr-Security
|
$31.65
|
+1.26
4.15% |
$32.00
|
1,170,081
72.77% of 50 DAV
50 DAV is 1,608,000
|
$35.36
-10.49%
|
6/1/2020
|
$29.24
|
PP = $29.90
|
|
MB = $31.40
|
Most Recent Note - 7/16/2020 6:20:27 PM
Y - Color code is changed to yellow while consolidating above its prior highs in the $29 area and its 50 DMA line ($29.49) which define important near-term support. Priced another Secondary Offering on 7/09/20 after an earlier Secondary Offering on 5/15/20. It has not formed a sound base of sufficient length. See the latest FSU analysis for more details and a new annotated graph.
>>> FEATURED STOCK ARTICLE : Consolidating Above 50-Day Moving Average Following Secondary - 7/16/2020 |
View all notes |
Set NEW NOTE alert |
Company Profile |
SEC
News |
Chart |
Request a new note
C
A
S
I |
AAXN
-
NASDAQ
Axon Enterprise Inc
Security/Sfty
|
$90.72
|
-0.36
-0.40% |
$91.62
|
463,817
34.43% of 50 DAV
50 DAV is 1,347,000
|
$104.90
-13.52%
|
5/8/2020
|
$84.86
|
PP = $90.20
|
|
MB = $94.71
|
Most Recent Note - 7/14/2020 5:33:08 PM
Y - Undercut prior highs in the $90-91 area and managed a "positive reversal" today after testing support at its 50 DMA line ($87.74). More damaging losses would raise concerns and trigger a technical sell signal. Completed a new Public Offering on 6/17/20. See the latest FSU analysis for more details and a new annotated graph.
>>> FEATURED STOCK ARTICLE : Managed Positive Reversal After Testing 50-Day Moving Average - 7/14/2020 |
View all notes |
Set NEW NOTE alert |
Company Profile |
SEC
News |
Chart |
Request a new note
C
A
S
I |
|
|
|
THESE ARE NOT BUY RECOMMENDATIONS!
Comments contained in the body of this report are technical
opinions only. The material herein has been obtained
from sources believed to be reliable and accurate, however,
its accuracy and completeness cannot be guaranteed.
This site is not an investment advisor, hence it does
not endorse or recommend any securities or other investments.
Any recommendation contained in this report may not
be suitable for all investors and it is not to be deemed
an offer or solicitation on our part with respect to
the purchase or sale of any securities. All trademarks,
service marks and trade names appearing in this report
are the property of their respective owners, and are
likewise used for identification purposes only.
This report is a service available
only to active Paid Premium Members.
You may opt-out of receiving report notifications
at any time. Questions or comments may be submitted
by writing to Premium Membership Services 665 S.E. 10 Street, Suite 201 Deerfield Beach, FL 33441-5634 or by calling 1-800-965-8307
or 954-785-1121.
|
|
|