You are not logged in.
This means you
CAN ONLY VIEW reports that were published prior to Sunday, March 23, 2025.
You
MUST UPGRADE YOUR MEMBERSHIP if you want to see any current reports.
AFTER MARKET UPDATE - FRIDAY, JULY 24TH, 2020
Previous After Market Report Next After Market Report >>>
|
|
|
|
DOW |
-182.44 |
26,469.89 |
-0.68% |
|
Volume |
711,326,204 |
-13% |
|
Volume |
4,220,073,600 |
-5% |
|
NASDAQ |
-98.24 |
10,363.18 |
-0.94% |
|
Advancers |
992 |
34% |
|
Advancers |
889 |
28% |
|
S&P 500 |
-20.03 |
3,215.63 |
-0.62% |
|
Decliners |
1,937 |
66% |
|
Decliners |
2,332 |
72% |
|
Russell 2000 |
-22.65 |
1,467.55 |
-1.52% |
|
52 Wk Highs |
45 |
|
|
52 Wk Highs |
41 |
|
|
S&P 600 |
-14.55 |
851.59 |
-1.68% |
|
52 Wk Lows |
5 |
|
|
52 Wk Lows |
27 |
|
|
 |
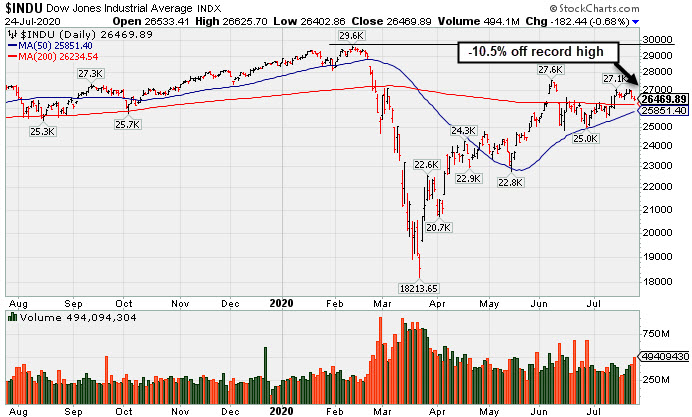
Major Indices Pulled Back With Lighter Volume on Exchanges
Kenneth J. Gruneisen - Passed the CAN SLIM® Master's Exam
The Dow lost 182 points, while the S&P 500 fell 0.6% on Friday, with both benchmarks snapping three-week winning streaks, down 0.8% and 0.3%, respectively. The Nasdaq Composite slid 0.9%, dragging it 1.3% lower on the week.Decliners led advancers by more than a 2-1 margin on the NYSE and by nearly a 3-1 margin on the Nasdaq exchange. The reported volume totals were lighter than the prior session on the NYSE and higher on the Nasdaq exchange, a reassuring indication that institutional selling pressure was not increasing. However, leadership thinned as there were only 18 high-ranked companies from the Leaders List that hit new 52-week highs and were listed on the BreakOuts Page, versus the total of 93 on the prior session. New 52-week highs totals contracted yet still outnumbered new 52-week lows totals on both the NYSE and the Nasdaq exchange. New lows on the NYSE were in the single digits for the fourth consecutive session. The major indices are in a confirmed uptrend (M criteria). Any sustainable rally requires a healthy crop of new leaders, so it remains ever-important to see substantial new highs totals. Charts used courtesy of www.stockcharts.com
PICTURED: The Dow Jones Industrial Average closed -10.5% off its record high.
Stocks finished lower on Friday amid a sell-off in Tech shares and renewed tensions between the world’s two largest economies. Overnight, officials in Beijing ordered the U.S. to shut down its consulate in Chengdu, a move done in retaliation against the U.S. closing the Chinese Houston consulate earlier in the week.
On the data front, flash readings from research firm IHS Markit showed U.S. services sector activity improving in July, albeit by less than expected. The PMI figure came in at 49.6, indicating the sector remained in contraction. Manufacturing PMI climbed back into expansionary territory. Separately, new home sales jumped 13.8% in June. Treasuries were little changed with the yield on the 10-year note steady at 0.58%. In commodities, COMEX gold gained 0.5% to $1,899.60/ounce after surpassing the $1,900/ounce level for the first time since 2011 earlier in the session. In FOREX trading, a gauge of the U.S. dollar hit its weakest point since January.
Ten of 11 S&P 500 sectors closed in negative territory with Technology stocks dragging the most. Intel (INTC -16.24%) tumbled after cautioning investors of a key production delay in a new model of ultra-fast 7nm (nanometer) chips. The news benefitted Advanced Micro Devices (AMD +16.50%), sending shares higher. Meanwhile, the Health Care group lagged ahead of executive orders from President Trump meant to reduce drug prices.
|
 Kenneth J. Gruneisen started out as a licensed stockbroker in August 1987, a couple of months prior to the historic stock market crash that took the Dow Jones Industrial Average down -22.6% in a single day. He has published daily fact-based fundamental and technical analysis on high-ranked stocks online for two decades. Through FACTBASEDINVESTING.COM, Kenneth provides educational articles, news, market commentary, and other information regarding proven investment systems that work in good times and bad.
Comments contained in the body of this report are technical opinions only and are not necessarily those of Gruneisen Growth Corp. The material herein has been obtained from sources believed to be reliable and accurate, however, its accuracy and completeness cannot be guaranteed. Our firm, employees, and customers may effect transactions, including transactions contrary to any recommendation herein, or have positions in the securities mentioned herein or options with respect thereto. Any recommendation contained in this report may not be suitable for all investors and it is not to be deemed an offer or solicitation on our part with respect to the purchase or sale of any securities. |
|
 |
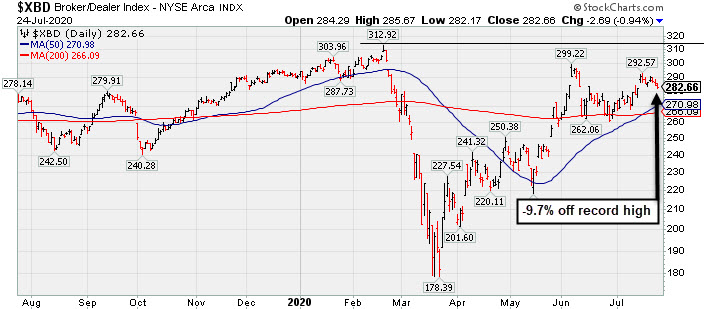
Gold & Silver, Oil Services, and Retail Indexes Notched Gains
Kenneth J. Gruneisen - Passed the CAN SLIM® Master's Exam
The Retail Index ($RLX +0.46%) edged higher as the Gold & Silver Index ($XAU +2.87%) posted a standout gain. Meanwhile, financials created a slight drag on the major indices as the Bank Index ($BKX -0.43%) and Broker/Dealer Index ($XBD -0.94%) both edged lower. Energy-linked shares were mixed as the Oil Services Index ($OSX +0.75%) posted a modest gain but the Integrated Oil Index ($XOI -0.51%) edged lower. The tech sector saw unanimous losses from the Semiconductor Index ($SOX -1.56%), Networking Index ($NWX -1.67%), and the Biotech Index ($BTK -1.82%).
PICTURED: The Broker/Dealer Index ($XBD -0.94%) is consolidating above its 50-day and 200-day moving average (DMA) lines. The index's short-term average recently crossed above the longer-term average, a bullish technical signal termed a "golden cross".
| Oil Services |
$OSX |
37.37 |
+0.28 |
+0.75% |
-52.27% |
| Integrated Oil |
$XOI |
775.72 |
-4.01 |
-0.51% |
-38.95% |
| Semiconductor |
$SOX |
2,038.71 |
-32.26 |
-1.56% |
+10.22% |
| Networking |
$NWX |
582.75 |
-9.91 |
-1.67% |
-0.11% |
| Broker/Dealer |
$XBD |
282.66 |
-2.69 |
-0.94% |
-2.66% |
| Retail |
$RLX |
3,223.07 |
+14.79 |
+0.46% |
+31.59% |
| Gold & Silver |
$XAU |
150.69 |
+4.21 |
+2.87% |
+40.94% |
| Bank |
$BKX |
75.55 |
-0.33 |
-0.43% |
-33.35% |
| Biotech |
$BTK |
5,769.80 |
-107.21 |
-1.82% |
+13.86% |
|
|
|
 |
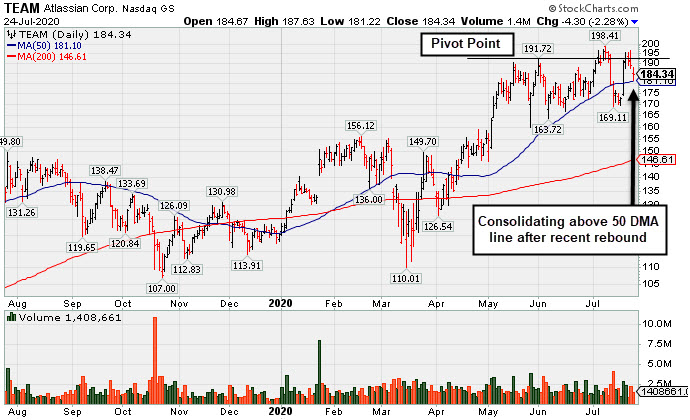
Consolidating Near High With Earnings News Due Soon
Kenneth J. Gruneisen - Passed the CAN SLIM® Master's Exam
Atlassian Corp (TEAM -$4.30 or -2.28% to $184.34 ) pulled back toward its 50-day moving average (DMA) line ($180) with a loss on below average volume. Monday's big gain and rebound above the 50 DMA line helped its outlook to improve and its color code was changed to yellow. It would be a reassuring sign of fresh institutional accumulation to see confirming gains backed by volume. Recent gains above the pivot point lacked the +40% above average volume necessary to trigger a convincing new (or add-on) technical buy signal. The recent low ($169.11 on 7/14/20) now defines important near-term support to watch on pullbacks where any violation may trigger a technical sell signal.
Keep in mind it is due to report its Jun '20 quarterly results on 7/30/20. Volume and volatility often increase near earnings news. TEAM has a 98 Earnings Per Share rating, but fundamental concerns were raised after it recently reported earnings +19% on +33% sales revenues for the Mar '20 quarter, breaking a strong track record of +25% earnings increases (C criteria). This Australia - based software developer had shown 9 consecutive quarterly comparisons above the +25% minimum guideline (C criteria). Its annual earnings (A criteria) history has been strong since its $21 IPO on 12/10/15.
TEAM was last shown in the FSU section on 6/29/20 with an annotated graph under the headline, "50-Day Moving Average Defines Important Near-Term Support" . The number of top-rated funds owning its shares rose from 266 in Sep '17 to 811 in Jun '20, a reassuring sign concerning the I criteria. It has a Timeliness Rating of A and Sponsorship Rating of A. Its current Up/Down Volume Ratio of 1.2 is an unbiased indication its shares have been under accumulation or distribution over the past 50 days. |
|
|
Color Codes Explained :
Y - Better candidates highlighted by our
staff of experts.
G - Previously featured
in past reports as yellow but may no longer be buyable under the
guidelines.
***Last / Change / Volume data in this table is the closing quote data***
Symbol/Exchange
Company Name
Industry Group |
PRICE |
CHANGE
(%Change) |
Day High |
Volume
(% DAV)
(% 50 day avg vol) |
52 Wk Hi
% From Hi |
Featured
Date |
Price
Featured |
Pivot Featured |
|
Max Buy |
 FTNT
-
NASDAQ
FTNT
-
NASDAQ
Fortinet Inc
Computer Sftwr-Security
|
$133.04
|
-2.12
-1.57% |
$134.33
|
914,837
53.50% of 50 DAV
50 DAV is 1,710,000
|
$151.95
-12.44%
|
6/22/2020
|
$142.68
|
PP = $149.79
|
|
MB = $157.28
|
Most Recent Note - 7/20/2020 2:52:37 PM
G - Rebounding with today's gain backed by light volume after undercutting prior lows in the $128 area with last week's losses which raised concerns. A rebound above its 50 DMA line ($138) is needed for its outlook to improve.
>>> FEATURED STOCK ARTICLE : Best Ever Close With Volume-Driven Gain Approaching Pivot Point - 7/8/2020 |
View all notes |
Set NEW NOTE alert |
Company Profile |
SEC
News |
Chart |
Request a new note
C
A
S
I |
CRL
-
NYSE
Charles River Labs Intl
DRUGS - Biotechnology
|
$192.83
|
-5.37
-2.71% |
$197.01
|
255,974
64.97% of 50 DAV
50 DAV is 394,000
|
$202.95
-4.99%
|
7/15/2020
|
$192.66
|
PP = $189.95
|
|
MB = $199.45
|
 Most Recent Note - 7/24/2020 7:34:55 PM
Y - Pulled back today with lighter volume breaking a streak of 5 consecutive gains with below average volume. The prior high ($189.85 on 6/03/20) defines initial support to watch above its 50 DMA line ($180.38).
>>> FEATURED STOCK ARTICLE : Volume +71% Above Average Behind Breakout - 7/15/2020 |
View all notes |
Set NEW NOTE alert |
Company Profile |
SEC
News |
Chart |
Request a new note
C
A
S
I |
EBS
-
NYSE
Emergent Biosolutions
DRUGS - Biotechnology
|
$89.87
|
+0.90
1.01% |
$91.00
|
1,369,105
154.01% of 50 DAV
50 DAV is 889,000
|
$107.16
-16.13%
|
7/7/2020
|
$89.47
|
PP = $93.68
|
|
MB = $98.36
|
Most Recent Note - 7/23/2020 12:20:40 PM
Y - Pulling back today for a 4th consecutive volume-driven loss after a "negative reversal" at its all-time high. Slumping below its pivot point raising concerns The next important support to watch is its 50 DMA line ($83.37). Fundamentals remain strong.
>>> FEATURED STOCK ARTICLE : Impressive Rebound to Hit a New High - 7/9/2020 |
View all notes |
Set NEW NOTE alert |
Company Profile |
SEC
News |
Chart |
Request a new note
C
A
S
I |
NBIX
-
NASDAQ
Neurocrine Biosciences
DRUGS - Biotechnology
|
$125.20
|
-2.95
-2.30% |
$127.19
|
478,242
54.72% of 50 DAV
50 DAV is 874,000
|
$136.27
-8.12%
|
5/19/2020
|
$123.71
|
PP = $119.75
|
|
MB = $125.74
|
Most Recent Note - 7/24/2020 7:31:15 PM
Y - Color code is changed to yellow as it pulled back from its all-time high and below its "max buy" level. Today's 4th consecutive loss on light volume tested its 50 DMA line ($124.10) which defines important near-term support to watch. Fundamentals remain strong.
>>> FEATURED STOCK ARTICLE : Pulled Back Below "Max Buy" Level With Loss on Average Volume - 6/30/2020 |
View all notes |
Set NEW NOTE alert |
Company Profile |
SEC
News |
Chart |
Request a new note
C
A
S
I |
BMRN
-
NASDAQ
Biomarin Pharmaceutical
DRUGS - Drug Manufacturers - Other
|
$122.95
|
-1.54
-1.24% |
$124.99
|
1,180,323
76.74% of 50 DAV
50 DAV is 1,538,000
|
$131.95
-6.82%
|
6/17/2020
|
$110.95
|
PP = $112.67
|
|
MB = $118.30
|
Most Recent Note - 7/23/2020 5:49:24 PM
G - Pulled back from its all-time high with light volume behind today's 3rd consecutive loss. It is extended from any sound base. Fundamentals remain strong. Its 50 DMA line ($114.09) and prior high ($112.57) define near-term support levels to watch.
>>> FEATURED STOCK ARTICLE : Hovering Near High With Volume Totals Cooling - 7/10/2020 |
View all notes |
Set NEW NOTE alert |
Company Profile |
SEC
News |
Chart |
Request a new note
C
A
S
I |
Symbol/Exchange
Company Name
Industry Group |
PRICE |
CHANGE
(%Change) |
Day High |
Volume
(% DAV)
(% 50 day avg vol) |
52 Wk Hi
% From Hi |
Featured
Date |
Price
Featured |
Pivot Featured |
|
Max Buy |
AUDC
-
NASDAQ
Audiocodes Ltd
ELECTRONICS - Scientific and Technical Instrum
|
$41.34
|
-1.52
-3.55% |
$42.33
|
1,025,288
148.59% of 50 DAV
50 DAV is 690,000
|
$44.90
-7.93%
|
7/17/2020
|
$37.16
|
PP = $40.16
|
|
MB = $42.17
|
Most Recent Note - 7/24/2020 12:41:54 PM
Y - Rebounded from the session's early low after briefly undercutting its pivot point. Big volume-driven gain on 7/22/20 backed by +182% above average volume triggered a noted technical buy signal. Completed a new Public Offering on 6/08/20. Due to report Jun '20 quarterly results on 7/28/20. Volume and volatility often increase near earnings news.
>>> FEATURED STOCK ARTICLE : Resilient and High-Ranked VOIP Firm Rebounding Near Highs - 7/17/2020 |
View all notes |
Set NEW NOTE alert |
Company Profile |
SEC
News |
Chart |
Request a new note
C
A
S
I |
AMD
-
NASDAQ
Advanced Micro Devices
ELECTRONICS - Semiconductor - Broad Line
|
$69.40
|
+9.83
16.50% |
$69.94
|
205,038,191
367.66% of 50 DAV
50 DAV is 55,768,000
|
$62.33
11.34%
|
7/22/2020
|
$61.73
|
PP = $59.10
|
|
MB = $62.06
|
Most Recent Note - 7/24/2020 12:36:02 PM
G - Color code is changed to green after quickly rallying above its "max buy" level with today's considerable volume-driven gain. Big gain on 7/22/20 backed by +152% above average volume triggered a noted technical buy signal. New pivot point was cited based on its 6/10/20 high plus 10 cents. Prior highs in the $59 area define initial support above its 50 DMA line ($54.25). See the latest FSU analysis for more details and an annotated graph.
>>> FEATURED STOCK ARTICLE : Pullback After Breakout Gain Backed by +152% Above Average Volume - 7/23/2020 |
View all notes |
Set NEW NOTE alert |
Company Profile |
SEC
News |
Chart |
Request a new note
C
A
S
I |
TREX
-
NYSE
Trex Company Inc
MATERIALS and CONSTRUCTION - General Building Materials
|
$133.42
|
-0.20
-0.15% |
$134.85
|
378,021
39.13% of 50 DAV
50 DAV is 966,000
|
$138.72
-3.82%
|
6/26/2020
|
$109.05
|
PP = $132.94
|
|
MB = $139.59
|
Most Recent Note - 7/21/2020 5:42:24 PM
Y - Pulled back today with lighter volume after wedging to new all-time highs with 5 consecutive gains backed by below average volume. Gains above the pivot point must have at least +40% above average volume to trigger a proper new (or add-on) technical buy signal. Important near-term support is at its 50 DMA line ($122.98). Fundamentals remain strong.
>>> FEATURED STOCK ARTICLE : Quietly Perched Near All-Time High After Forming a New Base - 7/6/2020 |
View all notes |
Set NEW NOTE alert |
Company Profile |
SEC
News |
Chart |
Request a new note
C
A
S
I |
NFLX
-
NASDAQ
Netflix Inc
SPECIALTY RETAIL - Music and Video Stores
|
$480.45
|
+2.87
0.60% |
$487.17
|
7,744,332
98.28% of 50 DAV
50 DAV is 7,880,000
|
$575.37
-16.50%
|
5/14/2020
|
$441.95
|
PP = $449.62
|
|
MB = $472.10
|
Most Recent Note - 7/23/2020 5:52:02 PM
G - Prior highs in the $458 area define near-term support coinciding with its 50 DMA line ($458.79). Pulling back toward its "max buy" level after getting very extended from the prior base. Consolidating after reporting Jun '20 earnings +165% on +25% sales revenues versus the year ago period.
>>> FEATURED STOCK ARTICLE : Powered to New High on Prior Session With Volume Driven Gain - 7/2/2020 |
View all notes |
Set NEW NOTE alert |
Company Profile |
SEC
News |
Chart |
Request a new note
C
A
S
I |
CHGG
-
NYSE
Chegg Inc
Consumer Svcs-Education
|
$73.42
|
-1.21
-1.62% |
$74.22
|
1,895,652
53.81% of 50 DAV
50 DAV is 3,523,000
|
$79.09
-7.17%
|
6/17/2020
|
$63.71
|
PP = $68.08
|
|
MB = $71.48
|
Most Recent Note - 7/20/2020 2:03:06 PM
G - Color code is changed to green after rallying well above its "max buy" level with today's 4th consecutive gain. Prior high in the $68 area defines initial support to watch above its 50 DMA line ($64.89).
>>> FEATURED STOCK ARTICLE : Negative Reversal After Recently Wedging into New High Territory - 7/13/2020 |
View all notes |
Set NEW NOTE alert |
Company Profile |
SEC
News |
Chart |
Request a new note
C
A
S
I |
Symbol/Exchange
Company Name
Industry Group |
PRICE |
CHANGE
(%Change) |
Day High |
Volume
(% DAV)
(% 50 day avg vol) |
52 Wk Hi
% From Hi |
Featured
Date |
Price
Featured |
Pivot Featured |
|
Max Buy |
LGIH
-
NASDAQ
L G I Homes Inc
Bldg-Resident/Comml
|
$113.93
|
+1.17
1.04% |
$115.39
|
199,778
53.70% of 50 DAV
50 DAV is 372,000
|
$120.54
-5.48%
|
7/7/2020
|
$99.19
|
PP = $95.82
|
|
MB = $100.61
|
Most Recent Note - 7/22/2020 5:49:46 PM
G - Hit another new all-time high with today's gain backed by average volume, getting more extended from the previously noted base. Prior highs in the $95 area define initial support to watch on pullbacks.
>>> FEATURED STOCK ARTICLE : Breakout to New High Backed by 53% Above Average Volume - 7/7/2020 |
View all notes |
Set NEW NOTE alert |
Company Profile |
SEC
News |
Chart |
Request a new note
C
A
S
I |
NOW
-
NYSE
Servicenow Inc
Computer Sftwr-Enterprse
|
$425.19
|
-5.66
-1.31% |
$430.31
|
1,003,567
57.15% of 50 DAV
50 DAV is 1,756,000
|
$454.70
-6.49%
|
4/30/2020
|
$343.05
|
PP = $363.05
|
|
MB = $381.20
|
Most Recent Note - 7/22/2020 5:42:19 PM
G - Perched near its all-time high following a big gain on 7/20/20 backed by +72% above average volume. It has not formed a sound base. Its 50 DMA line ($398) defines important near-term support to watch where a violation may trigger a technical sell signal. See the latest FSU analysis for more details and a new annotated graph.
>>> FEATURED STOCK ARTICLE : Perched Near All-Time High With Earnings News Due Next Week - 7/22/2020 |
View all notes |
Set NEW NOTE alert |
Company Profile |
SEC
News |
Chart |
Request a new note
C
A
S
I |
TEAM
-
NASDAQ
Atlassian Corp Plc Cl A
Comp Sftwr-Spec Enterprs
|
$184.34
|
-4.30
-2.28% |
$187.63
|
1,408,673
74.22% of 50 DAV
50 DAV is 1,898,000
|
$198.41
-7.09%
|
7/7/2020
|
$190.44
|
PP = $191.82
|
|
MB = $201.41
|
Most Recent Note - 7/24/2020 7:23:26 PM
Y - Pulled back toward its its 50 DMA line ($181.10) with a loss today on light volume. Recent rebound above its 50 DMA line helped its outlook to improve and its color code was changed to yellow. Recent gains above the pivot point lacked the +40% above average volume necessary to trigger a convincing new (or add-on) technical buy signal. Confirming volume-driven gains would be a reassuring sign of fresh institutional buying demand. The prior low ($169.11 on 7/14/20) defines the next important support below its 50 DMA line. Keep in mind it is due to report earnings news on 7/30/20. See the latest FSU analysis for more details and a new annotated graph.
>>> FEATURED STOCK ARTICLE : Consolidating Near High With Earnings News Due Soon - 7/24/2020 |
View all notes |
Set NEW NOTE alert |
Company Profile |
SEC
News |
Chart |
Request a new note
C
A
S
I |
TTD
-
NASDAQ
The Trade Desk Inc Cl A
Comml Svcs-Advertising
|
$426.07
|
+1.68
0.40% |
$433.40
|
977,257
54.84% of 50 DAV
50 DAV is 1,782,000
|
$475.67
-10.43%
|
6/3/2020
|
$340.61
|
PP = $327.35
|
|
MB = $343.72
|
Most Recent Note - 7/23/2020 5:39:38 PM
G - Retreated from near its all-time high with today's loss on higher (but below average) volume. Very extended from any sound base, and its 50 DMA line ($378) defines near-term support to watch.
>>> FEATURED STOCK ARTICLE : Rebounded Near All-Time High With Gain Backed by Light Volume - 7/20/2020 |
View all notes |
Set NEW NOTE alert |
Company Profile |
SEC
News |
Chart |
Request a new note
C
A
S
I |
DOCU
-
NASDAQ
Docusign Inc
Computer Sftwr-Enterprse
|
$190.95
|
-7.54
-3.80% |
$194.74
|
3,982,642
70.63% of 50 DAV
50 DAV is 5,639,000
|
$217.00
-12.00%
|
6/10/2020
|
$149.73
|
PP = $152.10
|
|
MB = $159.71
|
Most Recent Note - 7/24/2020 7:26:05 PM
G - Gapped down today as it suffered another loss on light volume. It is very extended from any sound base. Its 50 DMA line ($164.50) defines near-term support to watch. DOCU is now priced +88% above its 200 DMA price, and it is taught in the Certification that a stock trading +70-100% or more above the 200 DMA is to be recognized as a "sell signal".
>>> FEATURED STOCK ARTICLE : Rally From Ascending Base Leaves Stock Very Extended - 7/1/2020 |
View all notes |
Set NEW NOTE alert |
Company Profile |
SEC
News |
Chart |
Request a new note
C
A
S
I |
Symbol/Exchange
Company Name
Industry Group |
PRICE |
CHANGE
(%Change) |
Day High |
Volume
(% DAV)
(% 50 day avg vol) |
52 Wk Hi
% From Hi |
Featured
Date |
Price
Featured |
Pivot Featured |
|
Max Buy |
PING
-
NYSE
Ping Identity Hldg Corp
Computer Sftwr-Security
|
$32.77
|
-0.08
-0.24% |
$33.00
|
611,780
37.86% of 50 DAV
50 DAV is 1,616,000
|
$35.79
-8.44%
|
6/1/2020
|
$29.24
|
PP = $29.90
|
|
MB = $31.40
|
Most Recent Note - 7/23/2020 5:46:22 PM
G - Had "negative reversals" on Tuesday and again today for losses on light volume. Its 50 DMA line ($30.18) and prior highs in the $29 area define important near-term support. It is extended from any sound base. Completed Secondary Offerings on 7/09/20 and 5/15/20.
>>> FEATURED STOCK ARTICLE : Consolidating Above 50-Day Moving Average Following Secondary - 7/16/2020 |
View all notes |
Set NEW NOTE alert |
Company Profile |
SEC
News |
Chart |
Request a new note
C
A
S
I |
AAXN
-
NASDAQ
Axon Enterprise Inc
Security/Sfty
|
$85.62
|
-1.91
-2.18% |
$87.47
|
664,772
52.43% of 50 DAV
50 DAV is 1,268,000
|
$104.90
-18.38%
|
5/8/2020
|
$84.86
|
PP = $90.20
|
|
MB = $94.71
|
Most Recent Note - 7/22/2020 5:45:36 PM
G - Color code is changed to green after slumping to a close below its 50 DMA line ($89.89) with today's loss on below average volume. More damaging losses below the prior low ($887.75 on 7/14/20) would raise serious concerns and trigger a technical sell signal. Completed a new Public Offering on 6/17/20.
>>> FEATURED STOCK ARTICLE : Managed Positive Reversal After Testing 50-Day Moving Average - 7/14/2020 |
View all notes |
Set NEW NOTE alert |
Company Profile |
SEC
News |
Chart |
Request a new note
C
A
S
I |
ZEN
-
NYSE
Zendesk Inc
Computer Sftwr-Enterprse
|
$94.12
|
-0.69
-0.73% |
$94.82
|
2,417,234
115.93% of 50 DAV
50 DAV is 2,085,000
|
$97.67
-3.63%
|
7/21/2020
|
$94.29
|
PP = $94.97
|
|
MB = $99.72
|
Most Recent Note - 7/21/2020 5:35:39 PM
Y - Finished with a loss today backed by +30% above average volume after highlighted in yellow with pivot point cited based on its 7/10/20 high plus 10 cents. It hit new 52-week and all-time highs on the prior session with a gain backed by +70% above average volume triggering a technical buy signal. Quarterly earnings comparisons through Mar '20 have been above year ago periods by more than the +25% minimum guideline (C criteria). After years of shrinking losses it reported solid earnings in FY '18 and '19 (A criteria). Increasing institutional ownership (I criteria) is a reassuring sign. See the latest FSU analysis for more details and a new annotated graph.
>>> FEATURED STOCK ARTICLE : Pullback Below Pivot Point Following Breakout Gain - 7/21/2020 |
View all notes |
Set NEW NOTE alert |
Company Profile |
SEC
News |
Chart |
Request a new note
C
A
S
I |
|
|
|
THESE ARE NOT BUY RECOMMENDATIONS!
Comments contained in the body of this report are technical
opinions only. The material herein has been obtained
from sources believed to be reliable and accurate, however,
its accuracy and completeness cannot be guaranteed.
This site is not an investment advisor, hence it does
not endorse or recommend any securities or other investments.
Any recommendation contained in this report may not
be suitable for all investors and it is not to be deemed
an offer or solicitation on our part with respect to
the purchase or sale of any securities. All trademarks,
service marks and trade names appearing in this report
are the property of their respective owners, and are
likewise used for identification purposes only.
This report is a service available
only to active Paid Premium Members.
You may opt-out of receiving report notifications
at any time. Questions or comments may be submitted
by writing to Premium Membership Services 665 S.E. 10 Street, Suite 201 Deerfield Beach, FL 33441-5634 or by calling 1-800-965-8307
or 954-785-1121.
|
|
|