You are not logged in.
This means you
CAN ONLY VIEW reports that were published prior to Monday, February 26, 2024.
You
MUST UPGRADE YOUR MEMBERSHIP if you want to see any current reports.
AFTER MARKET UPDATE - MONDAY, JULY 25TH, 2022
Previous After Market Report Next After Market Report >>>
|
|
|
|
DOW |
+90.75 |
31,990.04 |
+0.28% |
|
Volume |
784,712,005 |
-5% |
|
Volume |
4,178,779,000 |
-11% |
|
NASDAQ |
-51.45 |
11,782.67 |
-0.43% |
|
Advancers |
1,868 |
60% |
|
Advancers |
2,175 |
49% |
|
S&P 500 |
+5.09 |
3,966.72 |
+0.13% |
|
Decliners |
1,243 |
40% |
|
Decliners |
2,280 |
51% |
|
Russell 2000 |
+10.89 |
1,817.77 |
+0.60% |
|
52 Wk Highs |
25 |
|
|
52 Wk Highs |
55 |
|
|
S&P 600 |
+7.90 |
1,193.12 |
+0.67% |
|
52 Wk Lows |
60 |
|
|
52 Wk Lows |
149 |
|
|
 |
Major Averages Edge Higher With Lighter Volume Totals
Kenneth J. Gruneisen - Passed the CAN SLIM® Master's Exam
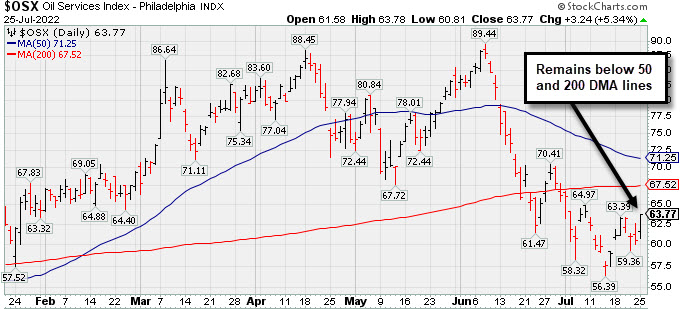
The S&P 500 inched 0.1% higher, while the Dow added 90 points. The Nasdaq Composite retreated 0.4%, as Tech shares underperformed. All three indexes remain on track for their best month of the year. The volume totals reported were lighter than the prior session on the NYSE and on the Nasdaq exchange, revealing lackluster institutional buying demand. Breadth was positive as advancers led decliners by a 3-2 margin on the NYSE. however, decliners narrowly outnumbered advancers on the Nasdaq exchange. There were 10 high-ranked companies from the Leaders List that hit new 52-week high and were listed on the BreakOuts Page, versus the total of 7 on the prior session. New 52-week lows totals expanded and outnumbered new 52-week highs totals on the NYSE and on the Nasdaq exchange. The market uptrend is under pressure (M criteria). Any sustainable rally requires a healthy crop of leading stocks hitting new highs, but leadership has been very thin.
Chart courtesy of www.stockcharts.com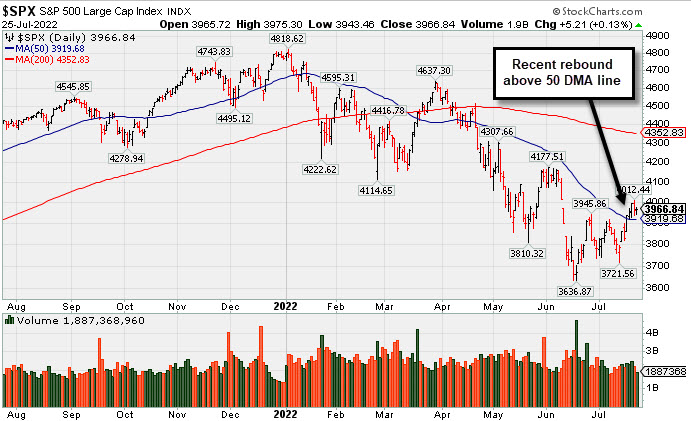 PICTURED: The S&P 500 Index recently rebounded above its 50-day moving average (DMA) line. It remains well below its 200 DMA line.
U.S. stocks fluctuated on Monday as investors braced for a busy week of earnings and the Federal Reserve’s (Fed) upcoming meeting. The Fed is expected to hike rates by 75-basis points (0.75%) on Wednesday, as officials aim to combat inflation. On the data front, the Chicago Fed National Activity Index came in unchanged at -0.19 in June. On Thursday, an update on second-quarter U.S. Gross Domestic Product should garner attention as a looming recession remains front of mind. Treasuries weakened, with the yield on the 10-year note up five basis points (0.05%) to 2.81%. The two-year note yield rose four basis points (0.04%) to 3.02%. Notably, the inversion between the two yields is near its most negative territory since 2000.
In earnings, roughly a third of S&P 500 companies will report this week. Newmont Corp. (NEM -13.23%) fell after posting a quarterly loss that was down nearly 41% from last year. Eight of 11 S&P 500 sectors closed in positive territory, with Energy outperforming amid a back-up in oil prices. West Texas Intermediate crude climbed 2.2% to $96.78/barrel.
Last Friday, all three averages posted their best weekly performance in a month. Contrarian buy signals supported risk assets, while better-than-feared profit tallies aided sentiment. Still, an inversion of the yield curve persisted as the European Central Bank’s rate hike and disappointing economic data fueled recessionary worries. However, a retreating U.S. dollar offered a bright spot.
|
 Kenneth J. Gruneisen started out as a licensed stockbroker in August 1987, a couple of months prior to the historic stock market crash that took the Dow Jones Industrial Average down -22.6% in a single day. He has published daily fact-based fundamental and technical analysis on high-ranked stocks online for two decades. Through FACTBASEDINVESTING.COM, Kenneth provides educational articles, news, market commentary, and other information regarding proven investment systems that work in good times and bad.
Comments contained in the body of this report are technical opinions only and are not necessarily those of Gruneisen Growth Corp. The material herein has been obtained from sources believed to be reliable and accurate, however, its accuracy and completeness cannot be guaranteed. Our firm, employees, and customers may effect transactions, including transactions contrary to any recommendation herein, or have positions in the securities mentioned herein or options with respect thereto. Any recommendation contained in this report may not be suitable for all investors and it is not to be deemed an offer or solicitation on our part with respect to the purchase or sale of any securities. |
|
 |
Bank Index and Energy-Linked Indexes Rose
Kenneth J. Gruneisen - Passed the CAN SLIM® Master's Exam
The Bank Index ($BKX +1.31%) posted a solid gain and the Broker/Dealer Index ($XBD +0.15%) inched higher while the Retail Index ($RLX -0.74%) suffered a modest loss. The Semiconductor Index ($SOX -0.61%) edged lower while the Biotech Index ($BTK -0.05%) and Networking Index ($NWX +0.16%) both were little changed. Commodity-linked groups were mixed as the Oil Services Index ($OSX +5.34%) and Integrated Oil Index ($XOI +4.02%) both posted solid gains while the Gold & Silver Index ($XAU -2.34%) lost ground.
PICTURED: The Oil Services Index ($OSX +5.34%) recently slumped to its 2022 low and rebounded a little, but remains below its 50-day and 200-day moving average (DMA) lines.
| Oil Services |
$OSX |
63.77 |
+3.24 |
+5.34% |
+20.95% |
| Integrated Oil |
$XOI |
1,510.46 |
+58.35 |
+4.02% |
+28.20% |
| Semiconductor |
$SOX |
2,825.03 |
-17.38 |
-0.61% |
-28.41% |
| Networking |
$NWX |
727.96 |
+1.16 |
+0.16% |
-25.04% |
| Broker/Dealer |
$XBD |
414.06 |
+0.63 |
+0.15% |
-14.95% |
| Retail |
$RLX |
3,183.94 |
-23.69 |
-0.74% |
-24.67% |
| Gold & Silver |
$XAU |
100.64 |
-2.41 |
-2.34% |
-24.01% |
| Bank |
$BKX |
107.56 |
+1.39 |
+1.31% |
-18.65% |
| Biotech |
$BTK |
4,712.94 |
-2.49 |
-0.05% |
-14.60% |
|
|
|
 |
Featured Stocks
Kenneth J. Gruneisen - Passed the CAN SLIM® Master's Exam
|
|
|
Color Codes Explained :
Y - Better candidates highlighted by our
staff of experts.
G - Previously featured
in past reports as yellow but may no longer be buyable under the
guidelines.
***Last / Change / Volume data in this table is the closing quote data***
Symbol/Exchange
Company Name
Industry Group |
PRICE |
CHANGE
(%Change) |
Day High |
Volume
(% DAV)
(% 50 day avg vol) |
52 Wk Hi
% From Hi |
Featured
Date |
Price
Featured |
Pivot Featured |
|
Max Buy |
 LLY
-
NYSE
LLY
-
NYSE
Eli Lilly & Co
Medical-Diversified
|
$331.46
|
+2.71
0.82% |
$332.27
|
1,479,912
50.94% of 50 DAV
50 DAV is 2,905,000
|
$335.33
-1.15%
|
5/16/2022
|
$302.46
|
PP = $314.10
|
|
MB = $329.81
|
 Most Recent Note - 7/25/2022 4:16:50 PM
G - Posted a 3rd consecutive quiet gain today and its color code is changed to green after inching above its "max buy" level. Its 50 DMA line ($312) defines near-term support to watch.
>>> FEATURED STOCK ARTICLE : Hovering Near "Max Buy" Level With Volume Totals Cooling - 7/22/2022 |
View all notes |
Set NEW NOTE alert |
Company Profile |
SEC
News |
Chart |
Request a new note
C
A
S
I |
IMXI
-
NASDAQ
International Money Exp
Financial Svcs-Specialty
|
$22.88
|
-0.26
-1.12% |
$23.39
|
319,675
77.22% of 50 DAV
50 DAV is 414,000
|
$23.52
-2.72%
|
7/1/2022
|
$21.27
|
PP = $21.38
|
|
MB = $22.45
|
Most Recent Note - 7/25/2022 4:15:24 PM
Y - Pulled back with lighter volume today after 6 consecutive gains for new 52-week highs marked by higher volume. Held its ground after it recently broke out of a "double bottom" base. Its 50 DMA line ($20.60) defines important near-term support to watch. Fundamentals through the Mar '22 quarter have been strong.
>>> FEATURED STOCK ARTICLE : Stalled Since Clearing Double Bottom Base - 7/15/2022 |
View all notes |
Set NEW NOTE alert |
Company Profile |
SEC
News |
Chart |
Request a new note
C
A
S
I |
HRMY
-
NASDAQ
Harmony Biosciences Hldg
Medical-Biomed/Biotech
|
$50.75
|
-0.27
-0.53% |
$51.50
|
567,975
120.85% of 50 DAV
50 DAV is 470,000
|
$57.13
-11.17%
|
7/6/2022
|
$54.12
|
PP = $52.85
|
|
MB = $55.49
|
Most Recent Note - 7/25/2022 4:13:49 PM
Y - Pulled back for a 3rd consecutive loss and today's loss had above average volume while undercutting the 7/19/22 low ($50.18) raising greater concerns. The next near-term support to watch is its 50 DMA line ($47.17).
>>> FEATURED STOCK ARTICLE : Harmony Has Been Encountering Distributional Pressure - 7/18/2022 |
View all notes |
Set NEW NOTE alert |
Company Profile |
SEC
News |
Chart |
Request a new note
C
A
S
I |
CI
-
NYSE
Cigna Corp
Medical-Managed Care
|
$272.63
|
+3.43
1.27% |
$274.92
|
1,317,394
67.63% of 50 DAV
50 DAV is 1,948,000
|
$282.33
-3.44%
|
7/7/2022
|
$276.55
|
PP = $273.68
|
|
MB = $287.36
|
Most Recent Note - 7/25/2022 4:11:13 PM
Y - Posted a 2nd gain with lighter volume today, rebounding near prior highs in the $273 area. Tested support at its 50 DMA line ($263.65) twice following a recent technical breakout. More damaging losses would raise greater concerns.
>>> FEATURED STOCK ARTICLE : Pulled Back and Tested Support at 50-Day Moving Average - 7/19/2022 |
View all notes |
Set NEW NOTE alert |
Company Profile |
SEC
News |
Chart |
Request a new note
C
A
S
I |
AN
-
NYSE
Autonation Inc
SPECIALTY RETAIL - Auto Dealerships
|
$114.06
|
-3.01
-2.57% |
$120.83
|
885,436
117.43% of 50 DAV
50 DAV is 754,000
|
$133.48
-14.55%
|
7/20/2022
|
$122.03
|
PP = $126.49
|
|
MB = $132.81
|
Most Recent Note - 7/25/2022 4:09:31 PM
G - Suffered a 3rd volume-driven loss in the span of 4 sessions and its color code is changed to green after slumping back below its 50 DMA line ($116). A prompt rebound above the 50 DMA line is needed for its outlook to improve. Subsequent volume-driven gains above the pivot point may trigger a technical buy signal. Reported Jun '22 quarterly earnings +34% on -2% sales revenues versus the year ago period. Faces some resistance due to overhead supply up to the $133 level.
>>> FEATURED STOCK ARTICLE : Autonation Earnings Due While Perched Near Pivot Point - 7/20/2022 |
View all notes |
Set NEW NOTE alert |
Company Profile |
SEC
News |
Chart |
Request a new note
C
A
S
I |
Symbol/Exchange
Company Name
Industry Group |
PRICE |
CHANGE
(%Change) |
Day High |
Volume
(% DAV)
(% 50 day avg vol) |
52 Wk Hi
% From Hi |
Featured
Date |
Price
Featured |
Pivot Featured |
|
Max Buy |
|
|
|
THESE ARE NOT BUY RECOMMENDATIONS!
Comments contained in the body of this report are technical
opinions only. The material herein has been obtained
from sources believed to be reliable and accurate, however,
its accuracy and completeness cannot be guaranteed.
This site is not an investment advisor, hence it does
not endorse or recommend any securities or other investments.
Any recommendation contained in this report may not
be suitable for all investors and it is not to be deemed
an offer or solicitation on our part with respect to
the purchase or sale of any securities. All trademarks,
service marks and trade names appearing in this report
are the property of their respective owners, and are
likewise used for identification purposes only.
This report is a service available
only to active Paid Premium Members.
You may opt-out of receiving report notifications
at any time. Questions or comments may be submitted
by writing to Premium Membership Services 665 S.E. 10 Street, Suite 201 Deerfield Beach, FL 33441-5634 or by calling 1-800-965-8307
or 954-785-1121.
|
|
|