You are not logged in.
This means you
CAN ONLY VIEW reports that were published prior to Sunday, April 6, 2025.
You
MUST UPGRADE YOUR MEMBERSHIP if you want to see any current reports.
AFTER MARKET UPDATE - TUESDAY, JULY 26TH, 2022
Previous After Market Report Next After Market Report >>>
|
|
|
|
DOW |
-228.50 |
31,761.54 |
-0.71% |
|
Volume |
819,213,787 |
+4% |
|
Volume |
4,262,755,900 |
+2% |
|
NASDAQ |
-220.09 |
11,562.57 |
-1.87% |
|
Advancers |
1,193 |
39% |
|
Advancers |
1,618 |
38% |
|
S&P 500 |
-45.79 |
3,921.05 |
-1.15% |
|
Decliners |
1,874 |
61% |
|
Decliners |
2,656 |
62% |
|
Russell 2000 |
-12.53 |
1,805.25 |
-0.69% |
|
52 Wk Highs |
21 |
|
|
52 Wk Highs |
52 |
|
|
S&P 600 |
-6.57 |
1,186.55 |
-0.55% |
|
52 Wk Lows |
70 |
|
|
52 Wk Lows |
172 |
|
|
 |
Major Averages Fell With Volume Totals Picking Up
Kenneth J. Gruneisen - Passed the CAN SLIM® Master's Exam
The S&P 500 slid 1.2%, still on course for its best month since March (+3.6%). The Nasdaq Composite fell 1.9%, while the Dow lost 228 points. The volume totals reported were higher than the prior session on the NYSE and on the Nasdaq exchange, revealing an increase in institutional selling pressure. Breadth was negative as decliners led advancers by a 3-2 margin on the NYSE and 5-3 on the Nasdaq exchange. There were 10 high-ranked companies from the Leaders List that hit new 52-week highs and were listed on the BreakOuts Page, matching the total of 10 on the prior session. New 52-week lows totals expanded and outnumbered new 52-week highs totals on the NYSE and on the Nasdaq exchange. The market uptrend is under pressure (M criteria). Any sustainable rally requires a healthy crop of leading stocks hitting new highs, but leadership has been very thin.
Chart courtesy of www.stockcharts.com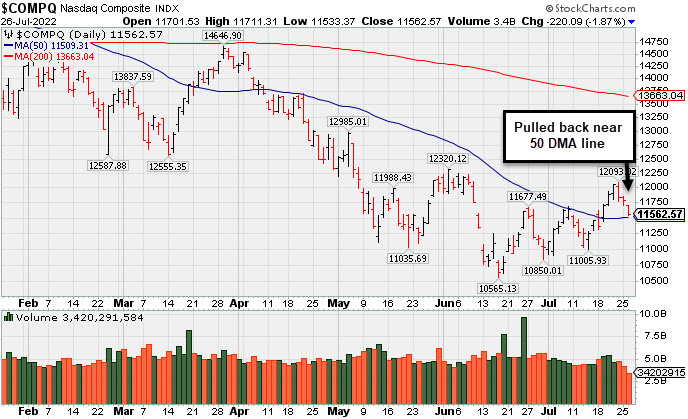 PICTURED: The Nasdaq Composite Index pulled back toward its 50-day moving average (DMA) line with higher volume (closing volume not shown on graph). It remains well below its 200 DMA line.
U.S. stocks finished lower on Tuesday as a key earnings report flagged inflationary headwinds weighing on consumer spending. Treasuries were mixed, with the yield on the 10-year note unchanged at 2.80% ahead of tomorrow’s Federal Reserve (Fed) policy decision.
Eight of 11 S&P 500 sectors closed in negative territory, with Consumer Discretionary shares leading the downturn. In earnings, Walmart Inc. dropped 7.6% after slashing its quarterly and full-year profit estimates, with the big box chain warning that rising food costs were causing consumers to dial back spending on higher-margin discretionary merchandise. The report also pressured shares of other retailers and overshadowed upbeat results from some consumer-focused companies, such as McDonald’s Corp (MCD +2.68%). and Coca-Cola Co (KO +1.64%). Elsewhere, General Electric Co.(GE +4.61%) rose after its earnings and revenue came in well above analyst expectations, while 3M Co. (MMM +4.94%) rose on news it would spin off of its health care business.
On the data front, an update from the Conference Board showed consumer confidence declined for a third straight period, dropping to a 17-month low of 95.7 in July. Separately, a reading on manufacturing activity in the Richmond Fed region unexpectedly improved this month. In the real estate realm, new home sales fell a worse-than-anticipated 8.1% in June to a trough not seen since April 2020. Meanwhile, dual updates on U.S. home prices revealed growth decelerating somewhat in May. In commodities, West Texas Intermediate crude retreated 1.7% to $95.02/barrel as a gauge of the U.S. dollar climbed 0.7%.
|
 Kenneth J. Gruneisen started out as a licensed stockbroker in August 1987, a couple of months prior to the historic stock market crash that took the Dow Jones Industrial Average down -22.6% in a single day. He has published daily fact-based fundamental and technical analysis on high-ranked stocks online for two decades. Through FACTBASEDINVESTING.COM, Kenneth provides educational articles, news, market commentary, and other information regarding proven investment systems that work in good times and bad.
Comments contained in the body of this report are technical opinions only and are not necessarily those of Gruneisen Growth Corp. The material herein has been obtained from sources believed to be reliable and accurate, however, its accuracy and completeness cannot be guaranteed. Our firm, employees, and customers may effect transactions, including transactions contrary to any recommendation herein, or have positions in the securities mentioned herein or options with respect thereto. Any recommendation contained in this report may not be suitable for all investors and it is not to be deemed an offer or solicitation on our part with respect to the purchase or sale of any securities. |
|
 |
Retail, Financial, Semiconductor, and Energy-Linked Groups Fell
Kenneth J. Gruneisen - Passed the CAN SLIM® Master's Exam
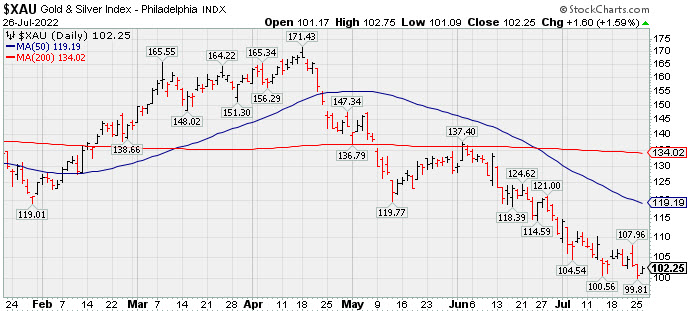
The Retail Index ($RLX -4.21%) suffered a big loss that weighed on the major averages while the Broker/Dealer Index ($XBD -1.74%) and Bank Index ($BKX -2.18%) also lost ground. The Semiconductor Index ($SOX -1.63%) led the tech sector lower while the Networking Index ($NWX -0.27%) suffered a smaller loss and the Biotech Index ($BTK +0.05%) finished flat. Commodity-linked groups were mixed as the Gold & Silver Index ($XAU +1.59%) posted a gain while the Oil Services Index ($OSX -0.51%) and Integrated Oil Index ($XOI -1.07%) both lost ground.
PICTURED: The Gold & Silver Index ($XAU +1.59%) posted a gain but it has recently slumped below its 50-day and 200-day moving average (DMA) lines to its 2022 low.
| Oil Services |
$OSX |
63.44 |
-0.33 |
-0.51% |
+20.33% |
| Integrated Oil |
$XOI |
1,494.39 |
-16.09 |
-1.07% |
+26.84% |
| Semiconductor |
$SOX |
2,778.96 |
-46.08 |
-1.63% |
-29.58% |
| Networking |
$NWX |
726.00 |
-1.96 |
-0.27% |
-25.24% |
| Broker/Dealer |
$XBD |
406.82 |
-7.22 |
-1.74% |
-16.44% |
| Retail |
$RLX |
3,049.84 |
-134.10 |
-4.21% |
-27.84% |
| Gold & Silver |
$XAU |
102.25 |
+1.60 |
+1.59% |
-22.80% |
| Bank |
$BKX |
105.22 |
-2.34 |
-2.18% |
-20.42% |
| Biotech |
$BTK |
4,715.52 |
+2.50 |
+0.05% |
-14.55% |
|
|
|
 |
Volume Driven Gains Approaching Prior High
Kenneth J. Gruneisen - Passed the CAN SLIM® Master's Exam
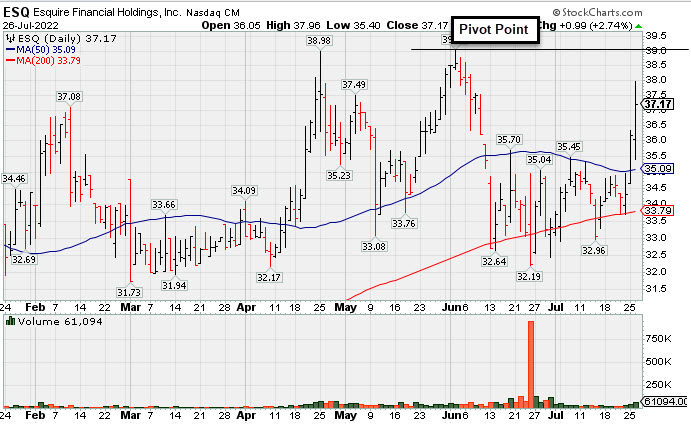
Esquire Financial Hldgs (ESQ +$0.99 or +2.74% to $37.17) was highlighted in yellow in the earlier mid-day report (read here) with pivot point cited based on its 4/25/22 high plus 10 cents. This thinly-traded holding company in the Finance - Commercial Loans industry group rebounded toward its all-time high with today's 3rd consecutive gain. Subsequent gains above the pivot point backed by at least +40% above average volume may trigger a technical buy signal. During the recent consolidation it found support near its 200 DMA line.
Its small supply (S criteria) of only 6.5 million shares in the public float can contribute to greater price volatility in the event of institutional buying or selling. Completed its $14 IPO on 6/29/17. The number of top-rated funds owning its shares rose form 64 in Se '21 to 90 in Jun '22, a reassuring sign concerning the I criteria. Its current Up/Down Volume Ratio of 0.7 is an unbiased indication its shares have been under distributional pressure over the past 50 days.
ESQ has a 96 Earnings Per Share Rating. It reported earnings +37% on +23% sales revenues for the Jun '22 quarter versus the year-ago period, the 4th consecutive quarterly comparison with an earnings increase above the +25% minimum guideline. Its annual earnings growth (A criteria) history has been strong.
|
|
|
Color Codes Explained :
Y - Better candidates highlighted by our
staff of experts.
G - Previously featured
in past reports as yellow but may no longer be buyable under the
guidelines.
***Last / Change / Volume data in this table is the closing quote data***
Symbol/Exchange
Company Name
Industry Group |
PRICE |
CHANGE
(%Change) |
Day High |
Volume
(% DAV)
(% 50 day avg vol) |
52 Wk Hi
% From Hi |
Featured
Date |
Price
Featured |
Pivot Featured |
|
Max Buy |
 LLY
-
NYSE
LLY
-
NYSE
Eli Lilly & Co
Medical-Diversified
|
$331.56
|
+0.01
0.00% |
$332.57
|
1,783,845
61.79% of 50 DAV
50 DAV is 2,887,000
|
$335.33
-1.12%
|
5/16/2022
|
$302.46
|
PP = $314.10
|
|
MB = $329.81
|
Most Recent Note - 7/25/2022 4:16:50 PM
G - Posted a 3rd consecutive quiet gain today and its color code is changed to green after inching above its "max buy" level. Its 50 DMA line ($312) defines near-term support to watch.
>>> FEATURED STOCK ARTICLE : Hovering Near "Max Buy" Level With Volume Totals Cooling - 7/22/2022 |
View all notes |
Set NEW NOTE alert |
Company Profile |
SEC
News |
Chart |
Request a new note
C
A
S
I |
IMXI
-
NASDAQ
International Money Exp
Financial Svcs-Specialty
|
$22.97
|
+0.09
0.39% |
$23.11
|
337,079
81.42% of 50 DAV
50 DAV is 414,000
|
$23.52
-2.34%
|
7/1/2022
|
$21.27
|
PP = $21.38
|
|
MB = $22.45
|
Most Recent Note - 7/25/2022 4:15:24 PM
Y - Pulled back with lighter volume today after 6 consecutive gains for new 52-week highs marked by higher volume. Held its ground after it recently broke out of a "double bottom" base. Its 50 DMA line ($20.60) defines important near-term support to watch. Fundamentals through the Mar '22 quarter have been strong.
>>> FEATURED STOCK ARTICLE : Stalled Since Clearing Double Bottom Base - 7/15/2022 |
View all notes |
Set NEW NOTE alert |
Company Profile |
SEC
News |
Chart |
Request a new note
C
A
S
I |
HRMY
-
NASDAQ
Harmony Biosciences Hldg
Medical-Biomed/Biotech
|
$50.60
|
-0.15
-0.30% |
$51.67
|
235,579
49.81% of 50 DAV
50 DAV is 473,000
|
$57.13
-11.43%
|
7/6/2022
|
$54.12
|
PP = $52.85
|
|
MB = $55.49
|
Most Recent Note - 7/25/2022 4:13:49 PM
Y - Pulled back for a 3rd consecutive loss and today's loss had above average volume while undercutting the 7/19/22 low ($50.18) raising greater concerns. The next near-term support to watch is its 50 DMA line ($47.17).
>>> FEATURED STOCK ARTICLE : Harmony Has Been Encountering Distributional Pressure - 7/18/2022 |
View all notes |
Set NEW NOTE alert |
Company Profile |
SEC
News |
Chart |
Request a new note
C
A
S
I |
CI
-
NYSE
Cigna Corp
Medical-Managed Care
|
$274.83
|
+2.20
0.81% |
$275.66
|
1,686,669
86.67% of 50 DAV
50 DAV is 1,946,000
|
$282.33
-2.66%
|
7/7/2022
|
$276.55
|
PP = $273.68
|
|
MB = $287.36
|
Most Recent Note - 7/25/2022 4:11:13 PM
Y - Posted a 2nd gain with lighter volume today, rebounding near prior highs in the $273 area. Tested support at its 50 DMA line ($263.65) twice following a recent technical breakout. More damaging losses would raise greater concerns.
>>> FEATURED STOCK ARTICLE : Pulled Back and Tested Support at 50-Day Moving Average - 7/19/2022 |
View all notes |
Set NEW NOTE alert |
Company Profile |
SEC
News |
Chart |
Request a new note
C
A
S
I |
AN
-
NYSE
Autonation Inc
SPECIALTY RETAIL - Auto Dealerships
|
$111.05
|
-3.01
-2.64% |
$114.81
|
817,216
59.00% of 50 DAV
50 DAV is 1,385,000
|
$133.48
-16.80%
|
7/20/2022
|
$122.03
|
PP = $126.49
|
|
MB = $132.81
|
 Most Recent Note - 7/26/2022 5:58:16 PM
G - Slumped well below its 200 DMA line today with near average volume raising more concerns. A prompt rebound above the 50 DMA line ($116) is needed for its outlook to improve. Subsequent volume-driven gains above the pivot point may trigger a technical buy signal. Reported Jun '22 quarterly earnings +34% on -2% sales revenues versus the year ago period. Faces some resistance due to overhead supply up to the $133 level.
>>> FEATURED STOCK ARTICLE : Autonation Earnings Due While Perched Near Pivot Point - 7/20/2022 |
View all notes |
Set NEW NOTE alert |
Company Profile |
SEC
News |
Chart |
Request a new note
C
A
S
I |
Symbol/Exchange
Company Name
Industry Group |
PRICE |
CHANGE
(%Change) |
Day High |
Volume
(% DAV)
(% 50 day avg vol) |
52 Wk Hi
% From Hi |
Featured
Date |
Price
Featured |
Pivot Featured |
|
Max Buy |
ESQ
-
NASDAQ
Esquire Financial Hldgs
Finance-Commercial Loans
|
$37.17
|
+0.99
2.74% |
$37.96
|
61,094
100.15% of 50 DAV
50 DAV is 61,000
|
$39.09
-4.91%
|
7/26/2022
|
$37.74
|
PP = $39.19
|
|
MB = $41.15
|
Most Recent Note - 7/26/2022 5:49:14 PM
Y - Posted a 3rd consecutive gain today with ever-increasing volume. It was highlighted in yellow with pivot point cited based on its 4/25/22 high plus 10 cents in the earlier mid-day report. This thinly-traded holding company in the Finance - Commercial Loans industry group is rebounding near its all-time high. Subsequent gains above the pivot point backed by at least +40% above average volume may trigger a technical buy signal. Found support near its 200 DMA line. Small supply (S criteria) of only 6.5 million shares in the public float. Completed its $14 IPO on 6/29/17. Reported earnings +37% on +23% sales revenues for the Jun '22 quarter versus the year-ago period, the 4th consecutive quarterly comparison with an earnings increase above the +25% minimum guideline. See the latest FSU analysis for more details and a new annotated graph.
>>> FEATURED STOCK ARTICLE : Volume Driven Gains Approaching Prior High - 7/26/2022 |
View all notes |
Set NEW NOTE alert |
Company Profile |
SEC
News |
Chart |
Request a new note
C
A
S
I |
GPK
-
NYSE
Graphic Packaging Hldg
CONSUMER NON-DURABLES - Packaging and Containers
|
$22.60
|
+0.97
4.48% |
$22.68
|
5,965,221
213.27% of 50 DAV
50 DAV is 2,797,000
|
$22.99
-1.70%
|
7/26/2022
|
$22.63
|
PP = $23.09
|
|
MB = $24.24
|
Most Recent Note - 7/26/2022 5:55:52 PM
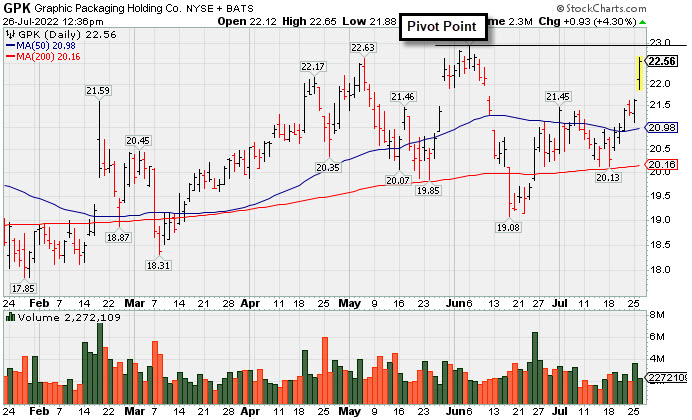
Y - Highlighted in yellow in the earlier mid-day report with pivot point cited based on its 6/06/22 high plus 10 cents. Finished strong with volume +113% above average after gapping up and rallying toward its 52-week high. Subsequent gains above the pivot point backed by at least +40% above average volume are needed to trigger a proper technical buy signal Reported earnings +108% on +36% sales revenues for the Jun '22 quarter versus the year ago period. Three of the past 4 quarterly comparisons were above the +25% minimum earnings guideline (C criteria). Annual earnings history has been good since a downturn in FY '16 and '17, helping it match with the fact-based investment system's fundamental guidelines (A criteria).
 There are no Featured Stock Updates™ available for this stock at this time. You may request one by clicking the Request a New Note link below |
View all notes |
Set NEW NOTE alert |
Company Profile |
SEC
News |
Chart |
Request a new note
C
A
S
I
There are no Featured Stock Updates™ available for this stock at this time. You may request one by clicking the Request a New Note link below |
View all notes |
Set NEW NOTE alert |
Company Profile |
SEC
News |
Chart |
Request a new note
C
A
S
I |
|
|
|
THESE ARE NOT BUY RECOMMENDATIONS!
Comments contained in the body of this report are technical
opinions only. The material herein has been obtained
from sources believed to be reliable and accurate, however,
its accuracy and completeness cannot be guaranteed.
This site is not an investment advisor, hence it does
not endorse or recommend any securities or other investments.
Any recommendation contained in this report may not
be suitable for all investors and it is not to be deemed
an offer or solicitation on our part with respect to
the purchase or sale of any securities. All trademarks,
service marks and trade names appearing in this report
are the property of their respective owners, and are
likewise used for identification purposes only.
This report is a service available
only to active Paid Premium Members.
You may opt-out of receiving report notifications
at any time. Questions or comments may be submitted
by writing to Premium Membership Services 665 S.E. 10 Street, Suite 201 Deerfield Beach, FL 33441-5634 or by calling 1-800-965-8307
or 954-785-1121.
|
|
|