You are not logged in.
This means you
CAN ONLY VIEW reports that were published prior to Monday, April 14, 2025.
You
MUST UPGRADE YOUR MEMBERSHIP if you want to see any current reports.
AFTER MARKET UPDATE - FRIDAY, JUNE 25TH, 2010
Previous After Market Report Next After Market Report >>>
|
|
|
|
DOW |
-8.99 |
10,143.81 |
-0.09% |
|
Volume |
2,555,967,990 |
+103% |
|
Volume |
3,355,830,900 |
+70% |
|
NASDAQ |
+6.06 |
2,223.48 |
+0.27% |
|
Advancers |
2,215 |
71% |
|
Advancers |
1,819 |
66% |
|
S&P 500 |
+3.07 |
1,076.76 |
+0.29% |
|
Decliners |
832 |
26% |
|
Decliners |
832 |
30% |
|
Russell 2000 |
+11.94 |
645.11 |
+1.89% |
|
52 Wk Highs |
36 |
|
|
52 Wk Highs |
41 |
|
|
S&P 600 |
+5.85 |
344.18 |
+1.73% |
|
52 Wk Lows |
53 |
|
|
52 Wk Lows |
112 |
|
|
 |
Small Caps Showing Strength As Rally Sputters
Adam Sarhan, Contributing Writer,
The major averages negatively reversed (opened higher and closed lower) this week after encountering resistance near their respective 50-day moving average (DMA) lines. The current rally is under pressure after the major averages fell back below their respective 200 DMA lines and suffered a series of ominous distribution days. On Friday, volume totals were reported higher on the NYSE and the Nasdaq exchange compared to Thursday's levels, inflated due to the annual re-balancing in the small cap Russell 2000 Index. Advancers trumped decliners by more than a 2-to-1 on the NYSE and on the Nasdaq exchange. There were only 9 high-ranked companies from the CANSLIM.net Leaders List that made a new 52-week high and appeared on the CANSLIM.net BreakOuts Page, higher than the 2 issues that appeared on the prior session. Leadership has evaporated, and without a healthy crop of leaders hitting new highs it is hard for the major averages to sustain a rally. New 52-week highs outnumbered new 52-week lows on the NYSE but trailed on the Nasdaq exchange.
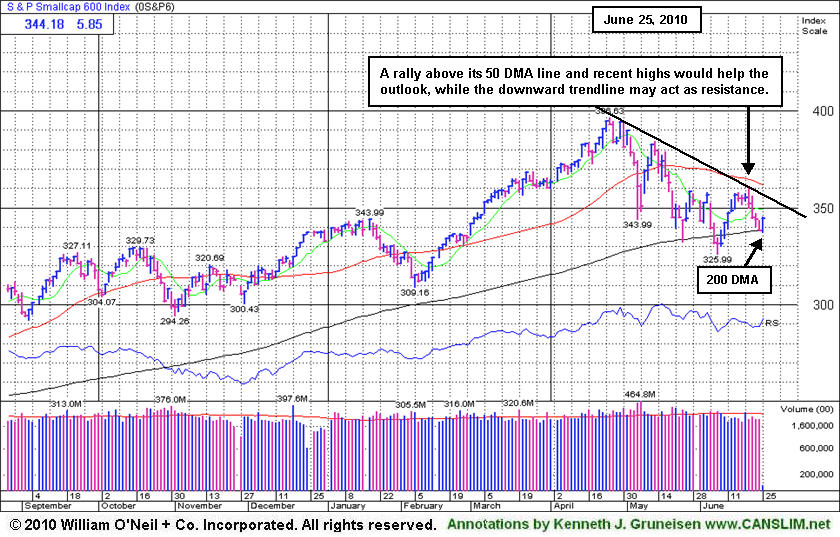
PICTURED 1: The S&P 600 Small-Cap Index bounced at its 200 DMA line on Friday (*volume is not updated on the graph shown). A downward trendline may act as resistance while a subsequent rally above its 50 DMA line and recent chart high would help the outlook improve. Notice that the 50 DMA line is well above the 200 DMA line for this small-cap index.
Stocks opened sharply higher on Monday but closed lower after The People's Bank of China pledged on June 19 to make the yuan more flexible. The major averages negatively reversed after encountering resistance near their respective 50 DMA lines and spent the week pulling back. On Tuesday, both the Dow Jones Industrial Average and the benchmark S&P 500 Index close below their respective 200 DMA lines only one week after the latest follow-through day (FTD) confirmed a new rally. In our view, this put the latest rally under pressure and suggested lower prices may likely follow. The selling accelerated after the National Association of Realtors said sales of previously owned homes fell -2.2% last month and the euro fell for a second consecutive day.
The selling continued on Wednesday as investors digested dismal housing data and the Fed left rates unchanged as the economy continues to recover from the worst financial crisis since the Great Depression. The Commerce Department said purchases of new homes plunged nearly -33% to an annual pace of 300,000 last month as the government's tax credit expired. The report also showed that the median home price slid to just over $200,000 and prior months readings were downwardly revised. The overtly weak reading left many to question the health of the already fragile economic recovery. In addition, anyone watching housing stocks in recent weeks should now expect dismal news (possibly a double dip in the ailing housing market) to continue in the near future.
On Thursday, stocks fell in heavy trade sending the Nasdaq Composite and small cap Russell 2000 Index below their respective 200 DMA lines, which bodes poorly for the latest rally attempt. Before Thursday's opening bell, two separate government reports dragged stocks lower: unemployment claims fell from a two-month high while durable-goods orders fell -1.1%. Stocks closed modestly higher on Friday while the much-anticipated financial regulatory (FinReg) bill is getting close to passing.
Technically, the fact that the Dow Jones Industrial Average, S&P 500, Nasdaq Composite, and Russell 2000 Index all closed below their respective 200-day moving average (DMA) lines this week bodes poorly for the last rally attempt. Additionally, this unanimously ominous action suggests the market may retest its recent lows. Looking forward, the 50 DMA line may act as stubborn resistance and this month's lows should act as support. Since the June 15, 2010 follow-through day (FTD), this column has steadily noted the importance of remaining very selective and disciplined because all of the major averages are still trading below their downward sloping 50-day moving average (DMA) lines. This week's sell-off simply confirms that view. Trade accordingly.
Are You Ready For A Change?
Inquire Today About Professional Money Management Services:
If your portfolio is greater than $100,000 and you need assistance, click here to get connected with portfolio managers using the fact-based investment system CANSLIM.net is built upon. ** Serious inquires only, please.
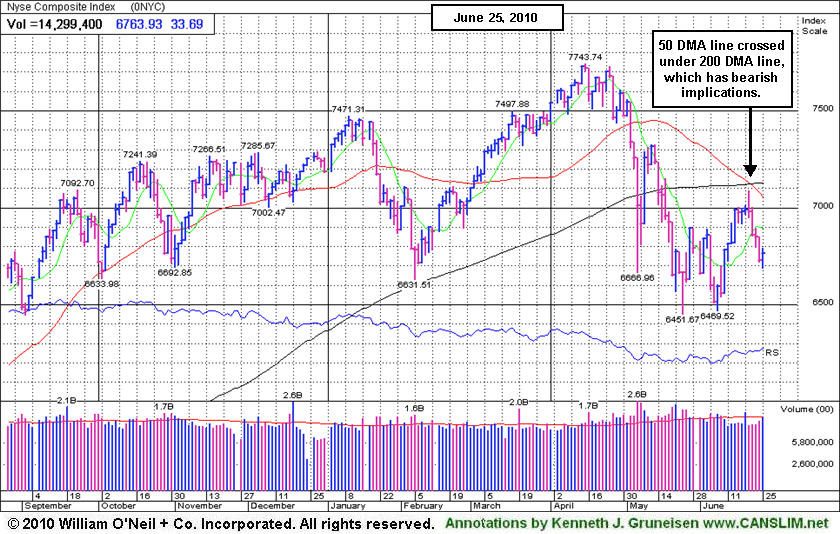
PICTURED 2: The NYSE Composite Index has shown a bearish signal this week as its 50 DMA line crossed under its 200 DMA line. The last time the index was shown in this commentary was on May 4th, when the NYSE Composite Index was the first substantial index to violate its 50 DMA line (read here). Immediately afterward, all of the major averages violated their respective 50 DMA lines. Time will tell whether the major averages follow along and display the same worrisome signs in the weeks ahead.
|
|
|
 |
Gold & Silver Index Rallied Near Stubborn Resistance
Kenneth J. Gruneisen - Passed the CAN SLIM® Master's Exam
Strength from the financial groups helped to underpin the major averages' gains on Friday as the Bank Index ($BKX +2.91%) and Broker/Dealer Index ($XBD +1.39%) rose. Gains from the Biotechnology Index ($BTK +1.80%) and Oil Services Index ($OSX +1.84%) were also a positive influence on the market, along with a smaller gain from the Retail Index ($RLX +0.58%). The tech sector was quiet as the Semiconductor Index ($SOX -0.04%) and Internet Index ($IIX +0.09%) showed little change, and there was modest weakness leading to small losses for the Networking Index ($NWX -0.29%), Integrated Oil Index ($XOI -0.30%), and Healthcare Index ($HMO -0.12%)
Charts courtesy www.stockcharts.com
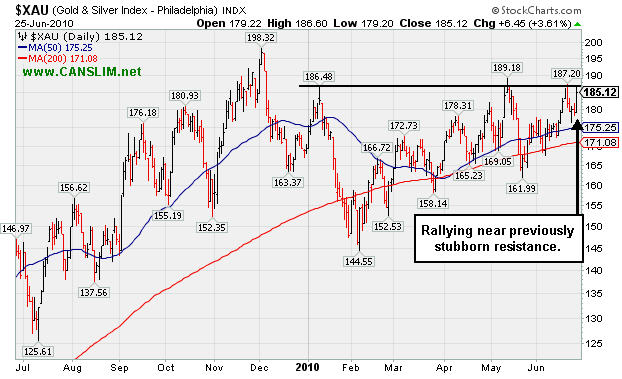
PICTURED: The Gold & Silver Index ($XAU +3.61%) was a standout gainer as it posted a considerable gain on Friday, rallying near previously stubborn resistance.
| Oil Services |
$OSX |
173.21 |
+3.13 |
+1.84% |
-11.14% |
| Healthcare |
$HMO |
1,494.49 |
-1.80 |
-0.12% |
+1.46% |
| Integrated Oil |
$XOI |
922.31 |
-2.74 |
-0.30% |
-13.66% |
| Semiconductor |
$SOX |
352.09 |
-0.13 |
-0.04% |
-2.17% |
| Networking |
$NWX |
226.69 |
-0.67 |
-0.29% |
-1.89% |
| Internet |
$IIX |
233.72 |
+0.20 |
+0.09% |
-0.06% |
| Broker/Dealer |
$XBD |
103.85 |
+1.42 |
+1.39% |
-9.74% |
| Retail |
$RLX |
407.72 |
+2.34 |
+0.58% |
-0.83% |
| Gold & Silver |
$XAU |
185.12 |
+6.45 |
+3.61% |
+10.03% |
| Bank |
$BKX |
49.19 |
+1.39 |
+2.91% |
+15.17% |
| Biotech |
$BTK |
1,079.21 |
+19.13 |
+1.80% |
+14.55% |
|
|
|
 |
Retail - Specialty Firm Showing Resilience After Offering
Kenneth J. Gruneisen - Passed the CAN SLIM® Master's Exam
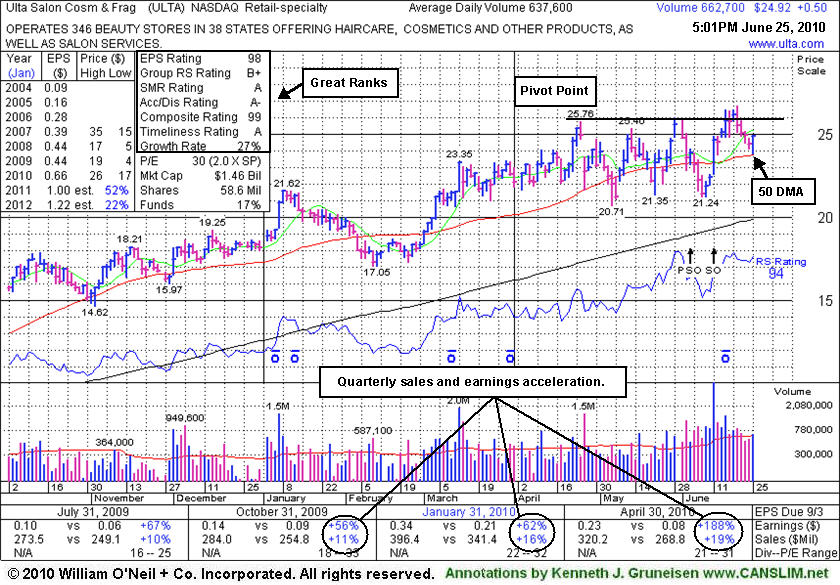
Ulta Salon Cosmetics & Fragrance, Inc. (ULTA +$0.50 or +2.05% to $24.92) closed near the session high today, making a positive reversal after dipping near its 50 DMA line. It has been quietly consolidating since a negative reversal from an all-time high on 6/21/10. On 6/11/10 it completed a Secondary Offering which may hinder upward price progress for the near-term. For now it remains an ideal candidate for investors' watch lists, awaiting confirming gains for a new high close with heavy volume for a fresh technical buy signal.
ULTA made very little headway since the detailed Stock Bulletin with annotated graph was published soon after it was featured in the 3/12/10 mid-day report (read here) as a considerable gain with heavy volume helped it reach a new 52-week high. It was then noted as it rose from an 8-week cup shaped base following stronger results for the quarter ended January 31, 2010.
This high-ranked leader in the Retail - Misc group which has shown accelerating sales revenues increases with strong quarterly earnings increases above the +25% guideline in the 3 latest comparisons (satisfies the C criteria). The number of top-rated funds with an ownership interest has grown from 49 funds in March '09 to 80 funds as of Mar '10 which is an encouraging sign of increasing institutional interest (the I criteria). Management's 36% ownership stake (after the latest offering) still keeps the company's directors very motivated to look after and build shareholder value.
|
|
|
Color Codes Explained :
Y - Better candidates highlighted by our
staff of experts.
G - Previously featured
in past reports as yellow but may no longer be buyable under the
guidelines.
***Last / Change / Volume data in this table is the closing quote data***
Symbol/Exchange
Company Name
Industry Group |
PRICE |
CHANGE
(%Change) |
Day High |
Volume
(% DAV)
(% 50 day avg vol) |
52 Wk Hi
% From Hi |
Featured
Date |
Price
Featured |
Pivot Featured |
|
Max Buy |
AAPL
-
NASDAQ
Apple Inc
COMPUTER HARDWARE - Personal Computers
|
$266.70
|
-2.30
-0.86% |
$270.27
|
19,616,075
70.40% of 50 DAV
50 DAV is 27,864,000
|
$279.01
-4.41%
|
6/17/2010
|
$270.95
|
PP = $272.56
|
|
MB = $286.19
|
 Most Recent Note - 6/25/2010 4:56:57 PM
Y - Hovering -4.4% off its all-time high. It was featured in the 6/17/10 mid-day report (read here) with a new pivot point cited based upon its all-time high plus ten cents while "working on the right side of a choppy 9-week consolidation marked by heavy distribution."
>>> The latest Featured Stock Update with an annotated graph appeared on 6/17/2010. Click here.
View all notes |
Alert me of new notes |
CANSLIM.net Company Profile |
SEC |
Zacks Reports |
StockTalk |
News |
Chart |
Request a new note
C
A N
S L
I M


|
APEI
-
NASDAQ
American Public Educ Inc
DIVERSIFIED SERVICES - Education and Training Services
|
$45.42
|
-0.15
-0.33% |
$46.05
|
184,964
106.18% of 50 DAV
50 DAV is 174,200
|
$48.95
-7.21%
|
6/7/2010
|
$46.60
|
PP = $46.29
|
|
MB = $48.60
|
Most Recent Note - 6/25/2010 4:58:58 PM
Y - Quietly holding its ground above its 50 DMA line. It slumped below its pivot point after gains to new highs on better volume.
>>> The latest Featured Stock Update with an annotated graph appeared on 6/14/2010. Click here.
View all notes |
Alert me of new notes |
CANSLIM.net Company Profile |
SEC |
Zacks Reports |
StockTalk |
News |
Chart |
Request a new note
C
A N
S L
I M
|
BIDU
-
NASDAQ
Baidu Inc Ads
INTERNET - Internet Information Providers
|
$76.10
|
+2.30
3.12% |
$76.28
|
8,856,358
57.89% of 50 DAV
50 DAV is 15,298,500
|
$82.29
-7.52%
|
1/13/2010
|
$43.13
|
PP = $42.68
|
|
MB = $44.81
|
Most Recent Note - 6/25/2010 4:15:20 PM
G - Quietly consolidating -7.5% below its 52-week high while building a choppy late-stage base. Its 50 DMA line defines important initial support above recent lows in the $66 area, where violations would trigger worrisome sell signals.
>>> The latest Featured Stock Update with an annotated graph appeared on 6/21/2010. Click here.
View all notes |
Alert me of new notes |
CANSLIM.net Company Profile |
SEC |
Zacks Reports |
StockTalk |
News |
Chart |
Request a new note
C
A N
S L
I M
|
BRLI
-
NASDAQ
Bio Reference Labs Inc
HEALTH SERVICES - Medical Laboratories and Researc
|
$22.74
|
-0.26
-1.13% |
$23.19
|
288,705
153.48% of 50 DAV
50 DAV is 188,100
|
$24.67
-7.84%
|
6/15/2010
|
$23.57
|
PP = $24.77
|
|
MB = $26.01
|
Most Recent Note - 6/25/2010 4:22:44 PM
Y - Enduring mild distributional pressure and closing the week below its 50 DMA line. Gains above its recent high ($23.87 on 6/18/10) would be an encouraging sign.
>>> The latest Featured Stock Update with an annotated graph appeared on 6/15/2010. Click here.
View all notes |
Alert me of new notes |
CANSLIM.net Company Profile |
SEC |
Zacks Reports |
StockTalk |
News |
Chart |
Request a new note
C
A N
S L
I M
|
CISG
-
NASDAQ
Cninsure Inc Ads
INSURANCE - Insurance Brokers
|
$27.80
|
+0.33
1.20% |
$27.80
|
420,343
135.07% of 50 DAV
50 DAV is 311,200
|
$28.62
-2.87%
|
6/16/2010
|
$27.20
|
PP = $27.75
|
|
MB = $29.14
|
Most Recent Note - 6/25/2010 4:23:36 PM
Y - Hovering -3% off its all-time high in a very tight trading range near its pivot point since featured in the 6/16/10 mid-day report (read here).
>>> The latest Featured Stock Update with an annotated graph appeared on 6/18/2010. Click here.
View all notes |
Alert me of new notes |
CANSLIM.net Company Profile |
SEC |
Zacks Reports |
StockTalk |
News |
Chart |
Request a new note
C
A N
S L
I M
|
Symbol/Exchange
Company Name
Industry Group |
PRICE |
CHANGE
(%Change) |
Day High |
Volume
(% DAV)
(% 50 day avg vol) |
52 Wk Hi
% From Hi |
Featured
Date |
Price
Featured |
Pivot Featured |
|
Max Buy |
CRM
-
NYSE
Salesforce.Com Inc
INTERNET - Internet Software and Services
|
$91.62
|
+0.58
0.64% |
$91.98
|
2,074,241
76.61% of 50 DAV
50 DAV is 2,707,500
|
$97.94
-6.45%
|
6/2/2010
|
$88.44
|
PP = $89.60
|
|
MB = $94.08
|
Most Recent Note - 6/25/2010 4:25:13 PM
G - Quietly consolidating just above its old pivot point. Prior highs in the $89 area define support just above its 50 DMA line.
>>> The latest Featured Stock Update with an annotated graph appeared on 6/22/2010. Click here.
View all notes |
Alert me of new notes |
CANSLIM.net Company Profile |
SEC |
Zacks Reports |
StockTalk |
News |
Chart |
Request a new note
C
A N
S L
I M
|
DECK
-
NASDAQ
Deckers Outdoor Corp
CONSUMER NON-DURABLES - Textile - Apparel Footwear
|
$155.05
|
+1.87
1.22% |
$156.40
|
540,543
102.82% of 50 DAV
50 DAV is 525,700
|
$168.52
-7.99%
|
6/11/2010
|
$157.34
|
PP = $158.57
|
|
MB = $166.50
|
Most Recent Note - 6/25/2010 4:30:12 PM
Y - Gain today with near average volume, but it ended down -6% for the week. Its 50 DMA line is an important support level to watch now.
>>> The latest Featured Stock Update with an annotated graph appeared on 6/11/2010. Click here.
View all notes |
Alert me of new notes |
CANSLIM.net Company Profile |
SEC |
Zacks Reports |
StockTalk |
News |
Chart |
Request a new note
C
A N
S L
I M
|
FFIV
-
NASDAQ
F 5 Networks Inc
INTERNET - Internet Software and Services
|
$71.89
|
-0.09
-0.13% |
$72.30
|
1,412,086
83.49% of 50 DAV
50 DAV is 1,691,300
|
$77.10
-6.76%
|
6/16/2010
|
$74.50
|
PP = $74.10
|
|
MB = $77.81
|
Most Recent Note - 6/25/2010 4:33:16 PM
Y - Ended near the session high today after slumping near its 50 DMA line early in the session.
>>> The latest Featured Stock Update with an annotated graph appeared on 6/16/2010. Click here.
View all notes |
Alert me of new notes |
CANSLIM.net Company Profile |
SEC |
Zacks Reports |
StockTalk |
News |
Chart |
Request a new note
C
A N
S L
I M
|
MELI
-
NASDAQ
Mercadolibre Inc
INTERNET - Internet Software and; Services
|
$58.15
|
+1.30
2.29% |
$59.00
|
4,723,708
607.71% of 50 DAV
50 DAV is 777,300
|
$62.14
-6.42%
|
5/13/2010
|
$54.21
|
PP = $55.85
|
|
MB = $58.64
|
Most Recent Note - 6/25/2010 3:34:13 PM
G - Considerable gain today with above average volume, rallying after a pullback tested support near prior chart highs in the $55 area.
>>> The latest Featured Stock Update with an annotated graph appeared on 6/10/2010. Click here.
View all notes |
Alert me of new notes |
CANSLIM.net Company Profile |
SEC |
Zacks Reports |
StockTalk |
News |
Chart |
Request a new note
C
A N
S L
I M
|
NEM
-
NYSE
Newmont Mining Corp
METALS and MINING - Gold
|
$61.67
|
+2.72
4.61% |
$62.11
|
12,166,725
130.39% of 50 DAV
50 DAV is 9,331,300
|
$61.78
-0.18%
|
6/22/2010
|
$59.60
|
PP = $59.67
|
|
MB = $62.65
|
Most Recent Note - 6/25/2010 3:30:31 PM
Y - Considerable gain today for a new 52-week high with volume near average. Near all-time highs with no overhead supply to act as resistance. It was featured in a 6/22/10 Stock Bulletin with annotated graph (read here).
>>> The latest Featured Stock Update with an annotated graph appeared on 6/22/2010. Click here.
View all notes |
Alert me of new notes |
CANSLIM.net Company Profile |
SEC |
Zacks Reports |
StockTalk |
News |
Chart |
Request a new note
C
A N
S L
I M
|
Symbol/Exchange
Company Name
Industry Group |
PRICE |
CHANGE
(%Change) |
Day High |
Volume
(% DAV)
(% 50 day avg vol) |
52 Wk Hi
% From Hi |
Featured
Date |
Price
Featured |
Pivot Featured |
|
Max Buy |
ROVI
-
NASDAQ
Rovi Corp
COMPUTER SOFTWARE andamp; SERVICES - Security Software andamp; Services
|
$38.14
|
+0.94
2.53% |
$38.21
|
1,710,606
127.01% of 50 DAV
50 DAV is 1,346,800
|
$40.06
-4.79%
|
6/3/2010
|
$38.70
|
PP = $40.16
|
|
MB = $42.17
|
Most Recent Note - 6/25/2010 4:11:05 PM
G - Closed the week above its 50 DMA line with quiet volume behind its gains. Prior lows near $35 area define support above its 200 DMA line.
>>> The latest Featured Stock Update with an annotated graph appeared on 6/9/2010. Click here.
View all notes |
Alert me of new notes |
CANSLIM.net Company Profile |
SEC |
Zacks Reports |
StockTalk |
News |
Chart |
Request a new note
C
A N
S L
I M
|
SUMR
-
NASDAQ
Summer Infant Inc
CONSUMER NON-DURABLES - Personal Products
|
$6.78
|
-0.15
-2.16% |
$7.05
|
1,146,237
1,411.62% of 50 DAV
50 DAV is 81,200
|
$8.42
-19.48%
|
5/4/2010
|
$6.85
|
PP = $7.09
|
|
MB = $7.44
|
Most Recent Note - 6/25/2010 4:36:49 PM
G - Small loss on very heavy volume today. Since negating its breakout volume behind gains has been light. Gains above its 50 DMA line and above recent chart highs near $7.40 would be an encouraging technical improvement while recent chart lows in the $6.25 area define important support to watch.
>>> The latest Featured Stock Update with an annotated graph appeared on 6/24/2010. Click here.
View all notes |
Alert me of new notes |
CANSLIM.net Company Profile |
SEC |
Zacks Reports |
StockTalk |
News |
Chart |
Request a new note
C
A N
S L
I M
|
THOR
-
NASDAQ
Thoratec Corp
HEALTH SERVICES - Medical Instruments and Supplies
|
$43.87
|
+0.21
0.48% |
$45.02
|
7,249,785
731.05% of 50 DAV
50 DAV is 991,700
|
$47.93
-8.47%
|
6/3/2010
|
$44.38
|
PP = $45.35
|
|
MB = $47.62
|
Most Recent Note - 6/25/2010 4:38:25 PM
Y- Small gain today with heavy volume. During the week its slump below its pivot point raised concerns.
>>> The latest Featured Stock Update with an annotated graph appeared on 6/23/2010. Click here.
View all notes |
Alert me of new notes |
CANSLIM.net Company Profile |
SEC |
Zacks Reports |
StockTalk |
News |
Chart |
Request a new note
C
A N
S L
I M
|
ULTA
-
NASDAQ
Ulta Salon Cosm & Frag
SPECIALTY RETAIL - Specialty Retail, Other
|
$24.92
|
+0.50
2.05% |
$24.92
|
895,870
143.13% of 50 DAV
50 DAV is 625,900
|
$26.75
-6.84%
|
5/28/2010
|
$25.58
|
PP = $25.86
|
|
MB = $27.15
|
Most Recent Note - 6/25/2010 4:41:11 PM
Y - Closed near the session high today, making a positive reversal after dipping near its 50 DMA line.
>>> The latest Featured Stock Update with an annotated graph appeared on 6/25/2010. Click here.
View all notes |
Alert me of new notes |
CANSLIM.net Company Profile |
SEC |
Zacks Reports |
StockTalk |
News |
Chart |
Request a new note
C
A N
S L
I M
|
|
|
|
THESE ARE NOT BUY RECOMMENDATIONS!
Comments contained in the body of this report are technical
opinions only. The material herein has been obtained
from sources believed to be reliable and accurate, however,
its accuracy and completeness cannot be guaranteed.
This site is not an investment advisor, hence it does
not endorse or recommend any securities or other investments.
Any recommendation contained in this report may not
be suitable for all investors and it is not to be deemed
an offer or solicitation on our part with respect to
the purchase or sale of any securities. All trademarks,
service marks and trade names appearing in this report
are the property of their respective owners, and are
likewise used for identification purposes only.
This report is a service available
only to active Paid Premium Members.
You may opt-out of receiving report notifications
at any time. Questions or comments may be submitted
by writing to Premium Membership Services 665 S.E. 10 Street, Suite 201 Deerfield Beach, FL 33441-5634 or by calling 1-800-965-8307
or 954-785-1121.
|
|
|


