You are not logged in.
This means you
CAN ONLY VIEW reports that were published prior to Tuesday, April 15, 2025.
You
MUST UPGRADE YOUR MEMBERSHIP if you want to see any current reports.
AFTER MARKET UPDATE - THURSDAY, JUNE 24TH, 2010
Previous After Market Report Next After Market Report >>>
|
|
|
|
DOW |
-145.64 |
10,152.80 |
-1.41% |
|
Volume |
1,260,972,400 |
+12% |
|
Volume |
1,974,780,930 |
+8% |
|
NASDAQ |
-36.81 |
2,217.42 |
-1.63% |
|
Advancers |
694 |
22% |
|
Advancers |
647 |
23% |
|
S&P 500 |
-18.35 |
1,073.69 |
-1.68% |
|
Decliners |
2,351 |
75% |
|
Decliners |
2,004 |
73% |
|
Russell 2000 |
-11.08 |
633.17 |
-1.72% |
|
52 Wk Highs |
28 |
|
|
52 Wk Highs |
15 |
|
|
S&P 600 |
-5.51 |
338.33 |
-1.60% |
|
52 Wk Lows |
53 |
|
|
52 Wk Lows |
99 |
|
|
 |
Distributional Pressure Sends Stocks Lower Again
Adam Sarhan, Contributing Writer,
The major averages got smacked on Thursday sending the benchmark S&P 500 Index to its longest losing streak in seven weeks, dragged lower by the ailing financial sector and the latest round of tepid economic data. Volume totals were reported higher on the NYSE and the Nasdaq exchange compared to Wednesday's levels which marked the latest distribution day and suggests large institutions are aggressively selling stocks. Decliners trumped advancers by more than 3-to-1 on the NYSE and on the Nasdaq exchange. There were only 2 high-ranked companies from the CANSLIM.net Leaders List that made a new 52-week high and appeared on the CANSLIM.net BreakOuts Page, barely higher than the 1 issue that appeared on the prior session. Leadership has evaporated, and without a healthy crop of leaders hitting new highs it is hard for the major averages to sustain a rally. New 52-week lows outnumbered new 52-week highs on the NYSE and on the Nasdaq exchange.
Before Thursday's opening bell, two separate government reports showed unemployment claims fell from a two-month high while durable-goods orders excluding transportation rose slightly. The Labor Department said weekly jobless claims (i.e. the number of Americans applying for jobless benefits) slid by -19,000 to 457,000 in the week ended June 19. Elsewhere, the Commerce Department said durable goods, goods meant to last at least three years, excluding autos and aircraft, rose in May for the third time since February 2010. However, the overall reading was down -1.1%. The fact that the major averages sold off on the news suggests investors were not pleased with the results.
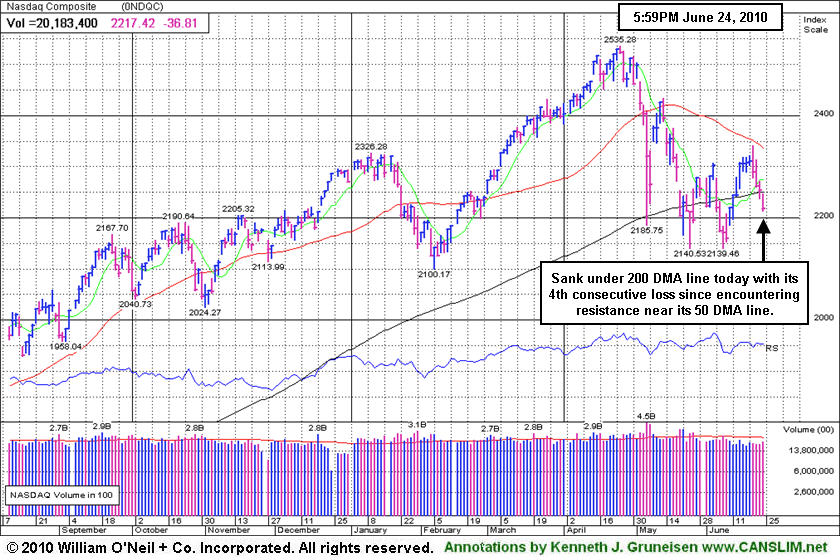
Technically, the fact that both the Dow Jones Industrial Average and the S&P 500 Index continue falling after closing below their respective 200-day moving average (DMA) lines earlier this week suggests the market may retest its recent lows. Looking forward, the 50 DMA line may act as stubborn resistance and this month's lows should act as support. Since the June 15, 2010 follow-through day (FTD), this column has steadily noted the importance of remaining very selective and disciplined because all of the major averages are still trading below their downward sloping 50-day moving average (DMA) lines. This week's sell-off simply confirms that view. Trade accordingly.
Are You Ready For A Change?
Inquire Today About Professional Money Management Services:
If your portfolio is greater than $100,000 and you need assistance, click here to get connected with portfolio managers using the fact-based investment system CANSLIM.net is built upon. ** Serious inquires only, please.
PICTURED: The Nasdaq Composite Index sank under its 200 DMA line with its 4th consecutive loss since encountering resistance near its 50 DMA line.
|
|
|
 |
Widespread Losses Push Retail, Financial, Tech Groups Lower
Kenneth J. Gruneisen - Passed the CAN SLIM® Master's Exam
Losses in the Retail Index ($RLX -2.73%) and the sinking financial group pulled the Bank Index ($BKX -2.23%) and Broker/Dealer Index ($XBD -1.57%) down, hurting the market's rally. Tech-related groups ended unanimously lower as the Semiconductor Index ($SOX -2.94%), Networking Index ($NWX -2.35%), Internet Index ($IIX -2.06%), and Biotechnology Index ($BTK -1.19%) fell. Weakness in energy-related shares weighed on the Oil Services Index ($OSX -2.49%) and Integrated Oil Index ($XOI -2.27%). Meanwhile, the Healthcare Index ($HMO -1.01%) and Gold & Silver Index ($XAU -0.85%) sank, giving "safe haven" investors no reward.
Charts courtesy www.stockcharts.com
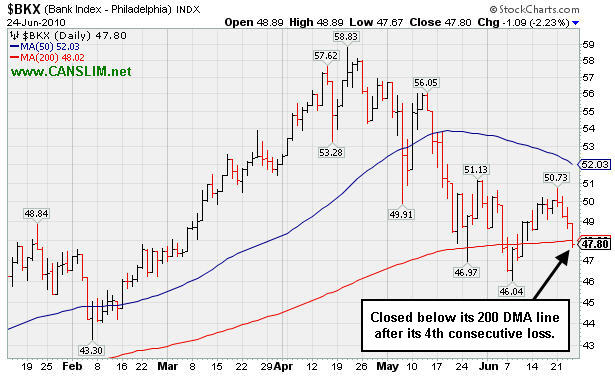
PICTURED: The Bank Index ($BKX -2.23%) closed below its 200 DMA line after its 4th consecutive loss.
| Oil Services |
$OSX |
170.08 |
-4.34 |
-2.49% |
-12.74% |
| Healthcare |
$HMO |
1,496.29 |
-15.20 |
-1.01% |
+1.59% |
| Integrated Oil |
$XOI |
925.04 |
-21.52 |
-2.27% |
-13.40% |
| Semiconductor |
$SOX |
352.22 |
-10.66 |
-2.94% |
-2.14% |
| Networking |
$NWX |
227.35 |
-5.47 |
-2.35% |
-1.60% |
| Internet |
$IIX |
233.51 |
-4.91 |
-2.06% |
-0.15% |
| Broker/Dealer |
$XBD |
102.43 |
-1.63 |
-1.57% |
-10.97% |
| Retail |
$RLX |
405.38 |
-11.36 |
-2.73% |
-1.40% |
| Gold & Silver |
$XAU |
178.67 |
-1.54 |
-0.85% |
+6.19% |
| Bank |
$BKX |
47.80 |
-1.09 |
-2.23% |
+11.92% |
| Biotech |
$BTK |
1,060.08 |
-12.77 |
-1.19% |
+12.52% |
|
|
|
 |
Distribution Followed By Half-Hearted Gains
Kenneth J. Gruneisen - Passed the CAN SLIM® Master's Exam
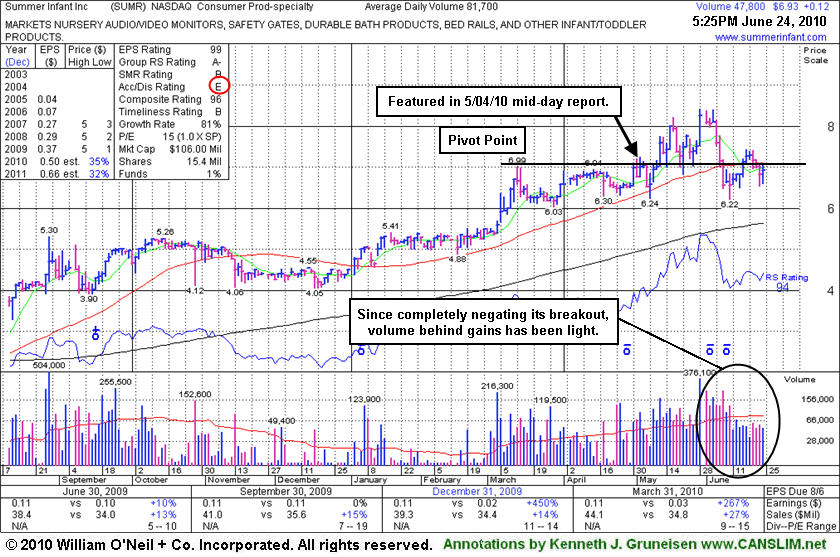
Summer Infant Inc (SUMR +$0.12 or +1.76% or $6.93) has seen its Accumulation/Distribution rank fall, from a B- when it was first featured in the 5/04/10 mid-day report, to a worst possible E rating today. Since negating its breakout, volume behind the latest gains has been light. Gains above its 50-day moving average (DMA) line and above recent chart highs near $7.40 would be an encouraging technical improvement. Meanwhile, recent chart lows in the $6.25 area define the next important support level to watch.
Recent quarterly comparisons show sales revenues growth accelerating and big earnings increases (triple digit percentages), plus it has a good annual earnings (A criteria) history. Low-priced stocks are supposed to be avoided under the fact-based system because they are typically riskier candidates, however, when all key criteria are satisfied and market conditions are bullish buying efforts may be justified. Broader market action (M criteria) is normally expected to impact 3 out of 4 stocks, and since 6/15/2010 (read here) when the new rally produced a follow-through day, distributional has begun weighing on the market again.
|
|
|
Color Codes Explained :
Y - Better candidates highlighted by our
staff of experts.
G - Previously featured
in past reports as yellow but may no longer be buyable under the
guidelines.
***Last / Change / Volume data in this table is the closing quote data***
Symbol/Exchange
Company Name
Industry Group |
PRICE |
CHANGE
(%Change) |
Day High |
Volume
(% DAV)
(% 50 day avg vol) |
52 Wk Hi
% From Hi |
Featured
Date |
Price
Featured |
Pivot Featured |
|
Max Buy |
AAPL
-
NASDAQ
Apple Inc
COMPUTER HARDWARE - Personal Computers
|
$269.00
|
-1.97
-0.73% |
$273.20
|
25,501,995
91.52% of 50 DAV
50 DAV is 27,864,000
|
$279.01
-3.59%
|
6/17/2010
|
$270.95
|
PP = $272.56
|
|
MB = $286.19
|
 Most Recent Note - 6/24/2010 4:54:01 PM
Y - Hovering near its all-time high since featured in the 6/17/10 mid-day report (read here) with a new pivot point cited based upon its all-time high plus ten cents while "working on the right side of a choppy 9-week consolidation marked by heavy distribution."
>>> The latest Featured Stock Update with an annotated graph appeared on 6/17/2010. Click here.
View all notes |
Alert me of new notes |
CANSLIM.net Company Profile |
SEC |
Zacks Reports |
StockTalk |
News |
Chart |
Request a new note
C
A N
S L
I M


|
APEI
-
NASDAQ
American Public Educ Inc
DIVERSIFIED SERVICES - Education and Training Services
|
$45.57
|
+0.18
0.40% |
$46.21
|
116,816
67.06% of 50 DAV
50 DAV is 174,200
|
$48.95
-6.91%
|
6/7/2010
|
$46.60
|
PP = $46.29
|
|
MB = $48.60
|
Most Recent Note - 6/24/2010 4:56:11 PM
Y - Holding its ground above its 50 DMA line today. Slumped below its pivot point after gains to new highs on better volume.
>>> The latest Featured Stock Update with an annotated graph appeared on 6/14/2010. Click here.
View all notes |
Alert me of new notes |
CANSLIM.net Company Profile |
SEC |
Zacks Reports |
StockTalk |
News |
Chart |
Request a new note
C
A N
S L
I M
|
BIDU
-
NASDAQ
Baidu Inc Ads
INTERNET - Internet Information Providers
|
$73.80
|
-2.39
-3.14% |
$75.91
|
10,588,055
69.21% of 50 DAV
50 DAV is 15,298,500
|
$82.29
-10.32%
|
1/13/2010
|
$43.13
|
PP = $42.68
|
|
MB = $44.81
|
Most Recent Note - 6/24/2010 5:03:07 PM
G - Consolidating -10% below its 52-week high while building a sloppy late-stage base.
>>> The latest Featured Stock Update with an annotated graph appeared on 6/21/2010. Click here.
View all notes |
Alert me of new notes |
CANSLIM.net Company Profile |
SEC |
Zacks Reports |
StockTalk |
News |
Chart |
Request a new note
C
A N
S L
I M
|
BRLI
-
NASDAQ
Bio Reference Labs Inc
HEALTH SERVICES - Medical Laboratories and Researc
|
$23.00
|
-0.01
-0.04% |
$23.26
|
231,677
123.17% of 50 DAV
50 DAV is 188,100
|
$24.67
-6.78%
|
6/15/2010
|
$23.57
|
PP = $24.77
|
|
MB = $26.01
|
Most Recent Note - 6/23/2010 12:20:20 PM
Y - Consolidating in a tight range for the past 4 weeks near its 50 DMA line, still perched within close striking distance (-7%) of its all-time high.
>>> The latest Featured Stock Update with an annotated graph appeared on 6/15/2010. Click here.
View all notes |
Alert me of new notes |
CANSLIM.net Company Profile |
SEC |
Zacks Reports |
StockTalk |
News |
Chart |
Request a new note
C
A N
S L
I M
|
CISG
-
NASDAQ
Cninsure Inc Ads
INSURANCE - Insurance Brokers
|
$27.47
|
-0.10
-0.36% |
$27.81
|
332,580
106.87% of 50 DAV
50 DAV is 311,200
|
$28.62
-4.02%
|
6/16/2010
|
$27.20
|
PP = $27.75
|
|
MB = $29.14
|
Most Recent Note - 6/24/2010 5:05:26 PM
Y - Hovering in a tight trading range near its pivot point since featured in the 6/16/10 mid-day report (read here).
>>> The latest Featured Stock Update with an annotated graph appeared on 6/18/2010. Click here.
View all notes |
Alert me of new notes |
CANSLIM.net Company Profile |
SEC |
Zacks Reports |
StockTalk |
News |
Chart |
Request a new note
C
A N
S L
I M
|
Symbol/Exchange
Company Name
Industry Group |
PRICE |
CHANGE
(%Change) |
Day High |
Volume
(% DAV)
(% 50 day avg vol) |
52 Wk Hi
% From Hi |
Featured
Date |
Price
Featured |
Pivot Featured |
|
Max Buy |
CRM
-
NYSE
Salesforce.Com Inc
INTERNET - Internet Software and Services
|
$91.04
|
-1.90
-2.04% |
$93.64
|
2,870,033
106.00% of 50 DAV
50 DAV is 2,707,500
|
$97.94
-7.05%
|
6/2/2010
|
$88.44
|
PP = $89.60
|
|
MB = $94.08
|
Most Recent Note - 6/24/2010 5:06:35 PM
G - Consolidating above its old pivot point. Prior highs in the $89 area are an important support level to watch above its 50 DMA line.
>>> The latest Featured Stock Update with an annotated graph appeared on 6/22/2010. Click here.
View all notes |
Alert me of new notes |
CANSLIM.net Company Profile |
SEC |
Zacks Reports |
StockTalk |
News |
Chart |
Request a new note
C
A N
S L
I M
|
DECK
-
NASDAQ
Deckers Outdoor Corp
CONSUMER NON-DURABLES - Textile - Apparel Footwear
|
$153.18
|
-4.58
-2.90% |
$156.73
|
302,285
57.50% of 50 DAV
50 DAV is 525,700
|
$168.52
-9.10%
|
6/11/2010
|
$157.34
|
PP = $158.57
|
|
MB = $166.50
|
Most Recent Note - 6/24/2010 5:10:24 PM
Y - Gapped down today for a loss on light volume, sinking further below its pivot point near prior chart highs that may now serve as initial support.
>>> The latest Featured Stock Update with an annotated graph appeared on 6/11/2010. Click here.
View all notes |
Alert me of new notes |
CANSLIM.net Company Profile |
SEC |
Zacks Reports |
StockTalk |
News |
Chart |
Request a new note
C
A N
S L
I M
|
FFIV
-
NASDAQ
F 5 Networks Inc
INTERNET - Internet Software and Services
|
$71.98
|
-2.38
-3.20% |
$74.09
|
1,479,720
87.49% of 50 DAV
50 DAV is 1,691,300
|
$77.10
-6.64%
|
6/16/2010
|
$74.50
|
PP = $74.10
|
|
MB = $77.81
|
Most Recent Note - 6/24/2010 5:11:38 PM
Y - Gapped down today for a loss on below average volume. Gain on 6/16/10 with +55% above average volume helped it trigger a technical buy signal with its breakout from a flat base of about 5-weeks.
>>> The latest Featured Stock Update with an annotated graph appeared on 6/16/2010. Click here.
View all notes |
Alert me of new notes |
CANSLIM.net Company Profile |
SEC |
Zacks Reports |
StockTalk |
News |
Chart |
Request a new note
C
A N
S L
I M
|
MELI
-
NASDAQ
Mercadolibre Inc
INTERNET - Internet Software and; Services
|
$56.85
|
-0.74
-1.28% |
$57.60
|
798,568
102.74% of 50 DAV
50 DAV is 777,300
|
$62.14
-8.51%
|
5/13/2010
|
$54.21
|
PP = $55.85
|
|
MB = $58.64
|
Most Recent Note - 6/24/2010 5:14:31 PM
G - Consolidating above prior chart highs in the $55 area that define support.
>>> The latest Featured Stock Update with an annotated graph appeared on 6/10/2010. Click here.
View all notes |
Alert me of new notes |
CANSLIM.net Company Profile |
SEC |
Zacks Reports |
StockTalk |
News |
Chart |
Request a new note
C
A N
S L
I M
|
NEM
-
NYSE
Newmont Mining Corp
METALS and MINING - Gold
|
$58.95
|
-0.13
-0.22% |
$60.20
|
9,650,024
103.42% of 50 DAV
50 DAV is 9,331,300
|
$61.78
-4.58%
|
6/22/2010
|
$59.60
|
PP = $59.67
|
|
MB = $62.65
|
Most Recent Note - 6/24/2010 5:17:36 PM
Y - Perched near all-time highs with no overhead supply to act as resistance. It was featured in a 6/22/10 Stock Bulletin with annotated graph (read here).
>>> The latest Featured Stock Update with an annotated graph appeared on 6/22/2010. Click here.
View all notes |
Alert me of new notes |
CANSLIM.net Company Profile |
SEC |
Zacks Reports |
StockTalk |
News |
Chart |
Request a new note
C
A N
S L
I M
|
Symbol/Exchange
Company Name
Industry Group |
PRICE |
CHANGE
(%Change) |
Day High |
Volume
(% DAV)
(% 50 day avg vol) |
52 Wk Hi
% From Hi |
Featured
Date |
Price
Featured |
Pivot Featured |
|
Max Buy |
ROVI
-
NASDAQ
Rovi Corp
COMPUTER SOFTWARE andamp; SERVICES - Security Software andamp; Services
|
$37.20
|
+0.21
0.57% |
$37.43
|
822,453
61.07% of 50 DAV
50 DAV is 1,346,800
|
$40.06
-7.14%
|
6/3/2010
|
$38.70
|
PP = $40.16
|
|
MB = $42.17
|
Most Recent Note - 6/24/2010 5:20:41 PM
G - Quietly consolidating near its 50 DMA line. Recently found support near prior lows in the $35 area, and stayed above its October 2009 chart high.
>>> The latest Featured Stock Update with an annotated graph appeared on 6/9/2010. Click here.
View all notes |
Alert me of new notes |
CANSLIM.net Company Profile |
SEC |
Zacks Reports |
StockTalk |
News |
Chart |
Request a new note
C
A N
S L
I M
|
SUMR
-
NASDAQ
Summer Infant Inc
CONSUMER NON-DURABLES - Personal Products
|
$6.93
|
+0.12
1.76% |
$7.07
|
47,822
58.89% of 50 DAV
50 DAV is 81,200
|
$8.42
-17.70%
|
5/4/2010
|
$6.85
|
PP = $7.09
|
|
MB = $7.44
|
Most Recent Note - 6/24/2010 5:32:25 PM
G - Since negating its breakout volume behind gains has been light. Gains above its 50 DMA line and above recent chart highs near $7.40 would be an encouraging technical improvement while recent chart lows in the $6.25 area define important support to watch.
>>> The latest Featured Stock Update with an annotated graph appeared on 6/8/2010. Click here.
View all notes |
Alert me of new notes |
CANSLIM.net Company Profile |
SEC |
Zacks Reports |
StockTalk |
News |
Chart |
Request a new note
C
A N
S L
I M
|
THOR
-
NASDAQ
Thoratec Corp
HEALTH SERVICES - Medical Instruments and Supplies
|
$43.66
|
-0.68
-1.53% |
$44.29
|
843,934
85.10% of 50 DAV
50 DAV is 991,700
|
$47.93
-8.91%
|
6/3/2010
|
$44.38
|
PP = $45.35
|
|
MB = $47.62
|
Most Recent Note - 6/24/2010 5:35:19 PM
Y- Loss today on below average volume, but its deeper slump below its pivot point raises concerns.
>>> The latest Featured Stock Update with an annotated graph appeared on 6/23/2010. Click here.
View all notes |
Alert me of new notes |
CANSLIM.net Company Profile |
SEC |
Zacks Reports |
StockTalk |
News |
Chart |
Request a new note
C
A N
S L
I M
|
ULTA
-
NASDAQ
Ulta Salon Cosm & Frag
SPECIALTY RETAIL - Specialty Retail, Other
|
$24.42
|
-0.55
-2.18% |
$24.81
|
564,573
90.20% of 50 DAV
50 DAV is 625,900
|
$26.75
-8.71%
|
5/28/2010
|
$25.58
|
PP = $25.86
|
|
MB = $27.15
|
Most Recent Note - 6/24/2010 5:39:37 PM
Y - Pulled back for a 4th consecutive loss today after a negative reversal from an all-time high on 6/21/10. On 6/11/10 it completed a Secondary Offering which may hinder upward price progress for the near-term.
>>> The latest Featured Stock Update with an annotated graph appeared on 6/7/2010. Click here.
View all notes |
Alert me of new notes |
CANSLIM.net Company Profile |
SEC |
Zacks Reports |
StockTalk |
News |
Chart |
Request a new note
C
A N
S L
I M
|
|
|
|
THESE ARE NOT BUY RECOMMENDATIONS!
Comments contained in the body of this report are technical
opinions only. The material herein has been obtained
from sources believed to be reliable and accurate, however,
its accuracy and completeness cannot be guaranteed.
This site is not an investment advisor, hence it does
not endorse or recommend any securities or other investments.
Any recommendation contained in this report may not
be suitable for all investors and it is not to be deemed
an offer or solicitation on our part with respect to
the purchase or sale of any securities. All trademarks,
service marks and trade names appearing in this report
are the property of their respective owners, and are
likewise used for identification purposes only.
This report is a service available
only to active Paid Premium Members.
You may opt-out of receiving report notifications
at any time. Questions or comments may be submitted
by writing to Premium Membership Services 665 S.E. 10 Street, Suite 201 Deerfield Beach, FL 33441-5634 or by calling 1-800-965-8307
or 954-785-1121.
|
|
|


