You are not logged in.
This means you
CAN ONLY VIEW reports that were published prior to Tuesday, April 15, 2025.
You
MUST UPGRADE YOUR MEMBERSHIP if you want to see any current reports.
AFTER MARKET UPDATE - MONDAY, JUNE 28TH, 2010
Previous After Market Report Next After Market Report >>>
|
|
|
|
DOW |
-5.29 |
10,138.52 |
-0.05% |
|
Volume |
926,228,550 |
-64% |
|
Volume |
1,774,489,400 |
-47% |
|
NASDAQ |
-2.83 |
2,220.65 |
-0.13% |
|
Advancers |
1,358 |
43% |
|
Advancers |
1,090 |
39% |
|
S&P 500 |
-2.19 |
1,074.57 |
-0.20% |
|
Decliners |
1,707 |
54% |
|
Decliners |
1,588 |
57% |
|
Russell 2000 |
-3.57 |
641.54 |
-0.55% |
|
52 Wk Highs |
51 |
|
|
52 Wk Highs |
38 |
|
|
S&P 600 |
-0.72 |
343.46 |
-0.21% |
|
52 Wk Lows |
42 |
|
|
52 Wk Lows |
73 |
|
|
 |
Major Averages Still Faltering Without Widespread Leadership
Adam Sarhan, Contributing Writer,
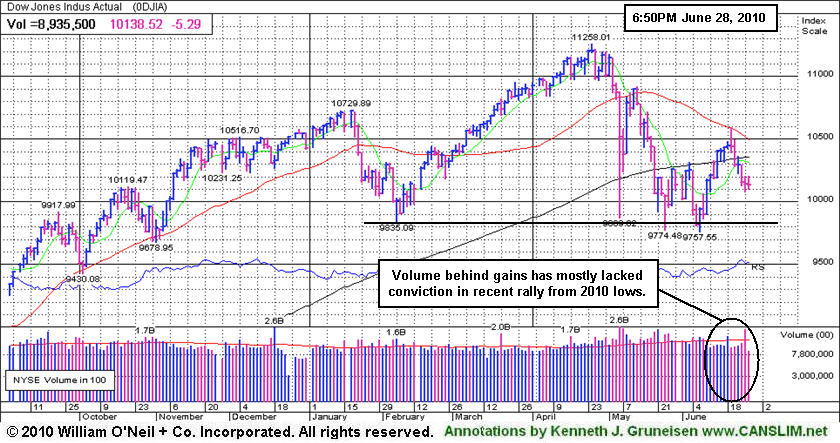
The major averages ended lower after the G-20 pledged to cut deficits in order to help stabilize the global economy and US consumer spending and personal income rose. The current rally is under pressure after the major averages fell back below their respective 200-day moving average (DMA) lines and suffered a series of ominous distribution days. Monday's volume totals were reported lower on the NYSE and the Nasdaq exchange, down from Friday's levels which were inflated due to the annual re-balancing in the small cap Russell 2000 Index. Decliners led advancers by a 17-to-14 ratio on the NYSE and a 3-to-2 ratio on the Nasdaq exchange. There were 15 high-ranked companies from the CANSLIM.net Leaders List that made a new 52-week high and appeared on the CANSLIM.net BreakOuts Page, higher than the 9 issues that appeared on the prior session. Without a healthy crop of leaders hitting new highs it is hard for the major averages to sustain a rally. New 52-week highs outnumbered new 52-week lows on the NYSE but trailed on the Nasdaq exchange.
Over the weekend, G-20 leaders met in Toronto and pledged to cut their soaring deficits but failed to reach an agreement on an international bank tax. Advanced G-20 economies have agreed to cut their deficits by nearly -50% over the next three years in order to stabilize their debt-to-output ratios by 2016. Leaders said nations can move at their own pace and also pledged to fulfill existing stimulus plans. Before Monday's opening bell, the Commerce Department said consumer spending rose +0.2% which topped the Street's estimate. Elsewhere, personal incomes rose +0.4% and the savings rate jumped to the highest level this year.
For the quarter, the benchmark S&P 500 is poised for a -7.4% decline which, barring some unforeseen event, will snap a four-quarter winning streak. The S&P 500 index rose +9.2% during the first four months of 2010 before reaching an interim high of 1219 on April 26. Since then, the popular index plunged -14% on concern Europe’s debt crisis may derail the economic recovery.
Technically, the fact that the Dow Jones Industrial Average, S&P 500, Nasdaq Composite and NYSE Composite all closed below their respective 200-day moving average (DMA) lines last week which bodes poorly for the current rally. Additionally, this unanimously ominous action suggests the market may retest its recent lows. Looking forward, the 50 DMA line may act as stubborn resistance and this month's lows should act as support. Since the June 15, 2010 follow-through day (FTD), this column has steadily noted the importance of remaining very selective and disciplined because all of the major averages are still trading below their downward sloping 50-day moving average (DMA) lines. It is also worrisome to see the 50 DMA line already slice below the 200 DMA line on the NYSE. This event is known by market technicians as a death cross and usually has bearish implications. Trade accordingly.
Are You Ready For A Change?
Inquire Today About Professional Money Management Services:
If your portfolio is greater than $100,000 and you need assistance, click here to get connected with portfolio managers using the fact-based investment system CANSLIM.net is built upon. ** Serious inquires only, please.
PICTURED: The Dow Jones Industrial Average ended lower for the third day in a row while continuing to struggle below its 200 DMA line. Volume behind gains has mostly lacked conviction in the recent rally up from the 2010 lows.
|
|
|
 |
Losses For Defensive, Financial, and Retail Groups
Kenneth J. Gruneisen - Passed the CAN SLIM® Master's Exam
Weakness in the Retail Index ($RLX -1.04%) and losses for the Broker/Dealer Index ($XBD -0.98%) and Bank Index ($BKX -0.37%) created a negative bias for the major averages. Defensive groups were among Monday's laggards as the Healthcare Index ($HMO -1.34%) and Gold & Silver Index ($XAU -1.09%) both fell. Energy-related shares also fell as the Oil Services Index ($OSX -1.14%) and Integrated Oil Index ($XOI -0.69%) sank modestly. The action in the tech sector was mixed, as the Biotechnology Index ($BTK -0.43%) and Internet Index ($IIX -0.11%) edged lower, the Semiconductor Index ($SOX +0.57%) and Networking Index ($NWX +0.80%) posted small gains.
Charts courtesy www.stockcharts.com
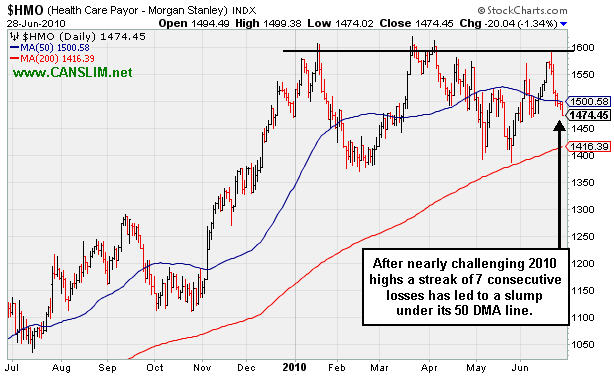
PICTURED: The Healthcare Index ($HMO -1.34%) has been slumping. After nearly challenging 2010 highs a streak of 7 consecutive losses has led to a slump under its 50-day moving average (DMA) line.
| Oil Services |
$OSX |
171.24 |
-1.97 |
-1.14% |
-12.15% |
| Healthcare |
$HMO |
1,474.45 |
-20.04 |
-1.34% |
+0.10% |
| Integrated Oil |
$XOI |
915.91 |
-6.39 |
-0.69% |
-14.26% |
| Semiconductor |
$SOX |
354.11 |
+2.02 |
+0.57% |
-1.61% |
| Networking |
$NWX |
228.50 |
+1.81 |
+0.80% |
-1.11% |
| Internet |
$IIX |
233.45 |
-0.27 |
-0.11% |
-0.17% |
| Broker/Dealer |
$XBD |
102.83 |
-1.01 |
-0.98% |
-10.62% |
| Retail |
$RLX |
403.47 |
-4.25 |
-1.04% |
-1.86% |
| Gold & Silver |
$XAU |
183.11 |
-2.01 |
-1.09% |
+8.83% |
| Bank |
$BKX |
49.01 |
-0.18 |
-0.37% |
+14.75% |
| Biotech |
$BTK |
1,074.52 |
-4.69 |
-0.43% |
+14.05% |
|
|
|
 |
Outlook Better For High-Ranked Computer Software Firm
Kenneth J. Gruneisen - Passed the CAN SLIM® Master's Exam
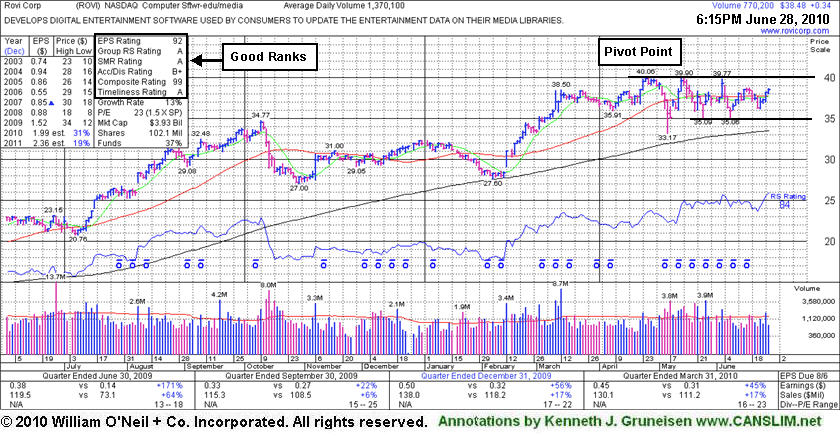
Rovi Corp (ROVI +$0.34 or +0.89% to $38.48) posted a 4th consecutive gain today that helped it climb further above its 50-day moving average (DMA) line to finish the session less than -4% off its 52-week high. Its rebound above its short-term average line helped its outlook improve, and its color code was changed to yellow again. There is not a great deal of resistance due to overhead supply. Disciplined investors will await a convincing gain above its pivot point with heavy volume to trigger a new buy signal. It makes a good candidate to have on investors' watch list, meanwhile the broader market (M criteria) action has been recently lacking leadership and enduring distributional pressure after the latest follow-through day confirmed a new rally. If the rally resumes, odds may favor this high-ranked leader continuing higher after another breakout might offer an ideal point for new or add-on buying efforts.
Its 4/23/10 gain for a new all-time high helped it clear a fresh base but was noted as it lacked sufficient volume to trigger a proper new technical buy signal. Earlier, ROVI had triggered a technical buy signal with a high-volume gain on 3/02/10 that may have signaled the beginning of a substantial advance, but thus far it made limited progress. Earnings per share increases in 3 of the past 4 quarterly comparisons versus the year ago period showed better than +25% growth.
|
|
|
Color Codes Explained :
Y - Better candidates highlighted by our
staff of experts.
G - Previously featured
in past reports as yellow but may no longer be buyable under the
guidelines.
***Last / Change / Volume data in this table is the closing quote data***
Symbol/Exchange
Company Name
Industry Group |
PRICE |
CHANGE
(%Change) |
Day High |
Volume
(% DAV)
(% 50 day avg vol) |
52 Wk Hi
% From Hi |
Featured
Date |
Price
Featured |
Pivot Featured |
|
Max Buy |
AAPL
-
NASDAQ
Apple Inc
COMPUTER HARDWARE - Personal Computers
|
$268.30
|
+1.60
0.60% |
$269.75
|
20,888,405
73.19% of 50 DAV
50 DAV is 28,540,000
|
$279.01
-3.84%
|
6/17/2010
|
$270.95
|
PP = $272.56
|
|
MB = $286.19
|
Most Recent Note - 6/25/2010 4:56:57 PM
Y - Hovering -4.4% off its all-time high. It was featured in the 6/17/10 mid-day report (read here) with a new pivot point cited based upon its all-time high plus ten cents while "working on the right side of a choppy 9-week consolidation marked by heavy distribution."
>>> The latest Featured Stock Update with an annotated graph appeared on 6/17/2010. Click here.
View all notes |
Alert me of new notes |
CANSLIM.net Company Profile |
SEC |
Zacks Reports |
StockTalk |
News |
Chart |
Request a new note
C
A N
S L
I M


|
APEI
-
NASDAQ
American Public Educ Inc
DIVERSIFIED SERVICES - Education and Training Services
|
$45.37
|
-0.05
-0.11% |
$45.91
|
61,314
35.14% of 50 DAV
50 DAV is 174,500
|
$48.95
-7.31%
|
6/7/2010
|
$46.60
|
PP = $46.29
|
|
MB = $48.60
|
Most Recent Note - 6/25/2010 4:58:58 PM
Y - Quietly holding its ground above its 50 DMA line. It slumped below its pivot point after gains to new highs on better volume.
>>> The latest Featured Stock Update with an annotated graph appeared on 6/14/2010. Click here.
View all notes |
Alert me of new notes |
CANSLIM.net Company Profile |
SEC |
Zacks Reports |
StockTalk |
News |
Chart |
Request a new note
C
A N
S L
I M
|
BIDU
-
NASDAQ
Baidu Inc Ads
INTERNET - Internet Information Providers
|
$74.44
|
-1.66
-2.18% |
$76.47
|
7,551,486
50.03% of 50 DAV
50 DAV is 15,092,900
|
$82.29
-9.54%
|
1/13/2010
|
$43.13
|
PP = $42.68
|
|
MB = $44.81
|
 Most Recent Note - 6/28/2010 6:13:04 PM
G - Quietly consolidating -9.6% below its 52-week high while building a choppy late-stage base. Its 50 DMA line defines important initial support above recent lows in the $66 area, where violations would trigger worrisome sell signals.
>>> The latest Featured Stock Update with an annotated graph appeared on 6/21/2010. Click here.
View all notes |
Alert me of new notes |
CANSLIM.net Company Profile |
SEC |
Zacks Reports |
StockTalk |
News |
Chart |
Request a new note
C
A N
S L
I M
|
BRLI
-
NASDAQ
Bio Reference Labs Inc
HEALTH SERVICES - Medical Laboratories and Researc
|
$22.74
|
+0.00
0.00% |
$23.05
|
175,818
89.38% of 50 DAV
50 DAV is 196,700
|
$24.67
-7.84%
|
6/15/2010
|
$23.57
|
PP = $24.77
|
|
MB = $26.01
|
Most Recent Note - 6/25/2010 4:22:44 PM
Y - Enduring mild distributional pressure and closing the week below its 50 DMA line. Gains above its recent high ($23.87 on 6/18/10) would be an encouraging sign.
>>> The latest Featured Stock Update with an annotated graph appeared on 6/15/2010. Click here.
View all notes |
Alert me of new notes |
CANSLIM.net Company Profile |
SEC |
Zacks Reports |
StockTalk |
News |
Chart |
Request a new note
C
A N
S L
I M
|
CISG
-
NASDAQ
Cninsure Inc Ads
INSURANCE - Insurance Brokers
|
$27.55
|
-0.25
-0.90% |
$27.96
|
200,688
62.46% of 50 DAV
50 DAV is 321,300
|
$28.62
-3.74%
|
6/16/2010
|
$27.20
|
PP = $27.75
|
|
MB = $29.14
|
Most Recent Note - 6/25/2010 4:23:36 PM
Y - Hovering -3% off its all-time high in a very tight trading range near its pivot point since featured in the 6/16/10 mid-day report (read here).
>>> The latest Featured Stock Update with an annotated graph appeared on 6/18/2010. Click here.
View all notes |
Alert me of new notes |
CANSLIM.net Company Profile |
SEC |
Zacks Reports |
StockTalk |
News |
Chart |
Request a new note
C
A N
S L
I M
|
Symbol/Exchange
Company Name
Industry Group |
PRICE |
CHANGE
(%Change) |
Day High |
Volume
(% DAV)
(% 50 day avg vol) |
52 Wk Hi
% From Hi |
Featured
Date |
Price
Featured |
Pivot Featured |
|
Max Buy |
CRM
-
NYSE
Salesforce.Com Inc
INTERNET - Internet Software and Services
|
$91.28
|
-0.34
-0.37% |
$92.33
|
1,598,258
57.80% of 50 DAV
50 DAV is 2,765,100
|
$97.94
-6.80%
|
6/2/2010
|
$88.44
|
PP = $89.60
|
|
MB = $94.08
|
Most Recent Note - 6/25/2010 4:25:13 PM
G - Quietly consolidating just above its old pivot point. Prior highs in the $89 area define support just above its 50 DMA line.
>>> The latest Featured Stock Update with an annotated graph appeared on 6/22/2010. Click here.
View all notes |
Alert me of new notes |
CANSLIM.net Company Profile |
SEC |
Zacks Reports |
StockTalk |
News |
Chart |
Request a new note
C
A N
S L
I M
|
DECK
-
NASDAQ
Deckers Outdoor Corp
CONSUMER NON-DURABLES - Textile - Apparel Footwear
|
$153.30
|
-1.75
-1.13% |
$156.33
|
287,673
53.48% of 50 DAV
50 DAV is 537,900
|
$168.52
-9.03%
|
6/11/2010
|
$157.34
|
PP = $158.57
|
|
MB = $166.50
|
Most Recent Note - 6/25/2010 4:30:12 PM
Y - Gain today with near average volume, but it ended down -6% for the week. Its 50 DMA line is an important support level to watch now.
>>> The latest Featured Stock Update with an annotated graph appeared on 6/11/2010. Click here.
View all notes |
Alert me of new notes |
CANSLIM.net Company Profile |
SEC |
Zacks Reports |
StockTalk |
News |
Chart |
Request a new note
C
A N
S L
I M
|
FFIV
-
NASDAQ
F 5 Networks Inc
INTERNET - Internet Software and Services
|
$73.51
|
+1.62
2.25% |
$74.48
|
1,200,256
70.65% of 50 DAV
50 DAV is 1,698,900
|
$77.10
-4.66%
|
6/16/2010
|
$74.50
|
PP = $74.10
|
|
MB = $77.81
|
Most Recent Note - 6/28/2010 6:09:31 PM
Y - Gain today on light volume, still below its pivot point after pulling back and testing support at its 50 DMA line last week.
>>> The latest Featured Stock Update with an annotated graph appeared on 6/16/2010. Click here.
View all notes |
Alert me of new notes |
CANSLIM.net Company Profile |
SEC |
Zacks Reports |
StockTalk |
News |
Chart |
Request a new note
C
A N
S L
I M
|
MELI
-
NASDAQ
Mercadolibre Inc
INTERNET - Internet Software and; Services
|
$57.22
|
-0.93
-1.60% |
$59.20
|
829,574
95.09% of 50 DAV
50 DAV is 872,400
|
$62.14
-7.92%
|
5/13/2010
|
$54.21
|
PP = $55.85
|
|
MB = $58.64
|
Most Recent Note - 6/25/2010 3:34:13 PM
G - Considerable gain today with above average volume, rallying after a pullback tested support near prior chart highs in the $55 area.
>>> The latest Featured Stock Update with an annotated graph appeared on 6/10/2010. Click here.
View all notes |
Alert me of new notes |
CANSLIM.net Company Profile |
SEC |
Zacks Reports |
StockTalk |
News |
Chart |
Request a new note
C
A N
S L
I M
|
NEM
-
NYSE
Newmont Mining Corp
METALS and MINING - Gold
|
$61.46
|
-0.21
-0.34% |
$62.62
|
12,328,302
127.67% of 50 DAV
50 DAV is 9,656,600
|
$62.11
-1.05%
|
6/22/2010
|
$59.60
|
PP = $59.67
|
|
MB = $62.65
|
Most Recent Note - 6/28/2010 12:51:12 PM
Y - Reversed into the red today after early gains for a new 52-week high. The America-based mining firm has some reassuring leadership (L criteria) from other Mining - Gold/Silver/Gems industry firms as a favorable backdrop. No overhead supply remains to act as resistance. Featured in a 6/22/10 Stock Bulletin with annotated graph (read here).
>>> The latest Featured Stock Update with an annotated graph appeared on 6/22/2010. Click here.
View all notes |
Alert me of new notes |
CANSLIM.net Company Profile |
SEC |
Zacks Reports |
StockTalk |
News |
Chart |
Request a new note
C
A N
S L
I M
|
Symbol/Exchange
Company Name
Industry Group |
PRICE |
CHANGE
(%Change) |
Day High |
Volume
(% DAV)
(% 50 day avg vol) |
52 Wk Hi
% From Hi |
Featured
Date |
Price
Featured |
Pivot Featured |
|
Max Buy |
ROVI
-
NASDAQ
Rovi Corp
COMPUTER SOFTWARE andamp; SERVICES - Security Software andamp; Services
|
$38.48
|
+0.34
0.89% |
$38.65
|
806,679
58.88% of 50 DAV
50 DAV is 1,370,100
|
$40.06
-3.94%
|
6/3/2010
|
$38.70
|
PP = $40.16
|
|
MB = $42.17
|
Most Recent Note - 6/28/2010 6:24:14 PM
Y - Today's 4th consecutive gain helped it climb further above its 50 DMA line. to less than -4% off its 52-week high. Color code is changed to yellow again, while disciplined investors will await a convincing gain above its pivot point with heavy volume to trigger a new buy signal. Prior lows near $35 area define support above its 200 DMA line.
>>> The latest Featured Stock Update with an annotated graph appeared on 6/28/2010. Click here.
View all notes |
Alert me of new notes |
CANSLIM.net Company Profile |
SEC |
Zacks Reports |
StockTalk |
News |
Chart |
Request a new note
C
A N
S L
I M
|
SUMR
-
NASDAQ
Summer Infant Inc
CONSUMER NON-DURABLES - Personal Products
|
$6.80
|
+0.02
0.29% |
$6.97
|
56,570
53.98% of 50 DAV
50 DAV is 104,800
|
$8.42
-19.24%
|
5/4/2010
|
$6.85
|
PP = $7.09
|
|
MB = $7.44
|
Most Recent Note - 6/25/2010 4:36:49 PM
G - Small loss on very heavy volume today. Since negating its breakout volume behind gains has been light. Gains above its 50 DMA line and above recent chart highs near $7.40 would be an encouraging technical improvement while recent chart lows in the $6.25 area define important support to watch.
>>> The latest Featured Stock Update with an annotated graph appeared on 6/24/2010. Click here.
View all notes |
Alert me of new notes |
CANSLIM.net Company Profile |
SEC |
Zacks Reports |
StockTalk |
News |
Chart |
Request a new note
C
A N
S L
I M
|
THOR
-
NASDAQ
Thoratec Corp
HEALTH SERVICES - Medical Instruments and Supplies
|
$44.76
|
+0.89
2.03% |
$46.26
|
1,168,164
101.45% of 50 DAV
50 DAV is 1,151,500
|
$47.93
-6.61%
|
6/3/2010
|
$44.38
|
PP = $45.35
|
|
MB = $47.62
|
Most Recent Note - 6/28/2010 6:12:07 PM
Y- Gapped up today but closed in the lower half of its intra-day range. Its slump below its pivot point raised concerns last week.
>>> The latest Featured Stock Update with an annotated graph appeared on 6/23/2010. Click here.
View all notes |
Alert me of new notes |
CANSLIM.net Company Profile |
SEC |
Zacks Reports |
StockTalk |
News |
Chart |
Request a new note
C
A N
S L
I M
|
ULTA
-
NASDAQ
Ulta Salon Cosm & Frag
SPECIALTY RETAIL - Specialty Retail, Other
|
$25.82
|
+0.90
3.61% |
$26.03
|
726,934
111.82% of 50 DAV
50 DAV is 650,100
|
$26.75
-3.48%
|
5/28/2010
|
$25.58
|
PP = $25.86
|
|
MB = $27.15
|
Most Recent Note - 6/28/2010 6:06:22 PM
Y - Closed near the session high again today with another gain on average volume following a positive reversal on 6/25/10 after dipping near its 50 DMA line.
>>> The latest Featured Stock Update with an annotated graph appeared on 6/25/2010. Click here.
View all notes |
Alert me of new notes |
CANSLIM.net Company Profile |
SEC |
Zacks Reports |
StockTalk |
News |
Chart |
Request a new note
C
A N
S L
I M
|
|
|
|
THESE ARE NOT BUY RECOMMENDATIONS!
Comments contained in the body of this report are technical
opinions only. The material herein has been obtained
from sources believed to be reliable and accurate, however,
its accuracy and completeness cannot be guaranteed.
This site is not an investment advisor, hence it does
not endorse or recommend any securities or other investments.
Any recommendation contained in this report may not
be suitable for all investors and it is not to be deemed
an offer or solicitation on our part with respect to
the purchase or sale of any securities. All trademarks,
service marks and trade names appearing in this report
are the property of their respective owners, and are
likewise used for identification purposes only.
This report is a service available
only to active Paid Premium Members.
You may opt-out of receiving report notifications
at any time. Questions or comments may be submitted
by writing to Premium Membership Services 665 S.E. 10 Street, Suite 201 Deerfield Beach, FL 33441-5634 or by calling 1-800-965-8307
or 954-785-1121.
|
|
|


