Symbol/Exchange
Company Name
Industry Group |
PRICE |
CHANGE
(%Change) |
Day High |
Volume
(% DAV)
(% 50 day avg vol) |
52 Wk Hi
% From Hi |
Featured
Date |
Price
Featured |
Pivot Featured |
|
Max Buy |
CACC
-
NASDAQ
Credit Acceptance Corp
FINANCIAL SERVICES - Credit Services
|
$76.31
|
-0.50
-0.65% |
$77.47
|
17,884
47.69% of 50 DAV
50 DAV is 37,500
|
$82.29
-7.27%
|
6/2/2011
|
$76.10
|
PP = $82.39
|
|
MB = $86.51
|
Most Recent Note - 6/6/2011 8:18:53 PM
Y - This high-ranked leader in the Finance - Consumer Loans industry is thinly traded (37,100 shares average daily volume) and has a small supply (S criteria) of shares outstanding. Strong earnings history satisfies the C and A criteria. It is consolidating near its 50 DMA line which defines important support along with recent lows near $75. A subsequent gain above its pivot point with heavy volume would trigger a technical buy signal, meanwhile it has formed a sound new base pattern of sufficient length and its color code was changed to yellow with a pivot point based on its 52-week high plus 10 cents. See the latest FSU analysis for more details and a new annotated weekly graph.
>>> The latest Featured Stock Update with an annotated graph appeared on 6/6/2011. Click here.
View all notes |
Alert me of new notes |
CANSLIM.net Company Profile |
SEC |
Zacks Reports |
StockTalk |
News |
Chart |
Request a new note
C
A N
S L
I M


|
CEVA
-
NASDAQ
Ceva Inc
ELECTRONICS - Semiconductor - Specialized
|
$30.81
|
-0.47
-1.50% |
$31.46
|
183,693
81.97% of 50 DAV
50 DAV is 224,100
|
$35.60
-13.46%
|
5/25/2011
|
$32.98
|
PP = $32.05
|
|
MB = $33.65
|
Most Recent Note - 6/7/2011 2:30:53 PM
Y - Today's gain on light volume follows 4 consecutive losses with higher volume indicative of mild distributional pressure. As previously noted - "Its slump below its pivot point has raised concerns. Prior highs define support to watch above its 50 DMA line."
>>> The latest Featured Stock Update with an annotated graph appeared on 5/25/2011. Click here.
View all notes |
Alert me of new notes |
CANSLIM.net Company Profile |
SEC |
Zacks Reports |
StockTalk |
News |
Chart |
Request a new note
C
A N
S L
I M
|
CMG
-
NYSE
Chipotle Mexican Grill
LEISURE - Restaurants
|
$277.11
|
-4.19
-1.49% |
$283.92
|
655,280
60.88% of 50 DAV
50 DAV is 1,076,400
|
$295.99
-6.38%
|
4/1/2011
|
$274.00
|
PP = $275.10
|
|
MB = $288.86
|
Most Recent Note - 6/6/2011 6:42:55 PM
G - Down again today with very quiet volume, closing near the session low while still perched just -5.2% off its all-time high. No resistance remains due to overhead supply. Formed a 5-week base with volume totals cooling in recent weeks while finding support near its 50 DMA line. Its sub par earnings increase of +23% in the latest quarter ended March 31st, 2011 versus the year ago period raised concern while marking its weakest quarterly earnings increase in more than 2 years.
>>> The latest Featured Stock Update with an annotated graph appeared on 5/17/2011. Click here.
View all notes |
Alert me of new notes |
CANSLIM.net Company Profile |
SEC |
Zacks Reports |
StockTalk |
News |
Chart |
Request a new note
C
A N
S L
I M
|
EZPW
-
NASDAQ
Ezcorp Inc Cl A
SPECIALTY RETAIL - Specialty Retail, Other
|
$31.75
|
+0.29
0.92% |
$32.47
|
626,129
183.83% of 50 DAV
50 DAV is 340,600
|
$33.31
-4.68%
|
2/18/2011
|
$27.94
|
PP = $30.04
|
|
MB = $31.54
|
 Most Recent Note - 6/8/2011 12:37:26 PM
G - Rallying from a test of support at its 50 DMA line, building on a choppy new base. Recent lows and its 50 DMA line define important nearby chart support to watch where technical violations would raise more serious concerns.
>>> The latest Featured Stock Update with an annotated graph appeared on 5/10/2011. Click here.
View all notes |
Alert me of new notes |
CANSLIM.net Company Profile |
SEC |
Zacks Reports |
StockTalk |
News |
Chart |
Request a new note
C
A N
S L
I M
|
FCFS
-
NASDAQ
First Cash Financial Svs
SPECIALTY RETAIL - Specialty Retail, Other
|
$39.41
|
+0.58
1.49% |
$39.75
|
197,961
97.71% of 50 DAV
50 DAV is 202,600
|
$42.36
-6.96%
|
5/31/2011
|
$42.00
|
PP = $40.23
|
|
MB = $42.24
|
Most Recent Note - 6/6/2011 6:46:14 PM
G - Small gain today with near average volume while finding support near its 50 DMA line and prior lows. Its color code was changed to green after damaging losses on higher volume negated its latest breakout.
>>> The latest Featured Stock Update with an annotated graph appeared on 5/31/2011. Click here.
View all notes |
Alert me of new notes |
CANSLIM.net Company Profile |
SEC |
Zacks Reports |
StockTalk |
News |
Chart |
Request a new note
C
A N
S L
I M
|
Symbol/Exchange
Company Name
Industry Group |
PRICE |
CHANGE
(%Change) |
Day High |
Volume
(% DAV)
(% 50 day avg vol) |
52 Wk Hi
% From Hi |
Featured
Date |
Price
Featured |
Pivot Featured |
|
Max Buy |
FOSL
-
NASDAQ
Fossil Inc
CONSUMER DURABLES - Recreational Goods, Other
|
$102.41
|
+0.62
0.61% |
$103.91
|
1,164,660
161.58% of 50 DAV
50 DAV is 720,800
|
$107.54
-4.77%
|
2/1/2011
|
$73.30
|
PP = $74.44
|
|
MB = $78.16
|
Most Recent Note - 6/8/2011 12:38:22 PM
G - Volume totals have been cooling while still consolidating in a tight range. Prior highs near $96 define initial support to watch coinciding with its 50 DMA line. See the latest FSU analysis for more details and a new annotated graph.
>>> The latest Featured Stock Update with an annotated graph appeared on 6/7/2011. Click here.
View all notes |
Alert me of new notes |
CANSLIM.net Company Profile |
SEC |
Zacks Reports |
StockTalk |
News |
Chart |
Request a new note
C
A N
S L
I M
|
HS
-
NYSE
Healthspring Inc
HEALTH SERVICES - Health Care Plans
|
$41.77
|
+0.35
0.85% |
$42.64
|
774,092
88.06% of 50 DAV
50 DAV is 879,100
|
$45.11
-7.40%
|
3/22/2011
|
$38.29
|
PP = $38.85
|
|
MB = $40.79
|
Most Recent Note - 6/6/2011 7:11:14 PM
G - Volume totals have been below average and cooling in recent weeks. Today's loss has it testing its 50 DMA line. That important short-term average defines chart support to watch where a violation would trigger a technical sell signal.
>>> The latest Featured Stock Update with an annotated graph appeared on 5/20/2011. Click here.
View all notes |
Alert me of new notes |
CANSLIM.net Company Profile |
SEC |
Zacks Reports |
StockTalk |
News |
Chart |
Request a new note
C
A N
S L
I M
|
INFA
-
NASDAQ
Informatica Corp
COMPUTER SOFTWARE and SERVICES - Business Software and Services
|
$54.72
|
-1.48
-2.63% |
$56.07
|
1,458,108
122.52% of 50 DAV
50 DAV is 1,190,100
|
$59.98
-8.77%
|
3/24/2011
|
$50.04
|
PP = $49.86
|
|
MB = $52.35
|
Most Recent Note - 6/8/2011 4:31:54 PM
G - Down today with above average volume, slumping near its 50 DMA line which defines near-term support to watch. It hit a new 52-week high on 6/01/11 and then there was a negative reversal for a loss on above average volume. This high-ranked Computer Software - Database firm did not form a sound new base pattern.
>>> The latest Featured Stock Update with an annotated graph appeared on 5/24/2011. Click here.
View all notes |
Alert me of new notes |
CANSLIM.net Company Profile |
SEC |
Zacks Reports |
StockTalk |
News |
Chart |
Request a new note
C
A N
S L
I M
|
MELI
-
NASDAQ
Mercadolibre Inc
INTERNET - Internet Software and; Services
|
$78.33
|
-3.41
-4.17% |
$81.68
|
835,470
112.78% of 50 DAV
50 DAV is 740,800
|
$92.73
-15.53%
|
6/1/2011
|
$90.55
|
PP = $92.83
|
|
MB = $97.47
|
Most Recent Note - 6/8/2011 1:39:00 PM
G - Damaging losses for a 4th consecutive session have it slumping near prior highs after its previously noted 50 DMA line violation triggered a technical sell signal. Disciplined investors resisted the urge to get in "early", since it did not confirm a buy signal after featured in the 6/01/11 mid-day report. Regardless, losses should always be limited if any stock falls -7% from your purchase price to eliminate the chance of greater gains. Color code was changed to green based on its deterioration, meanwhile, a subsequent rebound above its short-term average is needed to improve its outlook.
>>> The latest Featured Stock Update with an annotated graph appeared on 6/3/2011. Click here.
View all notes |
Alert me of new notes |
CANSLIM.net Company Profile |
SEC |
Zacks Reports |
StockTalk |
News |
Chart |
Request a new note
C
A N
S L
I M
|
MG
-
NYSE
Mistras Group Inc
DIVERSIFIED SERVICES - Bulding and Faci;ity Management Services
|
$16.28
|
-0.21
-1.27% |
$16.60
|
144,346
91.19% of 50 DAV
50 DAV is 158,300
|
$18.46
-11.81%
|
3/15/2011
|
$15.48
|
PP = $15.90
|
|
MB = $16.70
|
Most Recent Note - 6/8/2011 7:23:07 PM
G - Volume was higher but below average today, and as it marked its 6th consecutive loss the recent low ($16.10 on 5/25/11) was also breached intra-day. On 5/05/11 it completed a Public Offering. More recently it has been slumping below its 50 DMA line and that important short-term average acted as resistance.
>>> The latest Featured Stock Update with an annotated graph appeared on 5/12/2011. Click here.
View all notes |
Alert me of new notes |
CANSLIM.net Company Profile |
SEC |
Zacks Reports |
StockTalk |
News |
Chart |
Request a new note
C
A N
S L
I M
|
Symbol/Exchange
Company Name
Industry Group |
PRICE |
CHANGE
(%Change) |
Day High |
Volume
(% DAV)
(% 50 day avg vol) |
52 Wk Hi
% From Hi |
Featured
Date |
Price
Featured |
Pivot Featured |
|
Max Buy |
MWIV
-
NASDAQ
M W I Veterinary Supply
HEALTH SERVICES - Medical Instruments and; Supplies
|
$79.91
|
+1.36
1.73% |
$80.78
|
73,640
81.19% of 50 DAV
50 DAV is 90,700
|
$86.99
-8.14%
|
11/4/2010
|
$61.79
|
PP = $59.60
|
|
MB = $62.58
|
Most Recent Note - 6/6/2011 7:17:22 PM
G - Down today for a 3rd loss in the span of 4 sessions with above average volume, violating its 50 DMA line and recent chart lows triggering technical sell signals.
>>> The latest Featured Stock Update with an annotated graph appeared on 5/5/2011. Click here.
View all notes |
Alert me of new notes |
CANSLIM.net Company Profile |
SEC |
Zacks Reports |
StockTalk |
News |
Chart |
Request a new note
C
A N
S L
I M
|
OPNT
-
NASDAQ
Opnet Technologies
INTERNET - Internet Software and Services
|
$37.75
|
-0.48
-1.26% |
$38.27
|
155,805
118.57% of 50 DAV
50 DAV is 131,400
|
$42.51
-11.20%
|
5/11/2011
|
$41.21
|
PP = $40.50
|
|
MB = $42.53
|
Most Recent Note - 6/6/2011 6:57:23 PM
G - Solid gain with above average volume today helped it rally back near its 50 DMA line. Subsequent deterioration under recent lows in the $35-36 area would raise greater concerns.
>>> The latest Featured Stock Update with an annotated graph appeared on 5/11/2011. Click here.
View all notes |
Alert me of new notes |
CANSLIM.net Company Profile |
SEC |
Zacks Reports |
StockTalk |
News |
Chart |
Request a new note
C
A N
S L
I M
|
OTEX
-
NASDAQ
Open Text Corp
INTERNET - Internet Software and Services
|
$61.58
|
-1.22
-1.94% |
$62.80
|
441,656
121.77% of 50 DAV
50 DAV is 362,700
|
$67.08
-8.20%
|
6/1/2011
|
$65.86
|
PP = $67.18
|
|
MB = $70.54
|
Most Recent Note - 6/8/2011 5:27:51 PM
G - Disciplined investors avoided the temptation to get in "early" before a technical buy signal. A breakout did not occur, and it was down today for a 5th consecutive loss while volume increased to above average and it violated its 50 DMA line. Color code is changed to green based on damaging technical deterioration.
>>> The latest Featured Stock Update with an annotated graph appeared on 6/2/2011. Click here.
View all notes |
Alert me of new notes |
CANSLIM.net Company Profile |
SEC |
Zacks Reports |
StockTalk |
News |
Chart |
Request a new note
C
A N
S L
I M
|
PCLN
-
NASDAQ
Priceline.Com Inc
INTERNET - Internet Software and Services
|
$500.68
|
-5.44
-1.07% |
$509.81
|
786,594
73.96% of 50 DAV
50 DAV is 1,063,500
|
$561.88
-10.89%
|
1/3/2011
|
$399.55
|
PP = $428.20
|
|
MB = $449.61
|
Most Recent Note - 6/6/2011 7:02:30 PM
G - Volume totals have been cooling in recent weeks while lingering just below its 50 DMA line. Recent chart low ($487.70 on 5/25/11) defines an important near-term support level where further deterioration would raise even greater concerns.
>>> The latest Featured Stock Update with an annotated graph appeared on 5/19/2011. Click here.
View all notes |
Alert me of new notes |
CANSLIM.net Company Profile |
SEC |
Zacks Reports |
StockTalk |
News |
Chart |
Request a new note
C
A N
S L
I M
|
RAX
-
NYSE
Rackspace Hosting Inc
INTERNET - Internet Software and; Services
|
$40.34
|
-1.42
-3.40% |
$41.57
|
1,697,125
90.36% of 50 DAV
50 DAV is 1,878,200
|
$46.50
-13.24%
|
6/3/2011
|
$43.36
|
PP = $46.59
|
|
MB = $48.92
|
Most Recent Note - 6/8/2011 4:28:33 PM
G - Gapped down today and slumped to its lowest close since 3/29/11, raising concerns. Color code is changed to green based on recent deterioration, and a breach of its recent chart low ($38.84 on 5/12/11) would trigger a more worrisome technical sell signal.
>>> The latest Featured Stock Update with an annotated graph appeared on 5/13/2011. Click here.
View all notes |
Alert me of new notes |
CANSLIM.net Company Profile |
SEC |
Zacks Reports |
StockTalk |
News |
Chart |
Request a new note
C
A N
S L
I M
|
Symbol/Exchange
Company Name
Industry Group |
PRICE |
CHANGE
(%Change) |
Day High |
Volume
(% DAV)
(% 50 day avg vol) |
52 Wk Hi
% From Hi |
Featured
Date |
Price
Featured |
Pivot Featured |
|
Max Buy |
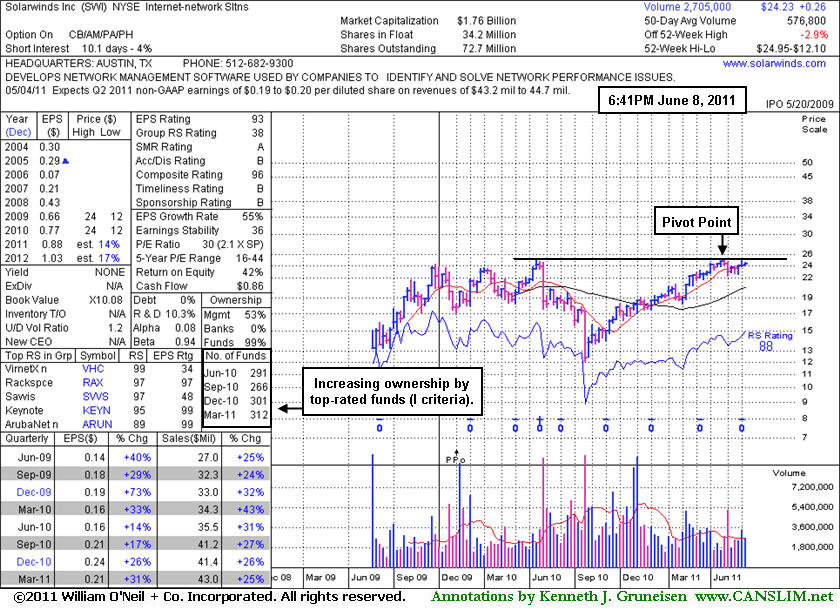
SWI
-
NYSE
Solarwinds Inc
COMPUTER SOFTWARE and SERVICES - Application Software
|
$24.23
|
-0.12
-0.49% |
$24.60
|
904,286
156.78% of 50 DAV
50 DAV is 576,800
|
$24.95
-2.89%
|
6/7/2011
|
$24.22
|
PP = $25.05
|
|
MB = $26.30
|
Most Recent Note - 6/8/2011 7:15:13 PM
Y - Perched -2.9% off its all-time high today, and no overhead supply remains to hinder its progress. Color code was changed to yellow when featured in the 6/07/11 mid-day report with an annotated daily graph after an orderly base with pivot point based upon its 52-week high plus 10 cents. To trigger a buy signal it needs a gain above its pivot point with sufficient volume and a follow-through day to confirm the broader market (M criteria) is favorable. See the latest FSU analysis for more details and a new annotated weekly graph.
>>> The latest Featured Stock Update with an annotated graph appeared on 6/8/2011. Click here.
View all notes |
Alert me of new notes |
CANSLIM.net Company Profile |
SEC |
Zacks Reports |
StockTalk |
News |
Chart |
Request a new note
C
A N
S L
I M
|
TIBX
-
NASDAQ
Tibco Software Inc
COMPUTER SOFTWARE and SERVICES - Business Software and Services
|
$25.83
|
-0.31
-1.17% |
$26.36
|
2,729,662
98.11% of 50 DAV
50 DAV is 2,782,300
|
$30.75
-16.00%
|
3/18/2011
|
$23.88
|
PP = $26.04
|
|
MB = $27.34
|
Most Recent Note - 6/6/2011 6:35:10 PM
G - Down further today on light volume, closing near the session low. Serious concerns were raised last week after it technically triggered sell signals with losses and slumped below its 50 DMA line. Overhead supply up through the $30 area may now act as resistance.
>>> The latest Featured Stock Update with an annotated graph appeared on 5/18/2011. Click here.
View all notes |
Alert me of new notes |
CANSLIM.net Company Profile |
SEC |
Zacks Reports |
StockTalk |
News |
Chart |
Request a new note
C
A N
S L
I M
|
ULTA
-
NASDAQ
Ulta Salon Cosm & Frag
SPECIALTY RETAIL - Specialty Retail, Other
|
$55.90
|
+6.29
12.68% |
$56.83
|
3,944,936
717.91% of 50 DAV
50 DAV is 549,500
|
$57.17
-2.22%
|
1/6/2011
|
$36.12
|
PP = $37.34
|
|
MB = $39.21
|
Most Recent Note - 6/8/2011 9:56:18 AM
G - Gapped up today after reporting earnings +61% on +21% sales revenues for the quarter ended April 30, 2011 versus the year ago period. It repaired its 50 DMA violation and challenged its 52-week high.
>>> The latest Featured Stock Update with an annotated graph appeared on 5/26/2011. Click here.
View all notes |
Alert me of new notes |
CANSLIM.net Company Profile |
SEC |
Zacks Reports |
StockTalk |
News |
Chart |
Request a new note
C
A N
S L
I M
|
ZAGG
-
NASDAQ
Zagg Inc
SPECIALTY RETAIL - Specialty Retail, Other
|
$10.29
|
-0.26
-2.46% |
$10.57
|
701,412
60.32% of 50 DAV
50 DAV is 1,162,900
|
$11.53
-10.75%
|
6/1/2011
|
$10.92
|
PP = $10.59
|
|
MB = $11.12
|
Most Recent Note - 6/8/2011 4:39:04 PM
Y - Loss today with lighter volume led to a close further below its pivot point, raising concerns. Technically it broke out from a cup-with-handle type base last week. Prior high closes define important chart support to watch on pullbacks.
>>> The latest Featured Stock Update with an annotated graph appeared on 6/1/2011. Click here.
View all notes |
Alert me of new notes |
CANSLIM.net Company Profile |
SEC |
Zacks Reports |
StockTalk |
News |
Chart |
Request a new note
C
A N
S L
I M
|