***Last / Change / Volume data in this table is the closing quote data***
Symbol/Exchange
Company Name
Industry Group |
PRICE |
CHANGE
(%Change) |
Day High |
Volume
(% DAV)
(% 50 day avg vol) |
52 Wk Hi
% From Hi |
Featured
Date |
Price
Featured |
Pivot Featured |
|
Max Buy |
CACC
-
NASDAQ
Credit Acceptance Corp
FINANCIAL SERVICES - Credit Services
|
$76.81
|
+0.29
0.38% |
$77.57
|
28,166
75.51% of 50 DAV
50 DAV is 37,300
|
$82.29
-6.66%
|
6/2/2011
|
$76.10
|
PP = $82.39
|
|
MB = $86.51
|
Most Recent Note - 6/6/2011 8:18:53 PM
Y - This high-ranked leader in the Finance - Consumer Loans industry is thinly traded (37,100 shares average daily volume) and has a small supply (S criteria) of shares outstanding. Strong earnings history satisfies the C and A criteria. It is consolidating near its 50 DMA line which defines important support along with recent lows near $75. A subsequent gain above its pivot point with heavy volume would trigger a technical buy signal, meanwhile it has formed a sound new base pattern of sufficient length and its color code was changed to yellow with a pivot point based on its 52-week high plus 10 cents. See the latest FSU analysis for more details and a new annotated weekly graph.
>>> The latest Featured Stock Update with an annotated graph appeared on 6/6/2011. Click here.
View all notes |
Alert me of new notes |
CANSLIM.net Company Profile |
SEC |
Zacks Reports |
StockTalk |
News |
Chart |
Request a new note
C
A N
S L
I M


|
CEVA
-
NASDAQ
Ceva Inc
ELECTRONICS - Semiconductor - Specialized
|
$31.28
|
+0.58
1.89% |
$31.85
|
140,778
62.54% of 50 DAV
50 DAV is 225,100
|
$35.60
-12.13%
|
5/25/2011
|
$32.98
|
PP = $32.05
|
|
MB = $33.65
|
 Most Recent Note - 6/7/2011 2:30:53 PM
Y - Today's gain on light volume follows 4 consecutive losses with higher volume indicative of mild distributional pressure. As previously noted - "Its slump below its pivot point has raised concerns. Prior highs define support to watch above its 50 DMA line."
>>> The latest Featured Stock Update with an annotated graph appeared on 5/25/2011. Click here.
View all notes |
Alert me of new notes |
CANSLIM.net Company Profile |
SEC |
Zacks Reports |
StockTalk |
News |
Chart |
Request a new note
C
A N
S L
I M
|
CMG
-
NYSE
Chipotle Mexican Grill
LEISURE - Restaurants
|
$281.30
|
+0.56
0.20% |
$284.87
|
405,997
37.39% of 50 DAV
50 DAV is 1,085,900
|
$295.99
-4.96%
|
4/1/2011
|
$274.00
|
PP = $275.10
|
|
MB = $288.86
|
Most Recent Note - 6/6/2011 6:42:55 PM
G - Down again today with very quiet volume, closing near the session low while still perched just -5.2% off its all-time high. No resistance remains due to overhead supply. Formed a 5-week base with volume totals cooling in recent weeks while finding support near its 50 DMA line. Its sub par earnings increase of +23% in the latest quarter ended March 31st, 2011 versus the year ago period raised concern while marking its weakest quarterly earnings increase in more than 2 years.
>>> The latest Featured Stock Update with an annotated graph appeared on 5/17/2011. Click here.
View all notes |
Alert me of new notes |
CANSLIM.net Company Profile |
SEC |
Zacks Reports |
StockTalk |
News |
Chart |
Request a new note
C
A N
S L
I M
|
EZPW
-
NASDAQ
Ezcorp Inc Cl A
SPECIALTY RETAIL - Specialty Retail, Other
|
$31.46
|
+1.04
3.42% |
$31.75
|
391,522
113.32% of 50 DAV
50 DAV is 345,500
|
$33.31
-5.55%
|
2/18/2011
|
$27.94
|
PP = $30.04
|
|
MB = $31.54
|
Most Recent Note - 6/7/2011 2:28:37 PM
G - Considerable gain today without great volume conviction. Rallying from a test of support at its 50 DMA line following a "negative reversal" on 6/01/11 for a loss on higher volume after touching a new 52-week high. Recent lows and its 50 DMA line define important nearby chart support to watch where technical violations would raise more serious concerns.
>>> The latest Featured Stock Update with an annotated graph appeared on 5/10/2011. Click here.
View all notes |
Alert me of new notes |
CANSLIM.net Company Profile |
SEC |
Zacks Reports |
StockTalk |
News |
Chart |
Request a new note
C
A N
S L
I M
|
FCFS
-
NASDAQ
First Cash Financial Svs
SPECIALTY RETAIL - Specialty Retail, Other
|
$38.83
|
+0.26
0.67% |
$39.72
|
357,301
175.06% of 50 DAV
50 DAV is 204,100
|
$42.36
-8.33%
|
5/31/2011
|
$42.00
|
PP = $40.23
|
|
MB = $42.24
|
Most Recent Note - 6/6/2011 6:46:14 PM
G - Small gain today with near average volume while finding support near its 50 DMA line and prior lows. Its color code was changed to green after damaging losses on higher volume negated its latest breakout.
>>> The latest Featured Stock Update with an annotated graph appeared on 5/31/2011. Click here.
View all notes |
Alert me of new notes |
CANSLIM.net Company Profile |
SEC |
Zacks Reports |
StockTalk |
News |
Chart |
Request a new note
C
A N
S L
I M
|
Symbol/Exchange
Company Name
Industry Group |
PRICE |
CHANGE
(%Change) |
Day High |
Volume
(% DAV)
(% 50 day avg vol) |
52 Wk Hi
% From Hi |
Featured
Date |
Price
Featured |
Pivot Featured |
|
Max Buy |
FOSL
-
NASDAQ
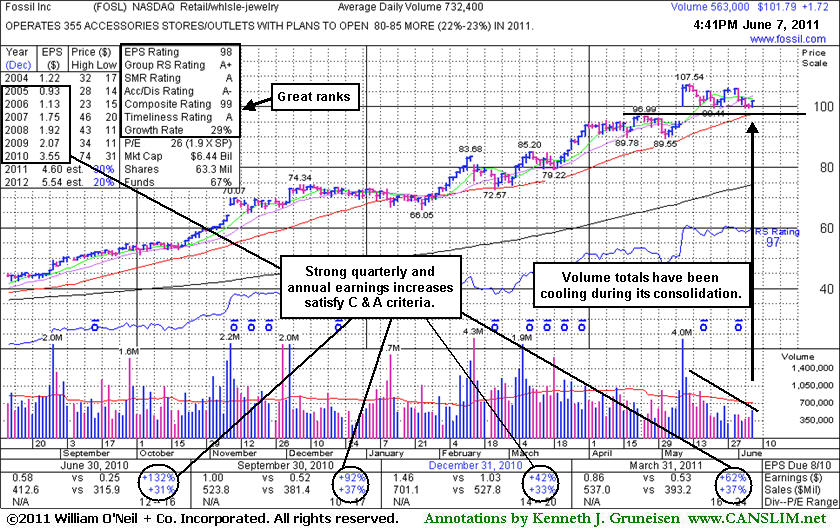
Fossil Inc
CONSUMER DURABLES - Recreational Goods, Other
|
$101.79
|
+1.72
1.72% |
$101.99
|
578,764
79.02% of 50 DAV
50 DAV is 732,400
|
$107.54
-5.35%
|
2/1/2011
|
$73.30
|
PP = $74.44
|
|
MB = $78.16
|
Most Recent Note - 6/7/2011 6:20:02 PM
G - Its volume totals have been cooling while consolidating in a tight range. Prior highs near $96 define initial support to watch coinciding with its 50 DMA line. See the latest FSU analysis for more details and a new annotated graph.
>>> The latest Featured Stock Update with an annotated graph appeared on 6/7/2011. Click here.
View all notes |
Alert me of new notes |
CANSLIM.net Company Profile |
SEC |
Zacks Reports |
StockTalk |
News |
Chart |
Request a new note
C
A N
S L
I M
|
HS
-
NYSE
Healthspring Inc
HEALTH SERVICES - Health Care Plans
|
$41.42
|
+0.55
1.35% |
$41.62
|
662,780
66.40% of 50 DAV
50 DAV is 998,100
|
$45.11
-8.18%
|
3/22/2011
|
$38.29
|
PP = $38.85
|
|
MB = $40.79
|
Most Recent Note - 6/6/2011 7:11:14 PM
G - Volume totals have been below average and cooling in recent weeks. Today's loss has it testing its 50 DMA line. That important short-term average defines chart support to watch where a violation would trigger a technical sell signal.
>>> The latest Featured Stock Update with an annotated graph appeared on 5/20/2011. Click here.
View all notes |
Alert me of new notes |
CANSLIM.net Company Profile |
SEC |
Zacks Reports |
StockTalk |
News |
Chart |
Request a new note
C
A N
S L
I M
|
INFA
-
NASDAQ
Informatica Corp
COMPUTER SOFTWARE and SERVICES - Business Software and Services
|
$56.20
|
+0.34
0.61% |
$56.71
|
1,310,219
110.59% of 50 DAV
50 DAV is 1,184,800
|
$59.98
-6.30%
|
3/24/2011
|
$50.04
|
PP = $49.86
|
|
MB = $52.35
|
Most Recent Note - 6/6/2011 7:13:20 PM
G - Pulling back today for a 3rd consecutive loss with lighter than average volume since it hit a new 52-week high on 6/01/11 then reversed into the red for a loss on above average volume. This high-ranked Computer Software - Database firm did not form a sound new base pattern. Its 50 DMA line defines near-term support to watch.
>>> The latest Featured Stock Update with an annotated graph appeared on 5/24/2011. Click here.
View all notes |
Alert me of new notes |
CANSLIM.net Company Profile |
SEC |
Zacks Reports |
StockTalk |
News |
Chart |
Request a new note
C
A N
S L
I M
|
MELI
-
NASDAQ
Mercadolibre Inc
INTERNET - Internet Software and; Services
|
$81.74
|
-0.42
-0.51% |
$82.60
|
1,148,595
157.41% of 50 DAV
50 DAV is 729,700
|
$92.73
-11.85%
|
6/1/2011
|
$90.55
|
PP = $92.83
|
|
MB = $97.47
|
Most Recent Note - 6/6/2011 6:23:04 PM
G - Considerable loss today with heavy volume violated its 50 DMA line triggering a technical sell signal. It did not confirm a buy signal after featured in the 6/01/11 mid-day report. Color code is changed to green based on its deterioration, meanwhile, a subsequent rebound above its short-term average is needed to improve its outlook.
>>> The latest Featured Stock Update with an annotated graph appeared on 6/3/2011. Click here.
View all notes |
Alert me of new notes |
CANSLIM.net Company Profile |
SEC |
Zacks Reports |
StockTalk |
News |
Chart |
Request a new note
C
A N
S L
I M
|
MG
-
NYSE
Mistras Group Inc
DIVERSIFIED SERVICES - Bulding and Faci;ity Management Services
|
$16.49
|
-0.01
-0.06% |
$16.76
|
50,355
31.69% of 50 DAV
50 DAV is 158,900
|
$18.46
-10.67%
|
3/15/2011
|
$15.48
|
PP = $15.90
|
|
MB = $16.70
|
Most Recent Note - 6/3/2011 4:15:35 PM
G - Today's loss with very light volume has it slumping further below its 50 DMA line after that short-term average acted as resistance this week. The recent low ($16.10 on 5/25/11) defines near-term chart support to watch since its recently completed Public Offering.
>>> The latest Featured Stock Update with an annotated graph appeared on 5/12/2011. Click here.
View all notes |
Alert me of new notes |
CANSLIM.net Company Profile |
SEC |
Zacks Reports |
StockTalk |
News |
Chart |
Request a new note
C
A N
S L
I M
|
Symbol/Exchange
Company Name
Industry Group |
PRICE |
CHANGE
(%Change) |
Day High |
Volume
(% DAV)
(% 50 day avg vol) |
52 Wk Hi
% From Hi |
Featured
Date |
Price
Featured |
Pivot Featured |
|
Max Buy |
MWIV
-
NASDAQ
M W I Veterinary Supply
HEALTH SERVICES - Medical Instruments and; Supplies
|
$78.55
|
+0.69
0.89% |
$79.34
|
36,465
39.72% of 50 DAV
50 DAV is 91,800
|
$86.99
-9.70%
|
11/4/2010
|
$61.79
|
PP = $59.60
|
|
MB = $62.58
|
Most Recent Note - 6/6/2011 7:17:22 PM
G - Down today for a 3rd loss in the span of 4 sessions with above average volume, violating its 50 DMA line and recent chart lows triggering technical sell signals.
>>> The latest Featured Stock Update with an annotated graph appeared on 5/5/2011. Click here.
View all notes |
Alert me of new notes |
CANSLIM.net Company Profile |
SEC |
Zacks Reports |
StockTalk |
News |
Chart |
Request a new note
C
A N
S L
I M
|
OPNT
-
NASDAQ
Opnet Technologies
INTERNET - Internet Software and Services
|
$38.23
|
+0.03
0.08% |
$38.76
|
66,670
50.39% of 50 DAV
50 DAV is 132,300
|
$42.51
-10.07%
|
5/11/2011
|
$41.21
|
PP = $40.50
|
|
MB = $42.53
|
Most Recent Note - 6/6/2011 6:57:23 PM
G - Solid gain with above average volume today helped it rally back near its 50 DMA line. Subsequent deterioration under recent lows in the $35-36 area would raise greater concerns.
>>> The latest Featured Stock Update with an annotated graph appeared on 5/11/2011. Click here.
View all notes |
Alert me of new notes |
CANSLIM.net Company Profile |
SEC |
Zacks Reports |
StockTalk |
News |
Chart |
Request a new note
C
A N
S L
I M
|
OTEX
-
NASDAQ
Open Text Corp
INTERNET - Internet Software and Services
|
$62.80
|
-0.22
-0.35% |
$63.47
|
253,955
70.50% of 50 DAV
50 DAV is 360,200
|
$67.08
-6.38%
|
6/1/2011
|
$65.86
|
PP = $67.18
|
|
MB = $70.54
|
Most Recent Note - 6/6/2011 7:01:05 PM
Y - Down for a 3rd consecutive session with a small loss today on below average volume, slumping near its 50 DMA line. No resistance remains from overhead supply, however a breakout on volume is still needed to confirm a proper new technical buy signal.
>>> The latest Featured Stock Update with an annotated graph appeared on 6/2/2011. Click here.
View all notes |
Alert me of new notes |
CANSLIM.net Company Profile |
SEC |
Zacks Reports |
StockTalk |
News |
Chart |
Request a new note
C
A N
S L
I M
|
PCLN
-
NASDAQ
Priceline.Com Inc
INTERNET - Internet Software and Services
|
$506.12
|
+3.25
0.65% |
$511.28
|
683,384
63.59% of 50 DAV
50 DAV is 1,074,600
|
$561.88
-9.92%
|
1/3/2011
|
$399.55
|
PP = $428.20
|
|
MB = $449.61
|
Most Recent Note - 6/6/2011 7:02:30 PM
G - Volume totals have been cooling in recent weeks while lingering just below its 50 DMA line. Recent chart low ($487.70 on 5/25/11) defines an important near-term support level where further deterioration would raise even greater concerns.
>>> The latest Featured Stock Update with an annotated graph appeared on 5/19/2011. Click here.
View all notes |
Alert me of new notes |
CANSLIM.net Company Profile |
SEC |
Zacks Reports |
StockTalk |
News |
Chart |
Request a new note
C
A N
S L
I M
|
RAX
-
NYSE
Rackspace Hosting Inc
INTERNET - Internet Software and; Services
|
$41.76
|
+0.30
0.72% |
$42.38
|
1,361,866
72.16% of 50 DAV
50 DAV is 1,887,200
|
$46.50
-10.18%
|
6/3/2011
|
$43.36
|
PP = $46.59
|
|
MB = $48.92
|
Most Recent Note - 6/6/2011 6:32:45 PM
Y - Violated its 50 DMA line with a loss today on lighter volume. Only a prompt rebound above that short-term average could help its outlook, meanwhile deterioration below its recent low closes and its recent chart low ($38.84 on 5/12/11) would trigger more worrisome technical sell signals. Last week its color code was changed to yellow with new pivot point based on its 52-week high plus 10 cents.
>>> The latest Featured Stock Update with an annotated graph appeared on 5/13/2011. Click here.
View all notes |
Alert me of new notes |
CANSLIM.net Company Profile |
SEC |
Zacks Reports |
StockTalk |
News |
Chart |
Request a new note
C
A N
S L
I M
|
Symbol/Exchange
Company Name
Industry Group |
PRICE |
CHANGE
(%Change) |
Day High |
Volume
(% DAV)
(% 50 day avg vol) |
52 Wk Hi
% From Hi |
Featured
Date |
Price
Featured |
Pivot Featured |
|
Max Buy |
SWI
-
NYSE
Solarwinds Inc
COMPUTER SOFTWARE and SERVICES - Application Software
|
$24.35
|
+0.14
0.58% |
$24.53
|
894,101
156.89% of 50 DAV
50 DAV is 569,900
|
$24.95
-2.40%
|
6/7/2011
|
$24.22
|
PP = $25.05
|
|
MB = $26.30
|
Most Recent Note - 6/7/2011
Y - Perched -2.8% off its all-time high today, and no overhead supply remains to hinder its progress. Color code is changed to yellow after an orderly base with pivot point based upon its 52-week high plus 10 cents. To trigger a buy signal it needs a gain above its pivot point with sufficient volume and a follow-through day to confirm the broader market (M criteria) is favorable. Reported earnings +31% on +25% sales revenues for the quarter ended March 31, 2011 versus the year ago period. Prior quarterly comparisons showed sales and earnings near the investment system guidelines. It survived but failed to impress since it was dropped from the Featured Stocks list on 10/28/09.

>>> The latest Featured Stock Update with an annotated graph appeared on 10/20/2009. Click here.
View all notes |
Alert me of new notes |
CANSLIM.net Company Profile |
SEC |
Zacks Reports |
StockTalk |
News |
Chart |
Request a new note
C
A N
S L
I M
|
TIBX
-
NASDAQ
Tibco Software Inc
COMPUTER SOFTWARE and SERVICES - Business Software and Services
|
$26.14
|
-0.01
-0.02% |
$26.56
|
2,724,299
98.20% of 50 DAV
50 DAV is 2,774,300
|
$30.75
-15.01%
|
3/18/2011
|
$23.88
|
PP = $26.04
|
|
MB = $27.34
|
Most Recent Note - 6/6/2011 6:35:10 PM
G - Down further today on light volume, closing near the session low. Serious concerns were raised last week after it technically triggered sell signals with losses and slumped below its 50 DMA line. Overhead supply up through the $30 area may now act as resistance.
>>> The latest Featured Stock Update with an annotated graph appeared on 5/18/2011. Click here.
View all notes |
Alert me of new notes |
CANSLIM.net Company Profile |
SEC |
Zacks Reports |
StockTalk |
News |
Chart |
Request a new note
C
A N
S L
I M
|
ULTA
-
NASDAQ
Ulta Salon Cosm & Frag
SPECIALTY RETAIL - Specialty Retail, Other
|
$49.61
|
-0.09
-0.18% |
$50.50
|
1,401,976
265.68% of 50 DAV
50 DAV is 527,700
|
$57.17
-13.22%
|
1/6/2011
|
$36.12
|
PP = $37.34
|
|
MB = $39.21
|
Most Recent Note - 6/6/2011 6:39:54 PM
G - Its violation and close below its recent low ($50.43 on 5/23/11) raised more concerns. It slumped further below its 50 DMA line today with a second loss with above average volume in the span of 3 sessions.
>>> The latest Featured Stock Update with an annotated graph appeared on 5/26/2011. Click here.
View all notes |
Alert me of new notes |
CANSLIM.net Company Profile |
SEC |
Zacks Reports |
StockTalk |
News |
Chart |
Request a new note
C
A N
S L
I M
|
ZAGG
-
NASDAQ
Zagg Inc
SPECIALTY RETAIL - Specialty Retail, Other
|
$10.55
|
+0.08
0.76% |
$10.93
|
1,150,478
94.19% of 50 DAV
50 DAV is 1,221,400
|
$11.53
-8.50%
|
6/1/2011
|
$10.92
|
PP = $10.59
|
|
MB = $11.12
|
Most Recent Note - 6/6/2011 6:28:11 PM
Y - Loss today with below average volume led to a close just below its pivot point, raising concerns. Technically it broke out from a cup-with-handle type base last week. Prior high closes define important chart support to watch on pullbacks.
>>> The latest Featured Stock Update with an annotated graph appeared on 6/1/2011. Click here.
View all notes |
Alert me of new notes |
CANSLIM.net Company Profile |
SEC |
Zacks Reports |
StockTalk |
News |
Chart |
Request a new note
C
A N
S L
I M
|