You are not logged in.
This means you
CAN ONLY VIEW reports that were published prior to Tuesday, April 15, 2025.
You
MUST UPGRADE YOUR MEMBERSHIP if you want to see any current reports.
AFTER MARKET UPDATE - THURSDAY, JUNE 9TH, 2011
Previous After Market Report Next After Market Report >>>
|
|
|
|
DOW |
+75.42 |
12,124.36 |
+0.63% |
|
Volume |
907,750,540 |
-10% |
|
Volume |
1,660,722,230 |
-18% |
|
NASDAQ |
+9.49 |
2,684.87 |
+0.35% |
|
Advancers |
1,895 |
60% |
|
Advancers |
1,601 |
59% |
|
S&P 500 |
+9.44 |
1,289.00 |
+0.74% |
|
Decliners |
1,107 |
35% |
|
Decliners |
1,012 |
37% |
|
Russell 2000 |
+4.60 |
792.64 |
+0.58% |
|
52 Wk Highs |
31 |
|
|
52 Wk Highs |
26 |
|
|
S&P 600 |
+2.09 |
424.88 |
+0.49% |
|
52 Wk Lows |
70 |
|
|
52 Wk Lows |
119 |
|
|
 |
Lack of Volume Behind Small Gains Snapping Losing Streak
Kenneth J. Gruneisen - Passed the CAN SLIM® Master's Exam
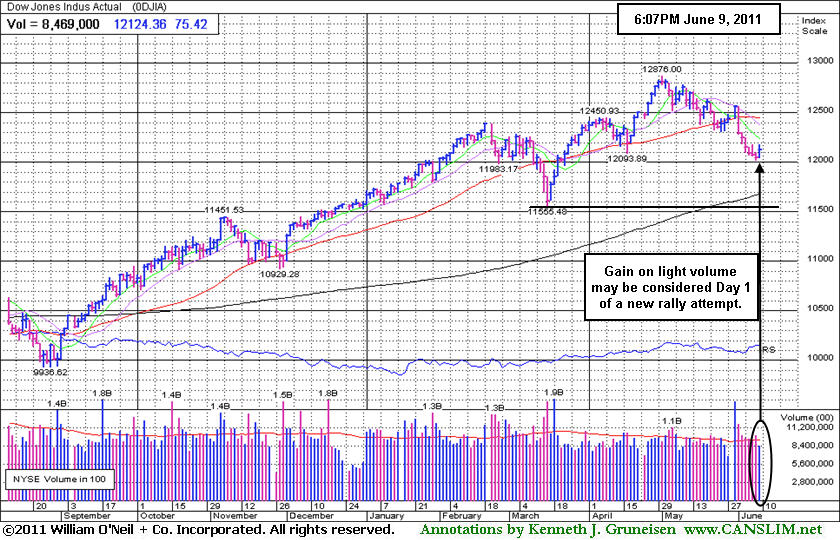
The Dow Jones Industrial Average and the S&P 500 Index closed higher for the first day this month as they snapped their 6-day losing streaks. Thursday's lighter volume totals on the NYSE and on the Nasdaq exchange were a dead give-away that institutional investors were not aggressively accumulating stocks after the patch of damaging distributional losses on higher volume totals. Advancing issues beat decliners by approximately 3-2 on the NYSE and on the Nasdaq exchange. New 52-week lows continued to outnumber new 52-week highs on the Nasdaq and on the NYSE. There were 8 high-ranked companies from the CANSLIM.net Leaders List made new 52-week highs and appeared on the CANSLIM.net BreakOuts Page, up from 3 on the prior session. Among the bright spots, there was a clearly bullish bias with unanimous gains from all 19 of the high-ranked leaders currently included on the Featured Stocks Page.
An unexpected drop in the U.S. trade deficit boosted investor sentiment and lifted the dollar as well. The trade report offset yet another gloomy report on jobs. Initial jobless claims unexpectedly increased last week, and remain stubbornly above the threshold that would suggest significant improvement.
Stocks bounced higher in light trading as the market demonstrated characteristics of an "oversold" condition. Mosaic Co (MOS +4.84%) and Deere and Company (DE +2.55%), fertilizer and agriculture machinery companies, rallied after the government reduced its corn crop estimate. Texas Instruments Inc (TXN +0.73%) rewarded investors with a small gain, even though the company lowered its sales forecast.
Recent weak action was noted as the market (M criteria) correction caused more worrisome technical damage, reminding investors to raise cash and reduce exposure until a new confirmed rally with follow-through day (FTD) occurs. The June 2011 issue of CANSLIM.net News will be released soon! When it is available all upgraded members will receive email notifications and be able to access it via links on the website including via the dynamic archive links on the Premium Membership Homepage.
PICTURED: The Dow Jones Industrial Average and other indices' Thursday gains may be considered Day 1 of a new rally attempt. Remember that a proper FTD requires three things - a solid gain of at least +1.4%, preferably greater, from at least one of the major averages, higher volume on the exchange than the prior session (coupled with the solid gain), and also an expansion in leadership (stocks making new 52-week highs). Historic examples have suggested that it is most ideal for the FTD to come between Day 4 and Day 7 of the new rally attempt. The market outlook would improve with a follow-through day, meanwhile the current path of least resistance could lead to a deeper correction and test of support at the indices' 200-day moving average (DMA) lines.
|
 Kenneth J. Gruneisen started out as a licensed stockbroker in August 1987, a couple of months prior to the historic stock market crash that took the Dow Jones Industrial Average down -22.6% in a single day. He has published daily fact-based fundamental and technical analysis on high-ranked stocks online for two decades. Through FACTBASEDINVESTING.COM, Kenneth provides educational articles, news, market commentary, and other information regarding proven investment systems that work in good times and bad.
Comments contained in the body of this report are technical opinions only and are not necessarily those of Gruneisen Growth Corp. The material herein has been obtained from sources believed to be reliable and accurate, however, its accuracy and completeness cannot be guaranteed. Our firm, employees, and customers may effect transactions, including transactions contrary to any recommendation herein, or have positions in the securities mentioned herein or options with respect thereto. Any recommendation contained in this report may not be suitable for all investors and it is not to be deemed an offer or solicitation on our part with respect to the purchase or sale of any securities. |
|
 |
Healthcare Group and Defensive Groups Led Gainers
Kenneth J. Gruneisen - Passed the CAN SLIM® Master's Exam
Defensive groups were rewarded with small gains on Thursday as the Healthcare Index ($HMO +2.65%) and Gold & Silver Index ($XAU +1.59%) were among the best gainers. Those groups historically have fared better than others when investors are pessimistic about the economy or seeking safe havens, but keep in mind that the investment system's M criteria argues that in a downward trending market 3 out of 4 stocks usually go down.
Energy-related shares rose and helped the Integrated Oil Index ($XOI +1.26%) and Oil Services Index ($OSX +2.03%) both post gains. A modest win for the Retail Index ($RLX +0.75%) and small gains from the Broker/Dealer Index ($XBD +1.12%) and Bank Index ($BKX +1.19%) helped add to the session's positive bias. The tech sector clearly lagged as there were minuscule gains from the Semiconductor Index ($SOX +0.17%), Internet Index ($IIX +0.18%), and Networking Index ($NWX +0.23%) while the Biotechnology Index ($BTK -0.16%) inched lower.
Charts courtesy www.stockcharts.com
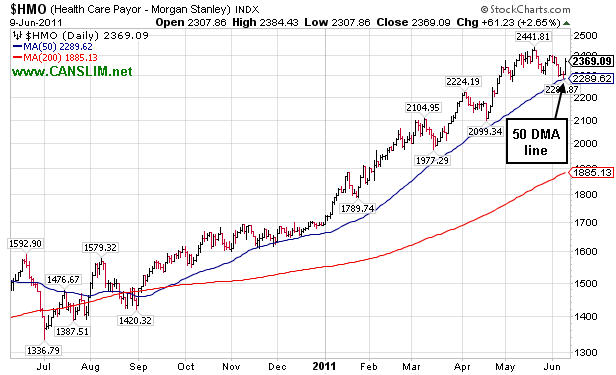
PICTURED: The Healthcare Index ($HMO +2.65%) was a standout gainer. It found support at its 50-day moving average line and continues to show bullish characteristics.
| Oil Services |
$OSX |
263.92 |
+5.25 |
+2.03% |
+7.67% |
| Healthcare |
$HMO |
2,369.09 |
+61.23 |
+2.65% |
+40.02% |
| Integrated Oil |
$XOI |
1,286.22 |
+16.05 |
+1.26% |
+6.02% |
| Semiconductor |
$SOX |
409.62 |
+0.68 |
+0.17% |
-0.53% |
| Networking |
$NWX |
293.30 |
+0.67 |
+0.23% |
+4.54% |
| Internet |
$IIX |
303.08 |
+0.55 |
+0.18% |
-1.51% |
| Broker/Dealer |
$XBD |
108.13 |
+1.20 |
+1.12% |
-11.02% |
| Retail |
$RLX |
505.56 |
+3.78 |
+0.75% |
-0.55% |
| Gold & Silver |
$XAU |
197.19 |
+3.08 |
+1.59% |
-12.97% |
| Bank |
$BKX |
46.92 |
+0.55 |
+1.19% |
-10.13% |
| Biotech |
$BTK |
1,442.69 |
-2.30 |
-0.16% |
+11.18% |
|
|
|
 |
Quiet Gains Following Technically Damaging Distribution
Kenneth J. Gruneisen - Passed the CAN SLIM® Master's Exam
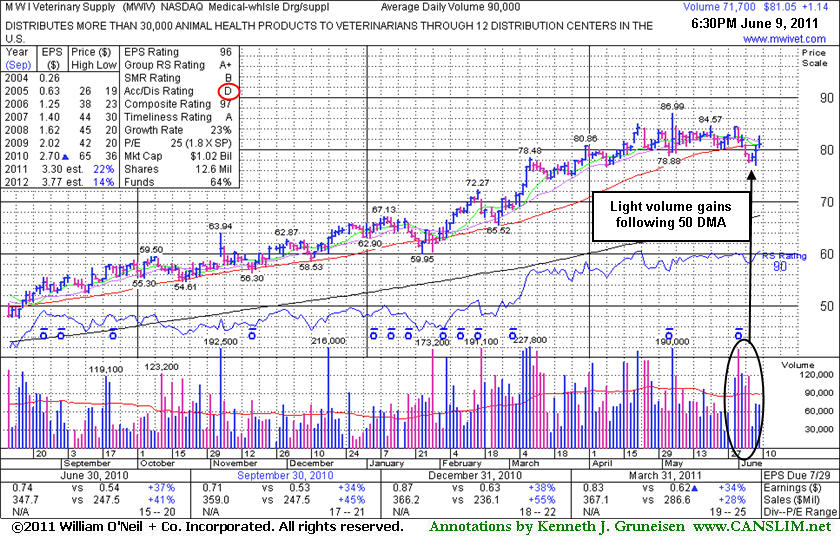
M W I Veterinary Supply (MWIV +$1.14 or +1.43% to $81.05) has posted 3 consecutive gains with below average volume and rallied to a close near its 50-day moving average (DMA) line. It recently suffered 3 losses in the span of 4 sessions with above average volume, violating its 50 DMA line and recent chart lows triggering technical sell signals. After its last appearance in this FSU section with an annotated graph on 5/05/11 under the headline, "Spike to New High on Latest Strong Earnings Release", it stalled and volume totals cooled for a few weeks while it consolidated in an orderly fashion above its 50 DMA line. Disciplined investors would watch for a new base to form and wait for market conditions to signal that odds are more favorable. Sales revenues acceleration (bigger percentage increases sequentially, +34%, +41%, +45% and +55% in the Mar, Jun, Sep, and Dec '10 quarterly comparisons versus the year earlier) was noted as a very reassuring sign. For the latest period ended March 31, 2011 its +28% sales revenues increase was still was very strong, but it broke the sequential streak of bigger sales increases. The acceleration suggests increasing demand for the company's products, which, along with the price recently hitting new highs, solidly satisfied the N criteria.
Its solid quarterly and annual earnings history satisfies the C and A criteria. Its small supply (S criteria) of only 12.5 million shares outstanding could contribute to greater volatility in the event of institutional buying or selling. The number of top-rated funds owning its shares rose from 255 in Mar '10 to 280 in Mar '11, a reassuring sign of support from the institutional (I criteria) crowd. Since it was first featured in yellow at $52.05 on 7/29/10 it traded as much as +67.1% higher in about 9 months. It has the look of a sound new base forming, and although a new pivot point is not being cited, subsequent volume-driven gains for a new high close (above the $84.30 close from 5/31/11) would be considered a bullish sign. Keep in mind that during market corrections, the M criteria argues against new buying efforts, since 3 out of 4 stocks typically go in the same direction of the broader market.
|
|
|
Color Codes Explained :
Y - Better candidates highlighted by our
staff of experts.
G - Previously featured
in past reports as yellow but may no longer be buyable under the
guidelines.
***Last / Change / Volume data in this table is the closing quote data***
Symbol/Exchange
Company Name
Industry Group |
PRICE |
CHANGE
(%Change) |
Day High |
Volume
(% DAV)
(% 50 day avg vol) |
52 Wk Hi
% From Hi |
Featured
Date |
Price
Featured |
Pivot Featured |
|
Max Buy |
CACC
-
NASDAQ
Credit Acceptance Corp
FINANCIAL SERVICES - Credit Services
|
$77.29
|
+0.98
1.28% |
$77.51
|
9,942
26.44% of 50 DAV
50 DAV is 37,600
|
$82.29
-6.08%
|
6/2/2011
|
$76.10
|
PP = $82.39
|
|
MB = $86.51
|
Most Recent Note - 6/6/2011 8:18:53 PM
Y - This high-ranked leader in the Finance - Consumer Loans industry is thinly traded (37,100 shares average daily volume) and has a small supply (S criteria) of shares outstanding. Strong earnings history satisfies the C and A criteria. It is consolidating near its 50 DMA line which defines important support along with recent lows near $75. A subsequent gain above its pivot point with heavy volume would trigger a technical buy signal, meanwhile it has formed a sound new base pattern of sufficient length and its color code was changed to yellow with a pivot point based on its 52-week high plus 10 cents. See the latest FSU analysis for more details and a new annotated weekly graph.
>>> The latest Featured Stock Update with an annotated graph appeared on 6/6/2011. Click here.
View all notes |
Alert me of new notes |
CANSLIM.net Company Profile |
SEC |
Zacks Reports |
StockTalk |
News |
Chart |
Request a new note
C
A N
S L
I M


|
CEVA
-
NASDAQ
Ceva Inc
ELECTRONICS - Semiconductor - Specialized
|
$31.00
|
+0.19
0.62% |
$31.62
|
128,202
56.98% of 50 DAV
50 DAV is 225,000
|
$35.60
-12.92%
|
5/25/2011
|
$32.98
|
PP = $32.05
|
|
MB = $33.65
|
Most Recent Note - 6/7/2011 2:30:53 PM
Y - Today's gain on light volume follows 4 consecutive losses with higher volume indicative of mild distributional pressure. As previously noted - "Its slump below its pivot point has raised concerns. Prior highs define support to watch above its 50 DMA line."
>>> The latest Featured Stock Update with an annotated graph appeared on 5/25/2011. Click here.
View all notes |
Alert me of new notes |
CANSLIM.net Company Profile |
SEC |
Zacks Reports |
StockTalk |
News |
Chart |
Request a new note
C
A N
S L
I M
|
CMG
-
NYSE
Chipotle Mexican Grill
LEISURE - Restaurants
|
$277.87
|
+0.76
0.27% |
$279.06
|
446,422
41.75% of 50 DAV
50 DAV is 1,069,200
|
$295.99
-6.12%
|
4/1/2011
|
$274.00
|
PP = $275.10
|
|
MB = $288.86
|
Most Recent Note - 6/6/2011 6:42:55 PM
G - Down again today with very quiet volume, closing near the session low while still perched just -5.2% off its all-time high. No resistance remains due to overhead supply. Formed a 5-week base with volume totals cooling in recent weeks while finding support near its 50 DMA line. Its sub par earnings increase of +23% in the latest quarter ended March 31st, 2011 versus the year ago period raised concern while marking its weakest quarterly earnings increase in more than 2 years.
>>> The latest Featured Stock Update with an annotated graph appeared on 5/17/2011. Click here.
View all notes |
Alert me of new notes |
CANSLIM.net Company Profile |
SEC |
Zacks Reports |
StockTalk |
News |
Chart |
Request a new note
C
A N
S L
I M
|
EZPW
-
NASDAQ
Ezcorp Inc Cl A
SPECIALTY RETAIL - Specialty Retail, Other
|
$32.23
|
+0.48
1.51% |
$32.62
|
301,222
86.51% of 50 DAV
50 DAV is 348,200
|
$33.31
-3.24%
|
2/18/2011
|
$27.94
|
PP = $30.04
|
|
MB = $31.54
|
Most Recent Note - 6/8/2011 12:37:26 PM
G - Rallying from a test of support at its 50 DMA line, building on a choppy new base. Recent lows and its 50 DMA line define important nearby chart support to watch where technical violations would raise more serious concerns.
>>> The latest Featured Stock Update with an annotated graph appeared on 5/10/2011. Click here.
View all notes |
Alert me of new notes |
CANSLIM.net Company Profile |
SEC |
Zacks Reports |
StockTalk |
News |
Chart |
Request a new note
C
A N
S L
I M
|
FCFS
-
NASDAQ
First Cash Financial Svs
SPECIALTY RETAIL - Specialty Retail, Other
|
$39.65
|
+0.24
0.61% |
$40.15
|
129,768
65.14% of 50 DAV
50 DAV is 199,200
|
$42.36
-6.40%
|
5/31/2011
|
$42.00
|
PP = $40.23
|
|
MB = $42.24
|
Most Recent Note - 6/6/2011 6:46:14 PM
G - Small gain today with near average volume while finding support near its 50 DMA line and prior lows. Its color code was changed to green after damaging losses on higher volume negated its latest breakout.
>>> The latest Featured Stock Update with an annotated graph appeared on 5/31/2011. Click here.
View all notes |
Alert me of new notes |
CANSLIM.net Company Profile |
SEC |
Zacks Reports |
StockTalk |
News |
Chart |
Request a new note
C
A N
S L
I M
|
Symbol/Exchange
Company Name
Industry Group |
PRICE |
CHANGE
(%Change) |
Day High |
Volume
(% DAV)
(% 50 day avg vol) |
52 Wk Hi
% From Hi |
Featured
Date |
Price
Featured |
Pivot Featured |
|
Max Buy |
FOSL
-
NASDAQ
Fossil Inc
CONSUMER DURABLES - Recreational Goods, Other
|
$105.76
|
+3.35
3.27% |
$106.75
|
1,043,929
142.96% of 50 DAV
50 DAV is 730,200
|
$107.54
-1.65%
|
2/1/2011
|
$73.30
|
PP = $74.44
|
|
MB = $78.16
|
 Most Recent Note - 6/9/2011 12:48:39 PM
G - Today's gain has it within close striking distance of its 52-week high. In the 5th week of an orderly consolidation in a tight trading range, forming a "late-stage" base. Prior highs near $96 define initial support to watch coinciding with its 50 DMA line. See the latest FSU analysis for more details and a new annotated graph.
>>> The latest Featured Stock Update with an annotated graph appeared on 6/7/2011. Click here.
View all notes |
Alert me of new notes |
CANSLIM.net Company Profile |
SEC |
Zacks Reports |
StockTalk |
News |
Chart |
Request a new note
C
A N
S L
I M
|
HS
-
NYSE
Healthspring Inc
HEALTH SERVICES - Health Care Plans
|
$42.28
|
+0.51
1.22% |
$42.66
|
488,740
56.19% of 50 DAV
50 DAV is 869,800
|
$45.11
-6.27%
|
3/22/2011
|
$38.29
|
PP = $38.85
|
|
MB = $40.79
|
Most Recent Note - 6/6/2011 7:11:14 PM
G - Volume totals have been below average and cooling in recent weeks. Today's loss has it testing its 50 DMA line. That important short-term average defines chart support to watch where a violation would trigger a technical sell signal.
>>> The latest Featured Stock Update with an annotated graph appeared on 5/20/2011. Click here.
View all notes |
Alert me of new notes |
CANSLIM.net Company Profile |
SEC |
Zacks Reports |
StockTalk |
News |
Chart |
Request a new note
C
A N
S L
I M
|
INFA
-
NASDAQ
Informatica Corp
COMPUTER SOFTWARE and SERVICES - Business Software and Services
|
$55.12
|
+0.40
0.73% |
$55.36
|
1,007,719
83.55% of 50 DAV
50 DAV is 1,206,100
|
$59.98
-8.10%
|
3/24/2011
|
$50.04
|
PP = $49.86
|
|
MB = $52.35
|
Most Recent Note - 6/8/2011 4:31:54 PM
G - Down today with above average volume, slumping near its 50 DMA line which defines near-term support to watch. It hit a new 52-week high on 6/01/11 and then there was a negative reversal for a loss on above average volume. This high-ranked Computer Software - Database firm did not form a sound new base pattern.
>>> The latest Featured Stock Update with an annotated graph appeared on 5/24/2011. Click here.
View all notes |
Alert me of new notes |
CANSLIM.net Company Profile |
SEC |
Zacks Reports |
StockTalk |
News |
Chart |
Request a new note
C
A N
S L
I M
|
MELI
-
NASDAQ
Mercadolibre Inc
INTERNET - Internet Software and; Services
|
$79.92
|
+1.59
2.03% |
$80.49
|
646,961
87.27% of 50 DAV
50 DAV is 741,300
|
$92.73
-13.81%
|
6/1/2011
|
$90.55
|
PP = $92.83
|
|
MB = $97.47
|
Most Recent Note - 6/8/2011 1:39:00 PM
G - Damaging losses for a 4th consecutive session have it slumping near prior highs after its previously noted 50 DMA line violation triggered a technical sell signal. Disciplined investors resisted the urge to get in "early", since it did not confirm a buy signal after featured in the 6/01/11 mid-day report. Regardless, losses should always be limited if any stock falls -7% from your purchase price to eliminate the chance of greater gains. Color code was changed to green based on its deterioration, meanwhile, a subsequent rebound above its short-term average is needed to improve its outlook.
>>> The latest Featured Stock Update with an annotated graph appeared on 6/3/2011. Click here.
View all notes |
Alert me of new notes |
CANSLIM.net Company Profile |
SEC |
Zacks Reports |
StockTalk |
News |
Chart |
Request a new note
C
A N
S L
I M
|
MG
-
NYSE
Mistras Group Inc
DIVERSIFIED SERVICES - Bulding and Faci;ity Management Services
|
$16.30
|
+0.02
0.12% |
$16.53
|
34,486
21.59% of 50 DAV
50 DAV is 159,700
|
$18.46
-11.70%
|
3/15/2011
|
$15.48
|
PP = $15.90
|
|
MB = $16.70
|
Most Recent Note - 6/8/2011 7:23:07 PM
G - Volume was higher but below average today, and as it marked its 6th consecutive loss the recent low ($16.10 on 5/25/11) was also breached intra-day. On 5/05/11 it completed a Public Offering. More recently it has been slumping below its 50 DMA line and that important short-term average acted as resistance.
>>> The latest Featured Stock Update with an annotated graph appeared on 5/12/2011. Click here.
View all notes |
Alert me of new notes |
CANSLIM.net Company Profile |
SEC |
Zacks Reports |
StockTalk |
News |
Chart |
Request a new note
C
A N
S L
I M
|
Symbol/Exchange
Company Name
Industry Group |
PRICE |
CHANGE
(%Change) |
Day High |
Volume
(% DAV)
(% 50 day avg vol) |
52 Wk Hi
% From Hi |
Featured
Date |
Price
Featured |
Pivot Featured |
|
Max Buy |
MWIV
-
NASDAQ
M W I Veterinary Supply
HEALTH SERVICES - Medical Instruments and; Supplies
|
$81.05
|
+1.14
1.43% |
$82.69
|
71,676
79.64% of 50 DAV
50 DAV is 90,000
|
$86.99
-6.83%
|
11/4/2010
|
$61.79
|
PP = $59.60
|
|
MB = $62.58
|
Most Recent Note - 6/9/2011 7:00:45 PM
G - Three consecutive gains on light volume have followed technically damaging losses. Today it finished near its 50 DMA line which may act as resistance. See the latest FSU analysis for more details and a new annotated graph.
>>> The latest Featured Stock Update with an annotated graph appeared on 6/9/2011. Click here.
View all notes |
Alert me of new notes |
CANSLIM.net Company Profile |
SEC |
Zacks Reports |
StockTalk |
News |
Chart |
Request a new note
C
A N
S L
I M
|
OPNT
-
NASDAQ
Opnet Technologies
INTERNET - Internet Software and Services
|
$38.35
|
+0.60
1.59% |
$38.53
|
56,861
43.08% of 50 DAV
50 DAV is 132,000
|
$42.51
-9.79%
|
5/11/2011
|
$41.21
|
PP = $40.50
|
|
MB = $42.53
|
Most Recent Note - 6/6/2011 6:57:23 PM
G - Solid gain with above average volume today helped it rally back near its 50 DMA line. Subsequent deterioration under recent lows in the $35-36 area would raise greater concerns.
>>> The latest Featured Stock Update with an annotated graph appeared on 5/11/2011. Click here.
View all notes |
Alert me of new notes |
CANSLIM.net Company Profile |
SEC |
Zacks Reports |
StockTalk |
News |
Chart |
Request a new note
C
A N
S L
I M
|
OTEX
-
NASDAQ
Open Text Corp
INTERNET - Internet Software and Services
|
$61.83
|
+0.25
0.41% |
$62.03
|
148,863
40.48% of 50 DAV
50 DAV is 367,700
|
$67.08
-7.83%
|
6/1/2011
|
$65.86
|
PP = $67.18
|
|
MB = $70.54
|
Most Recent Note - 6/8/2011
G - Disciplined investors avoided the temptation to get in "early" before a technical buy signal. A breakout did not occur, and it was down today for a 5th consecutive loss while volume increased to above average and it violated its 50 DMA line. Color code is changed to green based on damaging technical deterioration.
>>> The latest Featured Stock Update with an annotated graph appeared on 6/2/2011. Click here.
View all notes |
Alert me of new notes |
CANSLIM.net Company Profile |
SEC |
Zacks Reports |
StockTalk |
News |
Chart |
Request a new note
C
A N
S L
I M
|
PCLN
-
NASDAQ
Priceline.Com Inc
INTERNET - Internet Software and Services
|
$503.17
|
+2.49
0.50% |
$506.28
|
522,557
49.12% of 50 DAV
50 DAV is 1,063,900
|
$561.88
-10.45%
|
1/3/2011
|
$399.55
|
PP = $428.20
|
|
MB = $449.61
|
Most Recent Note - 6/6/2011 7:02:30 PM
G - Volume totals have been cooling in recent weeks while lingering just below its 50 DMA line. Recent chart low ($487.70 on 5/25/11) defines an important near-term support level where further deterioration would raise even greater concerns.
>>> The latest Featured Stock Update with an annotated graph appeared on 5/19/2011. Click here.
View all notes |
Alert me of new notes |
CANSLIM.net Company Profile |
SEC |
Zacks Reports |
StockTalk |
News |
Chart |
Request a new note
C
A N
S L
I M
|
RAX
-
NYSE
Rackspace Hosting Inc
INTERNET - Internet Software and; Services
|
$40.82
|
+0.48
1.19% |
$41.19
|
1,238,449
65.54% of 50 DAV
50 DAV is 1,889,600
|
$46.50
-12.21%
|
6/3/2011
|
$43.36
|
PP = $46.59
|
|
MB = $48.92
|
Most Recent Note - 6/8/2011 4:28:33 PM
G - Gapped down today and slumped to its lowest close since 3/29/11, raising concerns. Color code is changed to green based on recent deterioration, and a breach of its recent chart low ($38.84 on 5/12/11) would trigger a more worrisome technical sell signal.
>>> The latest Featured Stock Update with an annotated graph appeared on 5/13/2011. Click here.
View all notes |
Alert me of new notes |
CANSLIM.net Company Profile |
SEC |
Zacks Reports |
StockTalk |
News |
Chart |
Request a new note
C
A N
S L
I M
|
Symbol/Exchange
Company Name
Industry Group |
PRICE |
CHANGE
(%Change) |
Day High |
Volume
(% DAV)
(% 50 day avg vol) |
52 Wk Hi
% From Hi |
Featured
Date |
Price
Featured |
Pivot Featured |
|
Max Buy |
SWI
-
NYSE
Solarwinds Inc
COMPUTER SOFTWARE and SERVICES - Application Software
|
$24.48
|
+0.25
1.03% |
$24.74
|
548,456
93.15% of 50 DAV
50 DAV is 588,800
|
$24.95
-1.88%
|
6/7/2011
|
$24.22
|
PP = $25.05
|
|
MB = $26.30
|
Most Recent Note - 6/8/2011 7:15:13 PM
Y - Perched -2.9% off its all-time high today, and no overhead supply remains to hinder its progress. Color code was changed to yellow when featured in the 6/07/11 mid-day report with an annotated daily graph after an orderly base with pivot point based upon its 52-week high plus 10 cents. To trigger a buy signal it needs a gain above its pivot point with sufficient volume and a follow-through day to confirm the broader market (M criteria) is favorable. See the latest FSU analysis for more details and a new annotated weekly graph.
>>> The latest Featured Stock Update with an annotated graph appeared on 6/8/2011. Click here.
View all notes |
Alert me of new notes |
CANSLIM.net Company Profile |
SEC |
Zacks Reports |
StockTalk |
News |
Chart |
Request a new note
C
A N
S L
I M
|
TIBX
-
NASDAQ
Tibco Software Inc
COMPUTER SOFTWARE and SERVICES - Business Software and Services
|
$25.93
|
+0.10
0.39% |
$26.17
|
1,903,915
68.67% of 50 DAV
50 DAV is 2,772,600
|
$30.75
-15.67%
|
3/18/2011
|
$23.88
|
PP = $26.04
|
|
MB = $27.34
|
Most Recent Note - 6/6/2011 6:35:10 PM
G - Down further today on light volume, closing near the session low. Serious concerns were raised last week after it technically triggered sell signals with losses and slumped below its 50 DMA line. Overhead supply up through the $30 area may now act as resistance.
>>> The latest Featured Stock Update with an annotated graph appeared on 5/18/2011. Click here.
View all notes |
Alert me of new notes |
CANSLIM.net Company Profile |
SEC |
Zacks Reports |
StockTalk |
News |
Chart |
Request a new note
C
A N
S L
I M
|
ULTA
-
NASDAQ
Ulta Salon Cosm & Frag
SPECIALTY RETAIL - Specialty Retail, Other
|
$57.05
|
+1.15
2.06% |
$57.25
|
1,179,591
189.68% of 50 DAV
50 DAV is 621,900
|
$57.17
-0.21%
|
1/6/2011
|
$36.12
|
PP = $37.34
|
|
MB = $39.21
|
Most Recent Note - 6/9/2011 1:12:00 PM
G - Holding its ground today near its all-time high following a gap up gain on heavy volume on the prior session. After reporting earnings +61% on +21% sales revenues for the quarter ended April 30, 2011 versus the year ago period, its gap up repaired a brief 50 DMA violation and quickly challenged its 52-week high.
>>> The latest Featured Stock Update with an annotated graph appeared on 5/26/2011. Click here.
View all notes |
Alert me of new notes |
CANSLIM.net Company Profile |
SEC |
Zacks Reports |
StockTalk |
News |
Chart |
Request a new note
C
A N
S L
I M
|
ZAGG
-
NASDAQ
Zagg Inc
SPECIALTY RETAIL - Specialty Retail, Other
|
$10.86
|
+0.57
5.54% |
$10.97
|
856,014
74.87% of 50 DAV
50 DAV is 1,143,300
|
$11.53
-5.81%
|
6/1/2011
|
$10.92
|
PP = $10.59
|
|
MB = $11.12
|
Most Recent Note - 6/9/2011 6:57:20 PM
Y - Solid gain today with higher (but below average) volume helped it rebound back above its pivot point. Technically it broke out from a cup-with-handle type base last week. Prior high closes define important chart support to watch on pullbacks.
>>> The latest Featured Stock Update with an annotated graph appeared on 6/1/2011. Click here.
View all notes |
Alert me of new notes |
CANSLIM.net Company Profile |
SEC |
Zacks Reports |
StockTalk |
News |
Chart |
Request a new note
C
A N
S L
I M
|
|
|
|
THESE ARE NOT BUY RECOMMENDATIONS!
Comments contained in the body of this report are technical
opinions only. The material herein has been obtained
from sources believed to be reliable and accurate, however,
its accuracy and completeness cannot be guaranteed.
This site is not an investment advisor, hence it does
not endorse or recommend any securities or other investments.
Any recommendation contained in this report may not
be suitable for all investors and it is not to be deemed
an offer or solicitation on our part with respect to
the purchase or sale of any securities. All trademarks,
service marks and trade names appearing in this report
are the property of their respective owners, and are
likewise used for identification purposes only.
This report is a service available
only to active Paid Premium Members.
You may opt-out of receiving report notifications
at any time. Questions or comments may be submitted
by writing to Premium Membership Services 665 S.E. 10 Street, Suite 201 Deerfield Beach, FL 33441-5634 or by calling 1-800-965-8307
or 954-785-1121.
|
|
|

