You are not logged in.
This means you
CAN ONLY VIEW reports that were published prior to Monday, February 26, 2024.
You
MUST UPGRADE YOUR MEMBERSHIP if you want to see any current reports.
AFTER MARKET UPDATE - THURSDAY, JUNE 6TH, 2019
Previous After Market Report Next After Market Report >>>
|
|
|
|
DOW |
+181.09 |
25,720.66 |
+0.71% |
|
Volume |
790,456,600 |
-3% |
|
Volume |
2,056,462,429 |
-3% |
|
NASDAQ |
+40.07 |
7,615.55 |
+0.53% |
|
Advancers |
1,639 |
58% |
|
Advancers |
1,256 |
42% |
|
S&P 500 |
+17.34 |
2,843.49 |
+0.61% |
|
Decliners |
1,189 |
42% |
|
Decliners |
1,751 |
58% |
|
Russell 2000 |
-3.25 |
1,503.54 |
-0.22% |
|
52 Wk Highs |
194 |
|
|
52 Wk Highs |
81 |
|
|
S&P 600 |
-2.80 |
913.42 |
-0.31% |
|
52 Wk Lows |
102 |
|
|
52 Wk Lows |
142 |
|
|
 |
Major Indices Rose With Less Volume Conviction
Kenneth J. Gruneisen - Passed the CAN SLIM® Master's Exam
Stocks finished higher as positive trade updates and perceived “dovish” Federal Reserve comments boosted investor sentiment. The Dow added 181 points, while the S&P 500 climbed 0.6%. The Nasdaq Composite advanced 0.5%. The volume totals reported were lighter on the NYSE and on the Nasdaq exchange, revealing less conviction behind institutional buying demand. Advancers led decliners by a 4-3 margin on the NYSE but decliners led advancers by a 3-2 margin on the Nasdaq exchange. There were 87 high-ranked companies from the Leaders List hit new 52-week highs and were listed on the BreakOuts Page, versus the total of 67 on the prior session. New 52-week highs outnumbered new 52-week lows on the NYSE but new 52-week lows still outnumbered new 52-week highs on the Nasdaq exchange. The gains marked Day 3 of a new rally attempt. The major indices (M criteria) have been showing action indicative of a more worrisome "market correction". The Featured Stocks Page provides the most timely analysis on high-ranked leaders. Charts used courtesy of www.stockcharts.com
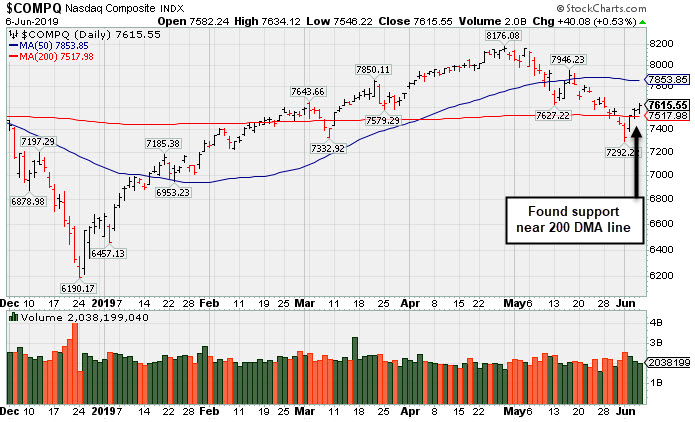
PICTURED: The Nasdaq Composite Index found support near its 200-day moving average (DMA) line but remains below its 50 DMA line.
The S&P 500 Index and Dow Jones Industrial Average have also rebounded above their respective long-term 200-day moving average (DMA) lines. Disciplined investors will be watching between Day 4 and Day 7 for a follow-through day of big gains (more than +1%) from at least one of the major indices backed with higher volume and an expansion in stocks reaching new 52-week highs - all of which are critical components for a new confirmed uptrend under the fact-based system.
Trade negotiations continued to garner attention as a report late Thursday afternoon indicated that the United States is considering a potential delay on the proposed tariffs on Mexico. A separate announcement from President Trump suggested the U.S. could implement tariffs on another $300 billion worth of Chinese imports. However, he also commented that he believes China wants to finalize a trade pact.
On the data front, initial jobless claims came in at 218,000 in the most recent week, matching the prior period’s upwardly revised figure. A separate release revealed the U.S. trade deficit narrowed to $50.8 billion in April from the prior month’s downwardly revised $51.9 billion shortfall. Treasuries finished mixed, with the yield on the 10-year note unchanged at 2.13%.
The Energy sector paced the gains as oil prices climbed out of bear market territory. WTI crude advanced 3.0% to $53.21/barrel, in conjunction with the optimistic trade comments. Technology shares also outperformed as Advanced Micro Devices (AMD +7.9%) rose following an analyst upgrade. In M&A news, Alphabet (GOOGL +0.30%) agreed to purchase Looker, a cloud computing company, for $2.6 billion in an attempt to increase its competitive edge against industry leader Amazon's (AMZN +0.91%) Web Services. |
 Kenneth J. Gruneisen started out as a licensed stockbroker in August 1987, a couple of months prior to the historic stock market crash that took the Dow Jones Industrial Average down -22.6% in a single day. He has published daily fact-based fundamental and technical analysis on high-ranked stocks online for two decades. Through FACTBASEDINVESTING.COM, Kenneth provides educational articles, news, market commentary, and other information regarding proven investment systems that work in good times and bad.
Comments contained in the body of this report are technical opinions only and are not necessarily those of Gruneisen Growth Corp. The material herein has been obtained from sources believed to be reliable and accurate, however, its accuracy and completeness cannot be guaranteed. Our firm, employees, and customers may effect transactions, including transactions contrary to any recommendation herein, or have positions in the securities mentioned herein or options with respect thereto. Any recommendation contained in this report may not be suitable for all investors and it is not to be deemed an offer or solicitation on our part with respect to the purchase or sale of any securities. |
|
 |
Retail, Broker/Dealer, Semiconductor, and Networking Indexes Rose
Kenneth J. Gruneisen - Passed the CAN SLIM® Master's Exam
The Retail Index ($RLX +0.49%), Broker/Dealer Index ($XBD +0.96%) and the Bank Index ($BKX +0.19%) posted unanimous gains. The tech sector was mixed as the Semiconductor Index ($SOX +1.34%) and the Networking Index ($NWX +1.97%) posted solid gains but the Biotech Index ($BTK -1.12%) finished with a loss. The Gold & Silver Index ($XAU +0.96%) posted a gain and the Integrated Oil Index ($XOI +1.66%) rose, but the Oil Services Index ($OSX -0.12%) ended the session slightly in the red. Charts courtesy of www.stockcharts.com
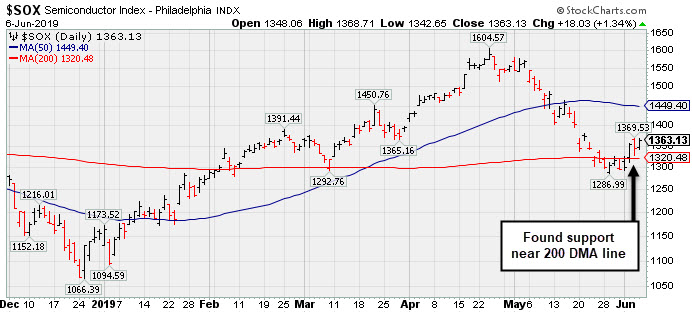 PICTURED: The Semiconductor Index ($SOX +1.34%) recently found support near its 200-day moving average (DMA) line.
| Oil Services |
$OSX |
74.72 |
-0.08 |
-0.11% |
-7.30% |
| Integrated Oil |
$XOI |
1,200.28 |
+19.62 |
+1.66% |
+3.55% |
| Semiconductor |
$SOX |
1,363.13 |
+18.03 |
+1.34% |
+18.00% |
| Networking |
$NWX |
569.64 |
+11.02 |
+1.97% |
+16.57% |
| Broker/Dealer |
$XBD |
263.82 |
+2.51 |
+0.96% |
+11.16% |
| Retail |
$RLX |
2,226.77 |
+10.92 |
+0.49% |
+14.11% |
| Gold & Silver |
$XAU |
74.41 |
+0.71 |
+0.96% |
+5.31% |
| Bank |
$BKX |
95.88 |
+0.18 |
+0.19% |
+11.76% |
| Biotech |
$BTK |
4,460.42 |
-50.65 |
-1.12% |
+5.68% |
|
|
|
 |
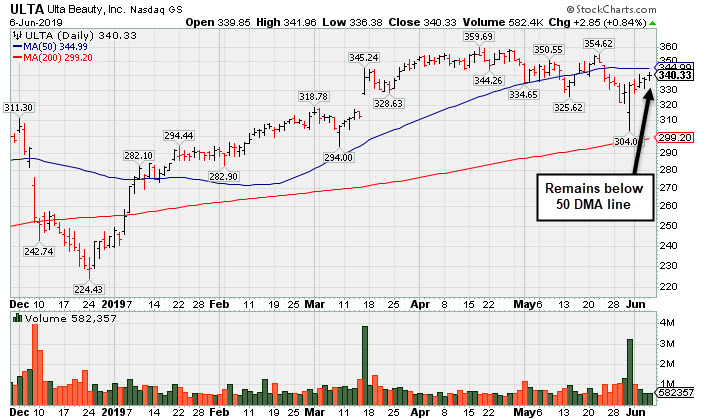
Sputtering Below 50-Day Moving Average Following Sub Par Earnings
Kenneth J. Gruneisen - Passed the CAN SLIM® Master's Exam
Ulta Beauty Inc (ULTA +$2.85 or +0.84% to $340.33) posted a 3rd consecutive gain today with below average volume. It still needs gains above its 50-day moving average (DMA) line ($345) for its outlook to improve and faces resistance due to overhead supply up to the $359 level.
It rebounded from a deep early loss on 5/31/19 after gapping down. It reported earnings +17% on +13% sales revenues for the Apr '19 quarter, below the +25% minimum earnings guideline (C criteria), raising fundamental concerns. Earnings increases were above the +25% minimum guideline (C criteria) in the prior 4 quarterly comparisons. Its solid annual earnings (A criteria) history is very reassuring.
ULTA was last shown in this FSU section on 4/26/19 with an annotated graph under the headline, "Volume Totals Cooling in Recent Weeks While Hovering Near High". It was highlighted in yellow in the 3/15/19 mid-day report with new pivot point based on its 11/19/18 high plus 10 cents (read here). A big "breakaway gap" on 3/15/19 backed by heavy volume triggered a technical buy signal.
It still has a small supply (S criteria) of only 58.5 million shares outstanding. The number of top-rated funds with an ownership interest has grown from 566 funds in Jun '14 to 1,628 funds as of Mar '19, which is a very encouraging sign of increasing institutional interest (the I criteria). Its current Up/Down Volume Ratio of 1.1 is an unbiased indication its shares have been under accumulation over the past 50 days.
|
|
|
Color Codes Explained :
Y - Better candidates highlighted by our
staff of experts.
G - Previously featured
in past reports as yellow but may no longer be buyable under the
guidelines.
***Last / Change / Volume data in this table is the closing quote data***
Symbol/Exchange
Company Name
Industry Group |
PRICE |
CHANGE
(%Change) |
Day High |
Volume
(% DAV)
(% 50 day avg vol) |
52 Wk Hi
% From Hi |
Featured
Date |
Price
Featured |
Pivot Featured |
|
Max Buy |
 SPSC
-
NASDAQ
SPSC
-
NASDAQ
S P S Commerce Inc
COMPUTER SOFTWARE and SERVICES - Application Software
|
$105.65
|
-0.21
-0.20% |
$106.02
|
199,428
126.22% of 50 DAV
50 DAV is 158,000
|
$115.00
-8.13%
|
3/26/2019
|
$107.12
|
PP = $113.41
|
|
MB = $119.08
|
Most Recent Note - 6/4/2019 6:19:36 PM
G - Rebounded above its 50 DMA line ($104.02) with today's 2nd consecutive volume-driven gain helping its technical stance. Still faces some resistance due to overhead supply up to the $115 level. Recent lows in the $98-99 area define important near-term support to watch. Fundamentals remain strong.
>>> FEATURED STOCK ARTICLE : Sputtering Near 50-Day Average Line Building Base-On-Base - 5/1/2019 |
View all notes |
Set NEW NOTE alert |
Company Profile |
SEC
News |
Chart |
Request a new note
C
A
S
I |
EPAM
-
NYSE
Epam Systems Inc
COMPUTER SOFTWARE and SERVICES - Information Technology Service
|
$172.82
|
+2.66
1.56% |
$173.27
|
290,949
59.14% of 50 DAV
50 DAV is 492,000
|
$180.55
-4.28%
|
5/9/2019
|
$169.25
|
PP = $180.55
|
|
MB = $189.58
|
Most Recent Note - 6/3/2019 9:04:22 PM
G - Met resistance near its 50 DMA line ($171) and slumped with losses on heavier than average volume for the past week. A rebound above that important short-term average is needed for its outlook to improve. Reported earnings +34% on +23% sales revenues for the Mar '19 quarter, continuing its strong earnings track record.
>>> FEATURED STOCK ARTICLE : Found Support and Closed in Upper Third of Day's Range - 5/9/2019 |
View all notes |
Set NEW NOTE alert |
Company Profile |
SEC
News |
Chart |
Request a new note
C
A
S
I |
ENV
-
NYSE
Envestnet Inc
FINANCIAL SERVICES - Diversified Investments
|
$69.17
|
+0.24
0.35% |
$69.51
|
133,524
47.18% of 50 DAV
50 DAV is 283,000
|
$72.67
-4.82%
|
3/15/2019
|
$66.05
|
PP = $64.90
|
|
MB = $68.15
|
Most Recent Note - 6/4/2019 6:07:36 PM
G - Rebounded above its 50 DMA line ($68.27) today helping its technical stance. Weak action came after recently reporting earnings +5% on +1% sales revenues for the Mar '19 quarter, below the +25% minimum earnings guideline (C criteria). The prior high ($64.80 on 9/14/18) defines important near-term support to watch. See the latest FSU analysis for more details and a new annotated graph.
>>> FEATURED STOCK ARTICLE : Rebound Above 50-Day Moving Average Improved Technical Stance - 6/4/2019 |
View all notes |
Set NEW NOTE alert |
Company Profile |
SEC
News |
Chart |
Request a new note
C
A
S
I |
LHCG
-
NASDAQ
L H C Group Inc
HEALTH SERVICES - Home Health Care
|
$114.97
|
-0.34
-0.29% |
$115.90
|
199,007
79.60% of 50 DAV
50 DAV is 250,000
|
$122.20
-5.92%
|
4/29/2019
|
$110.94
|
PP = $115.64
|
|
MB = $121.42
|
Most Recent Note - 6/4/2019 6:22:49 PM
Y - Rebounded above its pivot point with today's 4th consecutive gain backed by lighter than average volume. Its 50 DMA line ($111) defines near-term support. Fundamentals remain strong.
>>> FEATURED STOCK ARTICLE : Long-Term Care Firm Hovering Near All-Time High - 5/14/2019 |
View all notes |
Set NEW NOTE alert |
Company Profile |
SEC
News |
Chart |
Request a new note
C
A
S
I |
ENSG
-
NASDAQ
Ensign Group Inc
HEALTH SERVICES - Long-Term Care Facilities
|
$53.93
|
+0.33
0.62% |
$54.68
|
224,808
74.94% of 50 DAV
50 DAV is 300,000
|
$58.14
-7.24%
|
4/30/2019
|
$51.46
|
PP = $53.30
|
|
MB = $55.97
|
Most Recent Note - 6/3/2019 9:01:17 PM
Y - Showing resilience in recent weeks after it reported earnings +22% on +12% sales revenues for the Mar '19 quarter, below the +25% minimum earnings guideline (C criteria), raising fundamental concerns. Its 50 DMA line ($52.05) defines near-term support to watch. See the latest FSU analysis for more details and a new annotated graph.
>>> FEATURED STOCK ARTICLE : Resilient After Latest Quarterly Report Missed Minimum Guideline - 6/3/2019 |
View all notes |
Set NEW NOTE alert |
Company Profile |
SEC
News |
Chart |
Request a new note
C
A
S
I |
Symbol/Exchange
Company Name
Industry Group |
PRICE |
CHANGE
(%Change) |
Day High |
Volume
(% DAV)
(% 50 day avg vol) |
52 Wk Hi
% From Hi |
Featured
Date |
Price
Featured |
Pivot Featured |
|
Max Buy |
CHDN
-
NASDAQ
Churchill Downs Inc
LEISURE - Gaming Activities
|
$110.26
|
+1.19
1.09% |
$110.47
|
325,308
102.62% of 50 DAV
50 DAV is 317,000
|
$109.98
0.25%
|
6/5/2019
|
$108.87
|
PP = $104.96
|
|
MB = $110.21
|
Most Recent Note - 6/5/2019 12:12:49 PM
Y - Color code is changed to yellow with new pivot point cited based on its 5/16/18 high plus 10 cents. Triggering a technical buy signal with today's 5th consecutive gain backed by above average volume. Share price was impacted by a 3:1 split when last noted on 1/28/19. Its Relative Strength Rating is 87, above the 80+ minimum guideline for buy candidates. Fundamentals have remained strong since dropped from the Featured Stocks list on 8/20/18.
>>> FEATURED STOCK ARTICLE : Consolidating Near 50-Day Moving Average - 6/29/2018 |
View all notes |
Set NEW NOTE alert |
Company Profile |
SEC
News |
Chart |
Request a new note
C
A
S
I |
LULU
-
NASDAQ
Lululemon Athletica
MANUFACTURING - Textile Manufacturing
|
$170.38
|
-3.14
-1.81% |
$173.54
|
1,626,540
72.23% of 50 DAV
50 DAV is 2,252,000
|
$179.50
-5.08%
|
3/28/2019
|
$169.20
|
PP = $164.89
|
|
MB = $173.13
|
 Most Recent Note - 6/6/2019 4:58:41 PM
G - Sputtering near its 50 DMA line ($171) after it found support last week near prior highs. Due to report Apr '19 quarterly earnings news after the close on Wednesday, June 12th. Volume and volatility often increase near earnings news.
>>> FEATURED STOCK ARTICLE : Volume Light While Hovering Near High - 5/10/2019 |
View all notes |
Set NEW NOTE alert |
Company Profile |
SEC
News |
Chart |
Request a new note
C
A
S
I |
ULTA
-
NASDAQ
Ulta Beauty Inc
SPECIALTY RETAIL - Specialty Retail, Other
|
$340.33
|
+2.85
0.84% |
$341.96
|
582,223
80.31% of 50 DAV
50 DAV is 725,000
|
$359.69
-5.38%
|
3/15/2019
|
$341.27
|
PP = $322.59
|
|
MB = $338.72
|
Most Recent Note - 6/6/2019 4:56:13 PM
G - Posted a 3rd consecutive gain today with light volume. Still needs gains above its 50 DMA line ($345) for its outlook to improve. Rebounded from a deep early loss on 5/31/19 after gapping down. Reported earnings +17% on +13% sales revenues for the Apr '19 quarter, below the +25% minimum earnings guideline (C criteria), raising fundamental concerns. Faces resistance due to overhead supply up to the $359 level. See the latest FSU analysis for more details and a new annotated graph.
>>> FEATURED STOCK ARTICLE : Sputtering Below 50-Day Moving Average Following Sub Par Earnings - 6/6/2019 |
View all notes |
Set NEW NOTE alert |
Company Profile |
SEC
News |
Chart |
Request a new note
C
A
S
I |
ESNT
-
NYSE
Essent Group Ltd
Finance-MrtgandRel Svc
|
$48.96
|
+0.77
1.60% |
$49.21
|
887,113
155.63% of 50 DAV
50 DAV is 570,000
|
$48.88
0.16%
|
3/18/2019
|
$45.84
|
PP = $45.06
|
|
MB = $47.31
|
Most Recent Note - 6/5/2019 5:43:17 PM
Y - Found support above its 50 DMA line ($46.44) during its consolidation in recent months. Faces very little resistance due to overhead supply up to the $50 level while perched very near its 52-week high. Recently reported earnings +15% on +20% sales revenues for the Mar '19 quarter, below the +25% minimum earnings guideline (C criteria), raising fundamental concerns. See the latest FSU analysis for more details and a new annotated graph.
>>> FEATURED STOCK ARTICLE : Still Hovering Not Far From 52-Week High - 6/5/2019 |
View all notes |
Set NEW NOTE alert |
Company Profile |
SEC
News |
Chart |
Request a new note
C
A
S
I |
NOW
-
NYSE
Servicenow Inc
Computer Sftwr-Enterprse
|
$268.49
|
+5.24
1.99% |
$269.68
|
938,429
52.96% of 50 DAV
50 DAV is 1,772,000
|
$281.74
-4.70%
|
4/22/2019
|
$242.64
|
PP = $251.75
|
|
MB = $264.34
|
Most Recent Note - 6/6/2019 4:57:26 PM
G - Rebounded further above its 50 DMA line ($257) with lighter volume behind today's 3rd consecutive gain. Found support near the prior high ($251.65 on 3/21/19). Recently reported earnings +20% on +34% sales revenues for the Mar '19 quarter, below the +25% minimum earnings guideline (C criteria), raising concerns, fundamentally.
>>> FEATURED STOCK ARTICLE : Leader Consolidating Above 50-Day Moving Average Line - 5/29/2019 |
View all notes |
Set NEW NOTE alert |
Company Profile |
SEC
News |
Chart |
Request a new note
C
A
S
I |
Symbol/Exchange
Company Name
Industry Group |
PRICE |
CHANGE
(%Change) |
Day High |
Volume
(% DAV)
(% 50 day avg vol) |
52 Wk Hi
% From Hi |
Featured
Date |
Price
Featured |
Pivot Featured |
|
Max Buy |
QLYS
-
NASDAQ
Qualys Inc
Computer Sftwr-Security
|
$84.94
|
-0.86
-1.00% |
$85.83
|
215,150
68.74% of 50 DAV
50 DAV is 313,000
|
$98.30
-13.59%
|
5/23/2019
|
$90.43
|
PP = $98.40
|
|
MB = $103.32
|
Most Recent Note - 6/4/2019 6:13:29 PM
G - Rebounded near its 50 today after finding prompt support near its 200 DMA line. Its Relative Strength Rating is 77, below the 80+ minimum guideline for buy candidates. Met stubborn resistance in the $97-98 area. Reported earnings +36% on +16% sales revenues for the Mar '19 quarter, continuing its strong earnings history.
>>> FEATURED STOCK ARTICLE : Rallying to Challenge Previously Stubborn Resistance - 5/2/2019 |
View all notes |
Set NEW NOTE alert |
Company Profile |
SEC
News |
Chart |
Request a new note
C
A
S
I |
VEEV
-
NYSE
Veeva Systems Inc Cl A
Computer Sftwr-Medical
|
$159.00
|
+0.91
0.58% |
$161.78
|
1,976,764
158.78% of 50 DAV
50 DAV is 1,245,000
|
$159.80
-0.50%
|
5/30/2019
|
$154.32
|
PP = $145.80
|
|
MB = $153.09
|
Most Recent Note - 6/6/2019 12:53:19 PM
G - Color code is changed to green while making more progress above its "max buy" level since rallying from an advanced "3 weeks tight" base. Reported earnings +52% on +25% sales revenues for the Apr '19 quarter, marking its 5th strong quarter with earnings above the +25% minimum guideline (C criteria). Disciplined investors will note that no new buying efforts are to be made during market corrections (M criteria) under the fact-based investment system's rules. Watch for a confirmed rally with a follow-through day first.
>>> FEATURED STOCK ARTICLE : Big Volume-Driven Gain for New High Following Earnings News - 5/30/2019 |
View all notes |
Set NEW NOTE alert |
Company Profile |
SEC
News |
Chart |
Request a new note
C
A
S
I |
PAYC
-
NYSE
Paycom Software Inc
COMPUTER SOFTWARE and SERVICES - Application Software
|
$219.21
|
+2.44
1.13% |
$220.92
|
616,798
84.73% of 50 DAV
50 DAV is 728,000
|
$216.77
1.13%
|
2/6/2019
|
$171.66
|
PP = $164.18
|
|
MB = $172.39
|
Most Recent Note - 6/4/2019 6:11:57 PM
G - Rebounded near its all-time high with today's big gain after testing its 50 DMA line ($197.77) which defines important near-term support to watch. Reported earnings +25% on +30% sales revenues for the Mar '19 quarter.
>>> FEATURED STOCK ARTICLE : Posted Volume-Driven Gain While Hovering Near All-Time High - 5/31/2019 |
View all notes |
Set NEW NOTE alert |
Company Profile |
SEC
News |
Chart |
Request a new note
C
A
S
I |
PYPL
-
NASDAQ
Paypal Holdings Inc
Finance-CrdtCard/PmtPr
|
$111.78
|
+1.01
0.91% |
$112.04
|
4,687,458
76.48% of 50 DAV
50 DAV is 6,129,000
|
$114.66
-2.51%
|
1/24/2019
|
$92.56
|
PP = $93.80
|
|
MB = $98.49
|
Most Recent Note - 6/3/2019 9:20:38 PM
G - Violated its 50 DMA line ($108.38) and prior low ($106.52) with today's big volume-driven loss triggering technical sell signals. Recently reported earnings +37% on +12% sales revenues for the Mar '19 quarter, continuing its strong earnings track record.
>>> FEATURED STOCK ARTICLE : Hovering Near All Time High Extended From Any Sound Base - 5/15/2019 |
View all notes |
Set NEW NOTE alert |
Company Profile |
SEC
News |
Chart |
Request a new note
C
A
S
I |
PLNT
-
NYSE
Planet Fitness Inc Cl A
Leisure-Services
|
$78.91
|
+1.07
1.37% |
$79.00
|
1,509,506
107.74% of 50 DAV
50 DAV is 1,401,000
|
$81.76
-3.49%
|
11/7/2018
|
$57.10
|
PP = $55.45
|
|
MB = $58.22
|
Most Recent Note - 6/4/2019 6:23:50 PM
G - Extended from any sound base, consolidating above its 50 DMA line ($73.96) and prior low which define near-term support levels to watch. Violations would raise concerns and trigger technical sell signals. Fundamentals remain strong.
>>> FEATURED STOCK ARTICLE : Pulling Back From High After Impressive Rally - 5/23/2019 |
View all notes |
Set NEW NOTE alert |
Company Profile |
SEC
News |
Chart |
Request a new note
C
A
S
I |
Symbol/Exchange
Company Name
Industry Group |
PRICE |
CHANGE
(%Change) |
Day High |
Volume
(% DAV)
(% 50 day avg vol) |
52 Wk Hi
% From Hi |
Featured
Date |
Price
Featured |
Pivot Featured |
|
Max Buy |
BLD
-
NYSE
Topbuild Corp
Bldg-Constr Prds/Misc
|
$80.05
|
-1.39
-1.71% |
$81.63
|
220,356
70.18% of 50 DAV
50 DAV is 314,000
|
$87.21
-8.21%
|
5/17/2019
|
$82.19
|
PP = $87.31
|
|
MB = $91.68
|
Most Recent Note - 6/4/2019 6:21:18 PM
Y - Posted a 4th consecutive gain today with ever-increasing volume. Subsequent gains above the pivot point backed by at least +40% above average volume may trigger a technical buy signal. Fundamentals remain strong.
>>> FEATURED STOCK ARTICLE : Encountered Distributional Pressure Near Prior High - 5/20/2019 |
View all notes |
Set NEW NOTE alert |
Company Profile |
SEC
News |
Chart |
Request a new note
C
A
S
I |
TEAM
-
NASDAQ
Atlassian Corp Plc Cl A
Comp Sftwr-Spec Enterprs
|
$127.71
|
+1.28
1.01% |
$128.93
|
786,360
42.97% of 50 DAV
50 DAV is 1,830,000
|
$132.87
-3.88%
|
5/24/2019
|
$129.52
|
PP = $132.09
|
|
MB = $138.69
|
Most Recent Note - 6/4/2019 6:14:26 PM
Y - Posted a gain today with lighter volume after testing the prior high ($117) which defines important neat-term support to watch. More damaging losses would raise greater concerns and trigger a technical sell signal. Reported earnings +133% on +38% sales revenues for the Mar '19 quarter, continuing its strong earnings track record.
>>> FEATURED STOCK ARTICLE : Perched Near All-Time High After "3-Weeks Tight" - 5/24/2019 |
View all notes |
Set NEW NOTE alert |
Company Profile |
SEC
News |
Chart |
Request a new note
C
A
S
I |
GLOB
-
NYSE
Globant SA
Computer-Tech Services
|
$91.49
|
+0.73
0.80% |
$91.61
|
155,494
41.58% of 50 DAV
50 DAV is 374,000
|
$93.50
-2.15%
|
2/15/2019
|
$69.35
|
PP = $70.00
|
|
MB = $73.50
|
Most Recent Note - 6/3/2019 9:12:51 PM
G - Abruptly retreated from its all-time high with a big loss today on higher volume. Very extended from any sound base. Its 50 DMA line ($80.81) defines important support above the prior high ($74). Violations would raise concerns and trigger technical sell signals. Reported earnings +32% on +22% sales revenues for the quarter ended March 31st, 2019 versus the year ago period, continuing its strong earning track record.
>>> FEATURED STOCK ARTICLE : Earnings News Due While Perched Near All-Time High - 5/7/2019 |
View all notes |
Set NEW NOTE alert |
Company Profile |
SEC
News |
Chart |
Request a new note
C
A
S
I |
|
|
|
THESE ARE NOT BUY RECOMMENDATIONS!
Comments contained in the body of this report are technical
opinions only. The material herein has been obtained
from sources believed to be reliable and accurate, however,
its accuracy and completeness cannot be guaranteed.
This site is not an investment advisor, hence it does
not endorse or recommend any securities or other investments.
Any recommendation contained in this report may not
be suitable for all investors and it is not to be deemed
an offer or solicitation on our part with respect to
the purchase or sale of any securities. All trademarks,
service marks and trade names appearing in this report
are the property of their respective owners, and are
likewise used for identification purposes only.
This report is a service available
only to active Paid Premium Members.
You may opt-out of receiving report notifications
at any time. Questions or comments may be submitted
by writing to Premium Membership Services 665 S.E. 10 Street, Suite 201 Deerfield Beach, FL 33441-5634 or by calling 1-800-965-8307
or 954-785-1121.
|
|
|