You are not logged in.
This means you
CAN ONLY VIEW reports that were published prior to Monday, April 14, 2025.
You
MUST UPGRADE YOUR MEMBERSHIP if you want to see any current reports.
AFTER MARKET UPDATE - TUESDAY, MAY 24TH, 2011
Previous After Market Report Next After Market Report >>>
|
|
|
|
DOW |
-25.05 |
12,356.21 |
-0.20% |
|
Volume |
868,464,650 |
-11% |
|
Volume |
1,824,579,210 |
+4% |
|
NASDAQ |
-12.74 |
2,746.16 |
-0.46% |
|
Advancers |
1,379 |
44% |
|
Advancers |
1,029 |
38% |
|
S&P 500 |
-1.09 |
1,316.28 |
-0.08% |
|
Decliners |
1,630 |
52% |
|
Decliners |
1,569 |
58% |
|
Russell 2000 |
-3.71 |
810.33 |
-0.46% |
|
52 Wk Highs |
75 |
|
|
52 Wk Highs |
48 |
|
|
S&P 600 |
-2.19 |
433.59 |
-0.50% |
|
52 Wk Lows |
32 |
|
|
52 Wk Lows |
81 |
|
|
 |
Major Averages Negatively Reversed After Early Gains
Kenneth J. Gruneisen - Passed the CAN SLIM® Master's Exam
Lingering European debt concerns weighed on investor confidence on Tuesday as the major averages started the session with a positive bias, then negatively reversed for losses and closed near their intra-day lows. Declining issues beat advancers by 7-6 on the NYSE and by 3-2 on the Nasdaq exchange. Volume totals were reported mixed again, slightly higher than the prior session total on the Nasdaq exchange and slightly lower on the NYSE. New 52-week highs outnumbered new 52-week lows on the NYSE, but on the Nasdaq exchange new lows again outnumbered new highs. Leadership remained thin as there were only 8 high-ranked companies from the CANSLIM.net Leaders List that made new 52-week highs and appeared on the CANSLIM.net BreakOuts Page, up from the total of 7 on the prior session. On the Featured Stocks Page there were only 2 gainers out of the 14 high-ranked leaders currently included.
It was a quiet session on Wall Street with little conviction and lackluster results. Financial stocks reversed early gains after a regional Federal Reserve president recommended that banks be restricted to loans and deposits, to avert another meltdown of the financial system.
The best gain were in energy and mining stocks as crude closed above $99 per barrel. Gains from Chevron Corp (CVX +0.89%) and Exxon Mobil Corp (XOM +0.77%) kept the Dow close to break-even for most of the day after several investment banks raised forecasts for crude prices. El Paso Corporation (EP +6.53%) hit a 52-week high as the company announced a planned tax-free spin-off of its exploration and production unit.
Better-than-expected earnings lifted shares of AutoZone Inc (AZO +5.97%), as more people are fixing their old cars rather than buying new cars they cannot afford. The first day of trading on the Nasdaq was a big one for Russian Internet company Yandex N.V. (YNDX +55.36%) after the firm raised $1.3 billion in an Initial Public Offering.
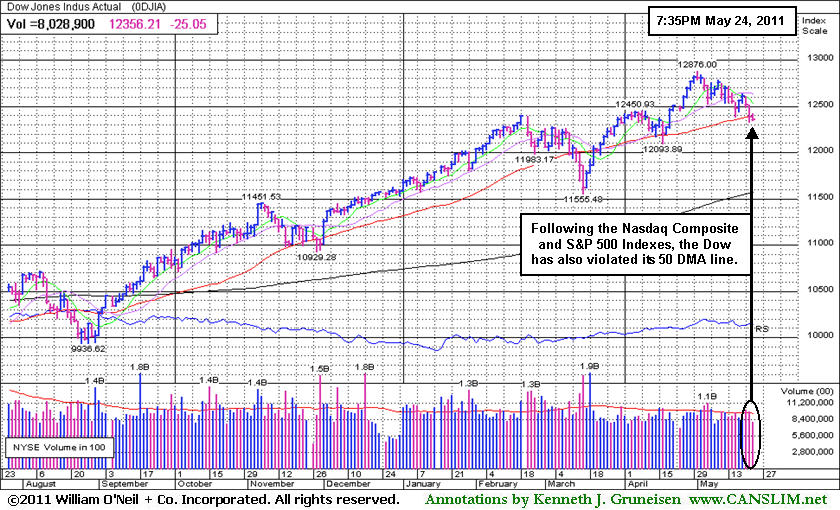
On Monday the Nasdaq Composite Index and benchmark S&P 500 Index violated their respective 50--day moving average lines. The weak technical action in the major indices has raised greater concerns. Coupled with waning leadership (shrinking list of new 52-week highs), the recent slump suggests that market (M criteria) conditions have deteriorated from an "uptrend under pressure" to what may be a longer and more substantial correction. Until a new rally attempt and a solid follow-through day as confirmation, disciplined investors know it is probably best to avoid new buying efforts and take a more defensive stance. Eliminate weakening issues on a case-by-case basis, being sure to protect your hard-earned capital.
PICTURED: The Dow Jones Industrial Average has joined the Nasdaq Composite Index and benchmark S&P 500 Index by also slumping below its 50-day moving average (DMA) line.
|
 Kenneth J. Gruneisen started out as a licensed stockbroker in August 1987, a couple of months prior to the historic stock market crash that took the Dow Jones Industrial Average down -22.6% in a single day. He has published daily fact-based fundamental and technical analysis on high-ranked stocks online for two decades. Through FACTBASEDINVESTING.COM, Kenneth provides educational articles, news, market commentary, and other information regarding proven investment systems that work in good times and bad.
Comments contained in the body of this report are technical opinions only and are not necessarily those of Gruneisen Growth Corp. The material herein has been obtained from sources believed to be reliable and accurate, however, its accuracy and completeness cannot be guaranteed. Our firm, employees, and customers may effect transactions, including transactions contrary to any recommendation herein, or have positions in the securities mentioned herein or options with respect thereto. Any recommendation contained in this report may not be suitable for all investors and it is not to be deemed an offer or solicitation on our part with respect to the purchase or sale of any securities. |
|
 |
Commodity-Linked Groups Posted Gains Amid Broader Declines
Kenneth J. Gruneisen - Passed the CAN SLIM® Master's Exam
Commodity-linked groups posted solid gains as the Oil Services Index ($OSX +1.12%), Integrated Oil Index ($XOI +1.34%), and the Gold & Silver Index ($XAU +2.58%) were standout performers. Meanwhile, the Healthcare Index ($HMO -1.34%) and the tech sector had a widely negative bias on Tuesday as the Networking Index ($NWX -1.57%), Internet Index ($IIX -0.90%), Semiconductor Index ($SOX -0.74%), and Biotechnology Index ($BTK -0.74%) ended unanimously lower. The Retail Index ($RLX -0.58%), Broker/Dealer Index ($XBD -0.22%), and Bank Index ($BKX -0.10%) also failed to provide any encouraging action.
Charts courtesy www.stockcharts.com
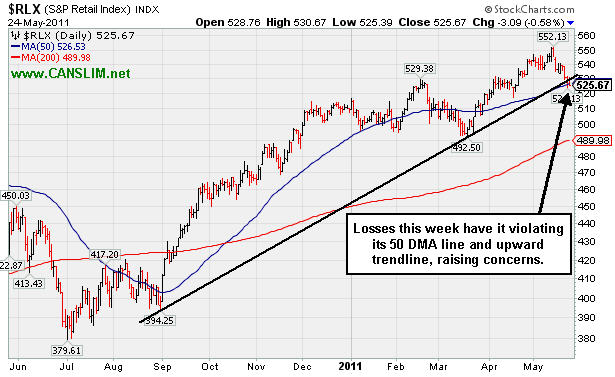
PICTURED: The Retail Index's ($RLX -0.58%) losses this week have led to violations of its 50-day moving average (DMA) line and upward trendline, a worrisome sign of more technical deterioration while the market is currently enduring a correction.
| Oil Services |
$OSX |
262.48 |
+2.92 |
+1.12% |
+7.08% |
| Healthcare |
$HMO |
2,325.36 |
-31.68 |
-1.34% |
+37.43% |
| Integrated Oil |
$XOI |
1,286.42 |
+16.99 |
+1.34% |
+6.04% |
| Semiconductor |
$SOX |
420.21 |
-3.13 |
-0.74% |
+2.04% |
| Networking |
$NWX |
309.42 |
-4.95 |
-1.57% |
+10.29% |
| Internet |
$IIX |
311.29 |
-2.84 |
-0.90% |
+1.16% |
| Broker/Dealer |
$XBD |
112.41 |
-0.25 |
-0.22% |
-7.49% |
| Retail |
$RLX |
525.67 |
-3.09 |
-0.58% |
+3.40% |
| Gold & Silver |
$XAU |
202.63 |
+5.09 |
+2.58% |
-10.57% |
| Bank |
$BKX |
48.92 |
-0.05 |
-0.10% |
-6.30% |
| Biotech |
$BTK |
1,442.45 |
-10.70 |
-0.74% |
+11.16% |
|
|
|
 |
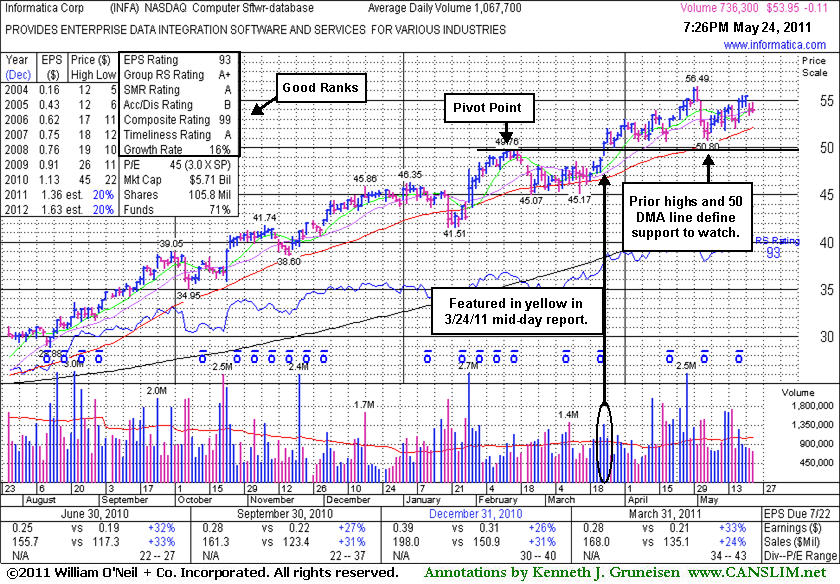
Prior Highs and 50-Day Average Define Support to Watch
Kenneth J. Gruneisen - Passed the CAN SLIM® Master's Exam
Informatica Corp. (INFA -$0.11 or -0.20% to $53.95) was down today for a second consecutive small loss with below average volume. It is extended from its latest sound base pattern. Disciplined investors may watch for secondary buy points to possibly develop and be noted. Since its last appearance in this FSU section with an annotated graph on 4/27/11 under the headline, "New All-Time High After Another Volume-Driven Gain", it endured mild distributional pressure and slumped near prior highs in the $49 area defining support to watch closely coinciding with its 50-day moving average (DMA) line. Subsequent violations would raise concerns and could trigger technical sell signals.
Since the 3/24/11 mid-day report highlighted this Redwood City, CA-based Computer Software - Database firm in yellow it has traded as much as +12.9% higher. It reported +33% earnings on +24% sales revenues for the quarter ended March 31, 2011 versus the year ago period. That followed prior strong results after its Jun, Sep, and Dec '10 earnings increases were all above the +25% minimum guidelines. It has also maintained a steady annual earnings (A criteria) history. The number of top-rated funds owning its shares rose from 634 in Mar '10 to 713 in Mar '11, a reassuring sign concerning the I criteria.
|
|
|
Color Codes Explained :
Y - Better candidates highlighted by our
staff of experts.
G - Previously featured
in past reports as yellow but may no longer be buyable under the
guidelines.
***Last / Change / Volume data in this table is the closing quote data***
Symbol/Exchange
Company Name
Industry Group |
PRICE |
CHANGE
(%Change) |
Day High |
Volume
(% DAV)
(% 50 day avg vol) |
52 Wk Hi
% From Hi |
Featured
Date |
Price
Featured |
Pivot Featured |
|
Max Buy |
CMG
-
NYSE
Chipotle Mexican Grill
LEISURE - Restaurants
|
$280.57
|
-2.76
-0.97% |
$284.43
|
545,469
48.85% of 50 DAV
50 DAV is 1,116,600
|
$289.35
-3.03%
|
4/1/2011
|
$274.00
|
PP = $275.10
|
|
MB = $288.86
|
Most Recent Note - 5/20/2011 4:35:13 PM
G - Hovering near its all-time high after a 5-week cup shaped base with volume totals cooling in recent weeks while consolidating above its 50 DMA line. It faces virtually no resistance due to overhead supply.
>>> The latest Featured Stock Update with an annotated graph appeared on 5/17/2011. Click here.
View all notes |
Alert me of new notes |
CANSLIM.net Company Profile |
SEC |
Zacks Reports |
StockTalk |
News |
Chart |
Request a new note
C
A N
S L
I M


|
EZPW
-
NASDAQ
Ezcorp Inc Cl A
SPECIALTY RETAIL - Specialty Retail, Other
|
$29.93
|
-0.33
-1.09% |
$30.53
|
225,419
65.02% of 50 DAV
50 DAV is 346,700
|
$33.08
-9.52%
|
2/18/2011
|
$27.94
|
PP = $30.04
|
|
MB = $31.54
|
Most Recent Note - 5/23/2011 4:16:24 PM
G - Small loss on light volume after gapping down today. Continuing its healthy consolidation above its 50 DMA line. It has not formed a sound new base pattern. Recent lows define important nearby chart support to watch where technical violations would raise more serious concerns.
>>> The latest Featured Stock Update with an annotated graph appeared on 5/10/2011. Click here.
View all notes |
Alert me of new notes |
CANSLIM.net Company Profile |
SEC |
Zacks Reports |
StockTalk |
News |
Chart |
Request a new note
C
A N
S L
I M
|
FOSL
-
NASDAQ
Fossil Inc
CONSUMER DURABLES - Recreational Goods, Other
|
$101.53
|
+0.95
0.94% |
$102.47
|
516,535
62.23% of 50 DAV
50 DAV is 830,100
|
$107.54
-5.59%
|
2/1/2011
|
$73.30
|
PP = $74.44
|
|
MB = $78.16
|
Most Recent Note - 5/23/2011 4:17:52 PM
G - Down on light volume today. Volume totals have been cooling while consolidating since its considerable gap up gain on 5/10/11 for a new all-time high. It is extended from any sound base. Prior highs near $96 define initial support to watch above its 50 DMA line.
>>> The latest Featured Stock Update with an annotated graph appeared on 5/2/2011. Click here.
View all notes |
Alert me of new notes |
CANSLIM.net Company Profile |
SEC |
Zacks Reports |
StockTalk |
News |
Chart |
Request a new note
C
A N
S L
I M
|
HMSY
-
NASDAQ
H M S Holdings Corp
COMPUTER SOFTWARE and SERVICES - Healthcare Information Service
|
$76.82
|
-0.65
-0.84% |
$77.87
|
111,725
67.22% of 50 DAV
50 DAV is 166,200
|
$84.82
-9.43%
|
11/19/2010
|
$61.89
|
PP = $63.01
|
|
MB = $66.16
|
Most Recent Note - 5/23/2011 4:20:53 PM
G - Small gap down today on near average volume. Its has lingered for the past 3 weeks below its 50 DMA line which may now act as resistance. A rally above it would improve its technical stance. Deterioration below its recent chart low ($73.27) would raise more serious concerns and trigger an additional sell signal.
>>> The latest Featured Stock Update with an annotated graph appeared on 5/23/2011. Click here.
View all notes |
Alert me of new notes |
CANSLIM.net Company Profile |
SEC |
Zacks Reports |
StockTalk |
News |
Chart |
Request a new note
C
A N
S L
I M
|
HS
-
NYSE
Healthspring Inc
HEALTH SERVICES - Health Care Plans
|
$41.11
|
-1.24
-2.93% |
$42.49
|
780,356
80.89% of 50 DAV
50 DAV is 964,700
|
$45.11
-8.87%
|
3/22/2011
|
$38.29
|
PP = $38.85
|
|
MB = $40.79
|
 Most Recent Note - 5/24/2011 4:47:03 PM
G - Down on light volume today for a third consecutive loss, slumping toward prior highs closely coinciding with its 50 DMA line which define important chart support to watch. Violations would trigger technical sell signals.
>>> The latest Featured Stock Update with an annotated graph appeared on 5/20/2011. Click here.
View all notes |
Alert me of new notes |
CANSLIM.net Company Profile |
SEC |
Zacks Reports |
StockTalk |
News |
Chart |
Request a new note
C
A N
S L
I M
|
Symbol/Exchange
Company Name
Industry Group |
PRICE |
CHANGE
(%Change) |
Day High |
Volume
(% DAV)
(% 50 day avg vol) |
52 Wk Hi
% From Hi |
Featured
Date |
Price
Featured |
Pivot Featured |
|
Max Buy |
INFA
-
NASDAQ
Informatica Corp
COMPUTER SOFTWARE and SERVICES - Business Software and Services
|
$53.95
|
-0.11
-0.20% |
$54.74
|
736,968
69.02% of 50 DAV
50 DAV is 1,067,700
|
$56.49
-4.50%
|
3/24/2011
|
$50.04
|
PP = $49.86
|
|
MB = $52.35
|
Most Recent Note - 5/23/2011 4:06:14 PM
G - Small gap down today for a loss with below average volume. It has not formed a sound new base pattern. Prior highs in the $49 area and its 50 DMA line, important chart support to watch. Subsequent violations would trigger technical sell signals.
>>> The latest Featured Stock Update with an annotated graph appeared on 4/27/2011. Click here.
View all notes |
Alert me of new notes |
CANSLIM.net Company Profile |
SEC |
Zacks Reports |
StockTalk |
News |
Chart |
Request a new note
C
A N
S L
I M
|
LULU
-
NASDAQ
Lululemon Athletica
MANUFACTURING - Textile Manufacturing
|
$97.23
|
+0.72
0.75% |
$97.90
|
1,384,674
65.77% of 50 DAV
50 DAV is 2,105,300
|
$102.83
-5.44%
|
5/18/2011
|
$98.15
|
PP = $102.93
|
|
MB = $108.08
|
Most Recent Note - 5/23/2011 4:10:58 PM
Y - Managed a positive reversal today after a small gap down. Volume totals have been lighter than average in recent weeks while this high-ranked Retail-Apparel firm has been consolidating near its all-time highs. Color code was changed to yellow with new pivot point cited based on a new base pattern formed since its 4/21/11 high. Its 50 DMA line defines support coinciding near recent chart lows, important levels to watch on pullbacks.
>>> The latest Featured Stock Update with an annotated graph appeared on 5/3/2011. Click here.
View all notes |
Alert me of new notes |
CANSLIM.net Company Profile |
SEC |
Zacks Reports |
StockTalk |
News |
Chart |
Request a new note
C
A N
S L
I M
|
MG
-
NYSE
Mistras Group Inc
DIVERSIFIED SERVICES - Bulding and Faci;ity Management Services
|
$16.45
|
-0.08
-0.48% |
$16.66
|
96,028
52.42% of 50 DAV
50 DAV is 183,200
|
$18.46
-10.89%
|
3/15/2011
|
$15.48
|
PP = $15.90
|
|
MB = $16.70
|
Most Recent Note - 5/19/2011 5:31:03 PM
G - Completed a new Public Offering recently and it is now lingering below its 50 DMA line with volume totals cooling. Gains above that short-term average would help its outlook, technically, meanwhile the recent low ($15.44 on 5/05/11) defines the next chart support.
>>> The latest Featured Stock Update with an annotated graph appeared on 5/12/2011. Click here.
View all notes |
Alert me of new notes |
CANSLIM.net Company Profile |
SEC |
Zacks Reports |
StockTalk |
News |
Chart |
Request a new note
C
A N
S L
I M
|
MWIV
-
NASDAQ
M W I Veterinary Supply
HEALTH SERVICES - Medical Instruments and; Supplies
|
$81.01
|
-1.07
-1.30% |
$82.67
|
58,384
65.38% of 50 DAV
50 DAV is 89,300
|
$86.99
-6.87%
|
11/4/2010
|
$61.79
|
PP = $59.60
|
|
MB = $62.58
|
Most Recent Note - 5/19/2011 5:32:05 PM
G - Hovering in a tight trading range near its all-time high with volume totals cooling since 5/05/11 while stubbornly holding its ground. It has not formed a sound base pattern. Its 50 DMA line defines important support to watch.
>>> The latest Featured Stock Update with an annotated graph appeared on 5/5/2011. Click here.
View all notes |
Alert me of new notes |
CANSLIM.net Company Profile |
SEC |
Zacks Reports |
StockTalk |
News |
Chart |
Request a new note
C
A N
S L
I M
|
OPNT
-
NASDAQ
Opnet Technologies
INTERNET - Internet Software and Services
|
$37.02
|
-0.46
-1.23% |
$37.80
|
57,280
44.51% of 50 DAV
50 DAV is 128,700
|
$42.51
-12.91%
|
5/11/2011
|
$41.21
|
PP = $40.50
|
|
MB = $42.53
|
Most Recent Note - 5/23/2011 4:13:33 PM
G - Gapped down and violated its 50 DMA line yet closed near the session high with very light volume behind its loss today. Concerns were raised after it slumped more than -7% below its pivot point and undercut its prior high close ($39.44 on 4/01/11). Its color code was changed to green after it completely negated its latest breakout.
>>> The latest Featured Stock Update with an annotated graph appeared on 5/11/2011. Click here.
View all notes |
Alert me of new notes |
CANSLIM.net Company Profile |
SEC |
Zacks Reports |
StockTalk |
News |
Chart |
Request a new note
C
A N
S L
I M
|
Symbol/Exchange
Company Name
Industry Group |
PRICE |
CHANGE
(%Change) |
Day High |
Volume
(% DAV)
(% 50 day avg vol) |
52 Wk Hi
% From Hi |
Featured
Date |
Price
Featured |
Pivot Featured |
|
Max Buy |
PCLN
-
NASDAQ
Priceline.Com Inc
INTERNET - Internet Software and Services
|
$490.92
|
-10.74
-2.14% |
$504.68
|
1,639,249
146.94% of 50 DAV
50 DAV is 1,115,600
|
$561.88
-12.63%
|
1/3/2011
|
$399.55
|
PP = $428.20
|
|
MB = $449.61
|
Most Recent Note - 5/23/2011 3:55:20 PM
G - Gapped down today, violating its 50 DMA line again with a loss on higher volume indicative of more distributional pressure. Recent chart low ($493.67 on 5/17/11) defines an important near-term support level where further deterioration would raise even greater concerns.
>>> The latest Featured Stock Update with an annotated graph appeared on 5/19/2011. Click here.
View all notes |
Alert me of new notes |
CANSLIM.net Company Profile |
SEC |
Zacks Reports |
StockTalk |
News |
Chart |
Request a new note
C
A N
S L
I M
|
RAX
-
NYSE
Rackspace Hosting Inc
INTERNET - Internet Software and; Services
|
$40.87
|
-0.50
-1.21% |
$41.90
|
1,114,846
62.51% of 50 DAV
50 DAV is 1,783,600
|
$46.50
-12.10%
|
3/16/2011
|
$36.28
|
PP = $40.72
|
|
MB = $42.76
|
Most Recent Note - 5/23/2011 3:58:25 PM
G - Gapped down for a loss today without heavy volume, slumping near its 50 DMA line. It has not formed a sound new base. Deterioration below its recent chart low ($38.84 on 5/12/11) would trigger more worrisome technical sell signals.
>>> The latest Featured Stock Update with an annotated graph appeared on 5/13/2011. Click here.
View all notes |
Alert me of new notes |
CANSLIM.net Company Profile |
SEC |
Zacks Reports |
StockTalk |
News |
Chart |
Request a new note
C
A N
S L
I M
|
TIBX
-
NASDAQ
Tibco Software Inc
COMPUTER SOFTWARE and SERVICES - Business Software and Services
|
$27.75
|
-0.45
-1.58% |
$28.48
|
2,531,038
95.24% of 50 DAV
50 DAV is 2,657,400
|
$30.75
-9.76%
|
3/18/2011
|
$23.88
|
PP = $26.04
|
|
MB = $27.34
|
Most Recent Note - 5/23/2011 3:48:09 PM
G - Gapped down today, consolidating just above its 50 DMA line and recent low ($27.17). Violations may trigger technical sell signals.
>>> The latest Featured Stock Update with an annotated graph appeared on 5/18/2011. Click here.
View all notes |
Alert me of new notes |
CANSLIM.net Company Profile |
SEC |
Zacks Reports |
StockTalk |
News |
Chart |
Request a new note
C
A N
S L
I M
|
ULTA
-
NASDAQ
Ulta Salon Cosm & Frag
SPECIALTY RETAIL - Specialty Retail, Other
|
$52.05
|
-0.36
-0.69% |
$52.76
|
445,694
83.75% of 50 DAV
50 DAV is 532,200
|
$56.87
-8.48%
|
1/6/2011
|
$36.12
|
PP = $37.34
|
|
MB = $39.21
|
Most Recent Note - 5/20/2011 4:49:03 PM
G - Losses this week with higher volume were indicative of distributional pressure while slumping from its all-time high toward its 50 DMA line (now $50.68). Chart readers know that short-term average typically defines support to watch where a violation may trigger a technical sell signal.
>>> The latest Featured Stock Update with an annotated graph appeared on 4/28/2011. Click here.
View all notes |
Alert me of new notes |
CANSLIM.net Company Profile |
SEC |
Zacks Reports |
StockTalk |
News |
Chart |
Request a new note
C
A N
S L
I M
|
|
|
|
THESE ARE NOT BUY RECOMMENDATIONS!
Comments contained in the body of this report are technical
opinions only. The material herein has been obtained
from sources believed to be reliable and accurate, however,
its accuracy and completeness cannot be guaranteed.
This site is not an investment advisor, hence it does
not endorse or recommend any securities or other investments.
Any recommendation contained in this report may not
be suitable for all investors and it is not to be deemed
an offer or solicitation on our part with respect to
the purchase or sale of any securities. All trademarks,
service marks and trade names appearing in this report
are the property of their respective owners, and are
likewise used for identification purposes only.
This report is a service available
only to active Paid Premium Members.
You may opt-out of receiving report notifications
at any time. Questions or comments may be submitted
by writing to Premium Membership Services 665 S.E. 10 Street, Suite 201 Deerfield Beach, FL 33441-5634 or by calling 1-800-965-8307
or 954-785-1121.
|
|
|

