You are not logged in.
This means you
CAN ONLY VIEW reports that were published prior to Tuesday, April 15, 2025.
You
MUST UPGRADE YOUR MEMBERSHIP if you want to see any current reports.
AFTER MARKET UPDATE - MONDAY, MAY 23RD, 2011
Previous After Market Report Next After Market Report >>>
|
|
|
|
DOW |
-130.78 |
12,381.26 |
-1.05% |
|
Volume |
980,957,830 |
-2% |
|
Volume |
1,754,734,130 |
+2% |
|
NASDAQ |
-44.42 |
2,758.90 |
-1.58% |
|
Advancers |
620 |
20% |
|
Advancers |
495 |
18% |
|
S&P 500 |
-15.90 |
1,317.37 |
-1.19% |
|
Decliners |
2,403 |
77% |
|
Decliners |
2,129 |
78% |
|
Russell 2000 |
-15.02 |
814.04 |
-1.81% |
|
52 Wk Highs |
50 |
|
|
52 Wk Highs |
37 |
|
|
S&P 600 |
-7.47 |
435.78 |
-1.69% |
|
52 Wk Lows |
44 |
|
|
52 Wk Lows |
86 |
|
|
 |
Major Averages Slump Into a Technical Correction
Kenneth J. Gruneisen - Passed the CAN SLIM® Master's Exam
The major averages were sharply lower in early trading after a Standard & Poor's downgrade of Italy's credit outlook. Declining issues beat advancers by about 4-1 on both the NYSE and the Nasdaq exchange. Volume totals were reported mixed, slightly higher than the prior session total on the Nasdaq exchange and slightly lower on the NYSE. New 52-week highs outnumbered new 52-week lows on the NYSE, but on the Nasdaq exchange new lows outnumbered new highs. Leadership waned as there were only 7 high-ranked companies from the CANSLIM.net Leaders List that made new 52-week highs and appeared on the CANSLIM.net BreakOuts Page, down from the total of 19 on the prior session. On the Featured Stocks Page there were only 3 gainers out of the 15 high-ranked leaders currently included.
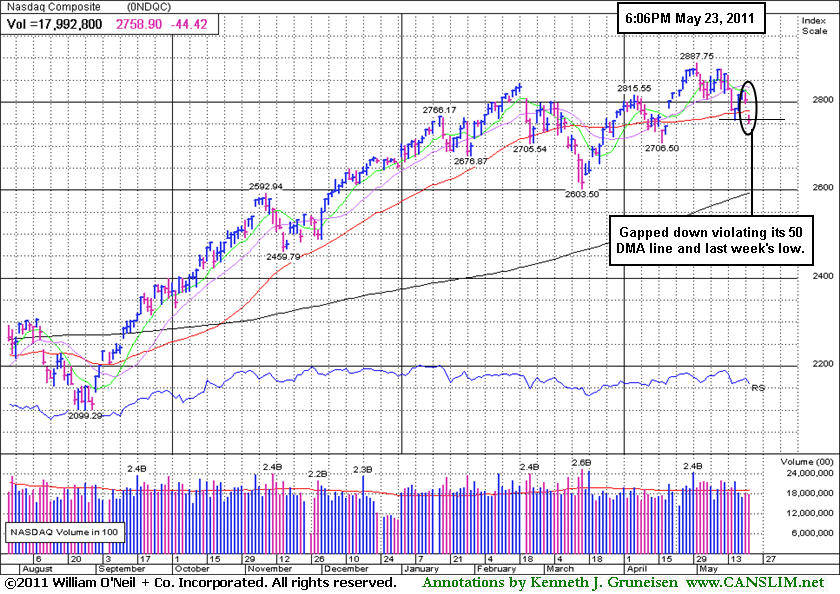
The Nasdaq Composite Index and benchmark S&P 500 Index violated their respective 50--day moving average lines. The weak technical action in the major indices has raised greater concerns. Coupled with waning leadership (shrinking list of new 52-week highs), the recent slump suggests that market (M criteria) conditions have deteriorated from an "uptrend under pressure" to what may be a longer and more substantial correction. Until a new rally attempt and a solid follow-through day as confirmation, disciplined investors know it is probably best to avoid new buying efforts and take a more defensive stance. Eliminate weakening issues on a case-by-case basis, being sure to protect your hard-earned capital..
Yields on 10-year Greek debt rose to a euro-era record, meanwhile those on Italian, Spanish and Portuguese bonds also increased. Spain's ruling Socialist Party was routed in local elections in a backlash against austerity measures. Concern about Europe's debt crisis were a factor as the euro declined against the dollar, increasing prices in Europe for American imports. Weaker manufacturing growth in China also added to worries about the global economy.
The price of oil fell by over $2 per barrel, and copper declined the most in over a week in New York. Freeport McMoran Copper and Gold (FCX -1.98%) and many industrial, mining, and energy companies led the market's retreat.
Apple Corp (AAPL -0.24%) continued to sputter following last week's explosion at a Chinese plant that is a key supplier. It is consolidating below its 50-day moving average (DMA) line which is now downward sloping. On the plus side, Krispy Kreme Doughnuts Inc (KKD +25.78%) spiked higher after posting better-than-expected earnings.
PICTURED: The Nasdaq Composite Index gapped down on Monday, violating its 50-day moving average (DMA) line and last week's low, finishing -4.46% off its 52-week high. The tech-heavy index stalled after recently topping its October 2007 high.
|
 Kenneth J. Gruneisen started out as a licensed stockbroker in August 1987, a couple of months prior to the historic stock market crash that took the Dow Jones Industrial Average down -22.6% in a single day. He has published daily fact-based fundamental and technical analysis on high-ranked stocks online for two decades. Through FACTBASEDINVESTING.COM, Kenneth provides educational articles, news, market commentary, and other information regarding proven investment systems that work in good times and bad.
Comments contained in the body of this report are technical opinions only and are not necessarily those of Gruneisen Growth Corp. The material herein has been obtained from sources believed to be reliable and accurate, however, its accuracy and completeness cannot be guaranteed. Our firm, employees, and customers may effect transactions, including transactions contrary to any recommendation herein, or have positions in the securities mentioned herein or options with respect thereto. Any recommendation contained in this report may not be suitable for all investors and it is not to be deemed an offer or solicitation on our part with respect to the purchase or sale of any securities. |
|
 |
Tech, Financial, and Commodity-Linked Groups Sink
Kenneth J. Gruneisen - Passed the CAN SLIM® Master's Exam
The tech sector faced pressure as the Semiconductor Index ($SOX -2.13%), Internet Index ($IIX -1.93%), Networking Index ($NWX -1.93%), and Biotechnology Index ($BTK -1.60%) ended unanimously lower. Commodity-linked groups slumped as the Oil Services Index ($OSX -2.19%), Integrated Oil Index ($XOI -1.49%), and Gold & Silver Index ($XAU -0.88%) lost ground. The Broker/Dealer Index ($XBD -1.64%) and Bank Index ($BKX -1.45%) continued slumping below their 200-day moving averages, as "leading indicators", still leading the major averages lower. Losses for the Retail Index ($RLX -0.46%) and Healthcare Index ($HMO -1.65%) rounded out Monday's thoroughly negative session.
Charts courtesy www.stockcharts.com
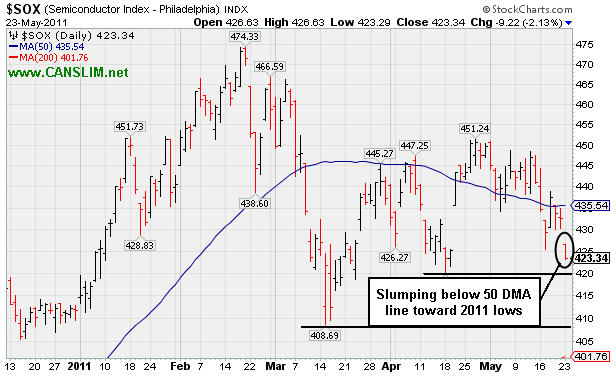
PICTURED: The Semiconductor Index ($SOX -2.13%) is slumping below its 50-day moving average (DMA) line toward 2011 lows.
| Oil Services |
$OSX |
259.56 |
-5.81 |
-2.19% |
+5.89% |
| Healthcare |
$HMO |
2,357.04 |
-39.61 |
-1.65% |
+39.31% |
| Integrated Oil |
$XOI |
1,269.43 |
-19.25 |
-1.49% |
+4.64% |
| Semiconductor |
$SOX |
423.34 |
-9.22 |
-2.13% |
+2.80% |
| Networking |
$NWX |
314.37 |
-6.18 |
-1.93% |
+12.05% |
| Internet |
$IIX |
314.13 |
-6.19 |
-1.93% |
+2.08% |
| Broker/Dealer |
$XBD |
112.67 |
-1.88 |
-1.64% |
-7.28% |
| Retail |
$RLX |
528.76 |
-2.47 |
-0.46% |
+4.01% |
| Gold & Silver |
$XAU |
197.54 |
-1.75 |
-0.88% |
-12.82% |
| Bank |
$BKX |
48.97 |
-0.72 |
-1.45% |
-6.21% |
| Biotech |
$BTK |
1,453.15 |
-23.59 |
-1.60% |
+11.98% |
|
|
|
 |
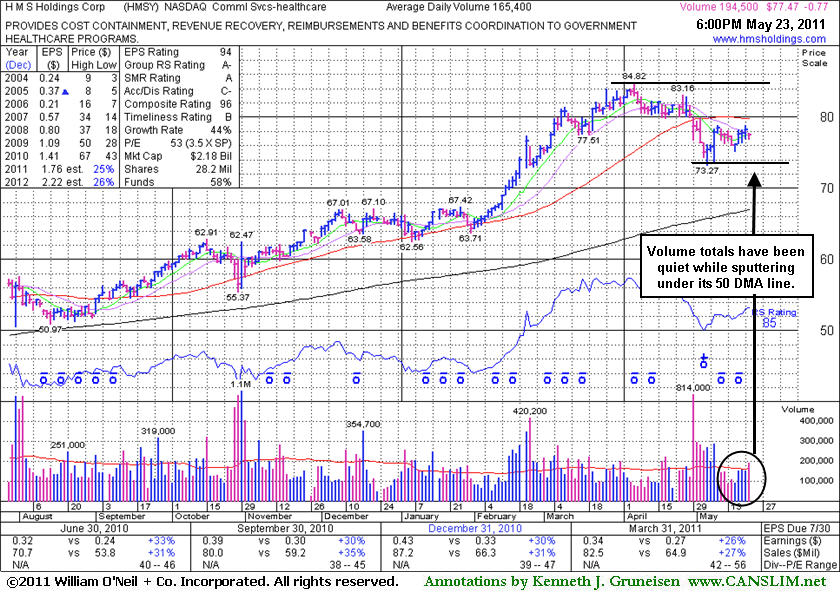
Volume Quiet While Sputtering Under 50-Day Average
Kenneth J. Gruneisen - Passed the CAN SLIM® Master's Exam
H M S Holdings Corp (HMSY -$0.77 or -0.98% to $77.47) closed lower after a small gap down today on slightly above average volume. Deterioration below its recent chart low ($73.27) would raise more serious concerns and trigger an additional sell signal. Since its last appearance in this FSU section on 4/26/11 with an annotated graph under the headline, "Consolidating Above 50-Day Average Ahead Of Earnings News," it subsequently violated its 50-day moving average (DMA) line, triggering a technical sell signal with damaging distributional losses. It has lingered for the past 3 weeks below its 50-day moving average (DMA) line which may now act as resistance. A rally above that important short-term average line is needed to improve its technical stance. Meanwhile, the path of least resistance may likely lead it lower. Also keep in mind, 3 out of 4 growth stocks follow along with the broader market (M criteria) direction, and today's market commentary cites technical damaged that has hurt the outlook concerning any new buying efforts for the near term.
Disciplined investors may watch for a new base to possibly form and be noted in the future. First, gains above its short-term average line are needed for its outlook to improve. In just over 26 months after it was first featured at $34.08 in the February 20, 2009 mid-day report (when clearing an ascending base pattern) it has traded up as much as +148.8% higher. This Commercial Services - Healthcare firm has maintained a solid sales revenues and earnings growth history that still satisfies the C and A criteria. The number of top-rated funds owning its shares has risen from 462 in Mar '10 to 508 in Mar '11, a very reassuring sign concerning the I criteria.
|
|
|
Color Codes Explained :
Y - Better candidates highlighted by our
staff of experts.
G - Previously featured
in past reports as yellow but may no longer be buyable under the
guidelines.
***Last / Change / Volume data in this table is the closing quote data***
Symbol/Exchange
Company Name
Industry Group |
PRICE |
CHANGE
(%Change) |
Day High |
Volume
(% DAV)
(% 50 day avg vol) |
52 Wk Hi
% From Hi |
Featured
Date |
Price
Featured |
Pivot Featured |
|
Max Buy |
CMG
-
NYSE
Chipotle Mexican Grill
LEISURE - Restaurants
|
$283.33
|
+3.44
1.23% |
$285.25
|
916,407
82.41% of 50 DAV
50 DAV is 1,112,000
|
$289.35
-2.08%
|
4/1/2011
|
$274.00
|
PP = $275.10
|
|
MB = $288.86
|
Most Recent Note - 5/20/2011 4:35:13 PM
G - Hovering near its all-time high after a 5-week cup shaped base with volume totals cooling in recent weeks while consolidating above its 50 DMA line. It faces virtually no resistance due to overhead supply.
>>> The latest Featured Stock Update with an annotated graph appeared on 5/17/2011. Click here.
View all notes |
Alert me of new notes |
CANSLIM.net Company Profile |
SEC |
Zacks Reports |
StockTalk |
News |
Chart |
Request a new note
C
A N
S L
I M


|
CTSH
-
NASDAQ
Cognizant Tech Sol Cl A
COMPUTER SOFTWARE and SERVICES - Business Software and Services
|
$72.19
|
-1.86
-2.51% |
$72.87
|
3,305,935
133.52% of 50 DAV
50 DAV is 2,475,900
|
$83.48
-13.52%
|
2/7/2011
|
$75.09
|
PP = $76.46
|
|
MB = $80.28
|
 Most Recent Note - 5/23/2011 4:04:08 PM
Gapped down today for another damaging loss with above average volume, slumping near prior lows in the $70.50 range and its 200 DMA line defining important long-term chart support to watch. Based on weak action it will be dropped from the Featured Stocks list tonight. Gains above its 50 DMA line are needed for its outlook to improve.
>>> The latest Featured Stock Update with an annotated graph appeared on 5/16/2011. Click here.
View all notes |
Alert me of new notes |
CANSLIM.net Company Profile |
SEC |
Zacks Reports |
StockTalk |
News |
Chart |
Request a new note
C
A N
S L
I M
|
EZPW
-
NASDAQ
Ezcorp Inc Cl A
SPECIALTY RETAIL - Specialty Retail, Other
|
$30.26
|
-0.70
-2.26% |
$30.62
|
197,944
57.01% of 50 DAV
50 DAV is 347,200
|
$33.08
-8.52%
|
2/18/2011
|
$27.94
|
PP = $30.04
|
|
MB = $31.54
|
Most Recent Note - 5/23/2011 4:16:24 PM
G - Small loss on light volume after gapping down today. Continuing its healthy consolidation above its 50 DMA line. It has not formed a sound new base pattern. Recent lows define important nearby chart support to watch where technical violations would raise more serious concerns.
>>> The latest Featured Stock Update with an annotated graph appeared on 5/10/2011. Click here.
View all notes |
Alert me of new notes |
CANSLIM.net Company Profile |
SEC |
Zacks Reports |
StockTalk |
News |
Chart |
Request a new note
C
A N
S L
I M
|
FOSL
-
NASDAQ
Fossil Inc
CONSUMER DURABLES - Recreational Goods, Other
|
$100.58
|
-2.36
-2.29% |
$103.05
|
426,016
50.64% of 50 DAV
50 DAV is 841,300
|
$107.54
-6.47%
|
2/1/2011
|
$73.30
|
PP = $74.44
|
|
MB = $78.16
|
Most Recent Note - 5/23/2011 4:17:52 PM
G - Down on light volume today. Volume totals have been cooling while consolidating since its considerable gap up gain on 5/10/11 for a new all-time high. It is extended from any sound base. Prior highs near $96 define initial support to watch above its 50 DMA line.
>>> The latest Featured Stock Update with an annotated graph appeared on 5/2/2011. Click here.
View all notes |
Alert me of new notes |
CANSLIM.net Company Profile |
SEC |
Zacks Reports |
StockTalk |
News |
Chart |
Request a new note
C
A N
S L
I M
|
HMSY
-
NASDAQ
H M S Holdings Corp
COMPUTER SOFTWARE and SERVICES - Healthcare Information Service
|
$77.47
|
-0.77
-0.98% |
$77.79
|
196,136
118.58% of 50 DAV
50 DAV is 165,400
|
$84.82
-8.67%
|
11/19/2010
|
$61.89
|
PP = $63.01
|
|
MB = $66.16
|
Most Recent Note - 5/23/2011 4:20:53 PM
G - Small gap down today on near average volume. Its has lingered for the past 3 weeks below its 50 DMA line which may now act as resistance. A rally above it would improve its technical stance. Deterioration below its recent chart low ($73.27) would raise more serious concerns and trigger an additional sell signal.
>>> The latest Featured Stock Update with an annotated graph appeared on 5/23/2011. Click here.
View all notes |
Alert me of new notes |
CANSLIM.net Company Profile |
SEC |
Zacks Reports |
StockTalk |
News |
Chart |
Request a new note
C
A N
S L
I M
|
Symbol/Exchange
Company Name
Industry Group |
PRICE |
CHANGE
(%Change) |
Day High |
Volume
(% DAV)
(% 50 day avg vol) |
52 Wk Hi
% From Hi |
Featured
Date |
Price
Featured |
Pivot Featured |
|
Max Buy |
HS
-
NYSE
Healthspring Inc
HEALTH SERVICES - Health Care Plans
|
$42.35
|
-0.74
-1.72% |
$42.76
|
602,397
62.62% of 50 DAV
50 DAV is 962,000
|
$45.11
-6.12%
|
3/22/2011
|
$38.29
|
PP = $38.85
|
|
MB = $40.79
|
Most Recent Note - 5/20/2011 3:31:01 PM
G - Volume totals have cooled this week while hovering at its all-time high, extended from any sound base pattern. Prior highs define important chart support to watch along with its 50 DMA line in the $39-40 area. Violations would trigger technical sell signals.
>>> The latest Featured Stock Update with an annotated graph appeared on 5/20/2011. Click here.
View all notes |
Alert me of new notes |
CANSLIM.net Company Profile |
SEC |
Zacks Reports |
StockTalk |
News |
Chart |
Request a new note
C
A N
S L
I M
|
INFA
-
NASDAQ
Informatica Corp
COMPUTER SOFTWARE and SERVICES - Business Software and Services
|
$54.06
|
-1.32
-2.38% |
$54.65
|
826,524
77.43% of 50 DAV
50 DAV is 1,067,400
|
$56.49
-4.30%
|
3/24/2011
|
$50.04
|
PP = $49.86
|
|
MB = $52.35
|
Most Recent Note - 5/23/2011 4:06:14 PM
G - Small gap down today for a loss with below average volume. It has not formed a sound new base pattern. Prior highs in the $49 area and its 50 DMA line, important chart support to watch. Subsequent violations would trigger technical sell signals.
>>> The latest Featured Stock Update with an annotated graph appeared on 4/27/2011. Click here.
View all notes |
Alert me of new notes |
CANSLIM.net Company Profile |
SEC |
Zacks Reports |
StockTalk |
News |
Chart |
Request a new note
C
A N
S L
I M
|
LULU
-
NASDAQ
Lululemon Athletica
MANUFACTURING - Textile Manufacturing
|
$96.51
|
+0.22
0.23% |
$97.25
|
1,251,572
59.42% of 50 DAV
50 DAV is 2,106,300
|
$102.83
-6.15%
|
5/18/2011
|
$98.15
|
PP = $102.93
|
|
MB = $108.08
|
Most Recent Note - 5/23/2011 4:10:58 PM
Y - Managed a positive reversal today after a small gap down. Volume totals have been lighter than average in recent weeks while this high-ranked Retail-Apparel firm has been consolidating near its all-time highs. Color code was changed to yellow with new pivot point cited based on a new base pattern formed since its 4/21/11 high. Its 50 DMA line defines support coinciding near recent chart lows, important levels to watch on pullbacks.
>>> The latest Featured Stock Update with an annotated graph appeared on 5/3/2011. Click here.
View all notes |
Alert me of new notes |
CANSLIM.net Company Profile |
SEC |
Zacks Reports |
StockTalk |
News |
Chart |
Request a new note
C
A N
S L
I M
|
MG
-
NYSE
Mistras Group Inc
DIVERSIFIED SERVICES - Bulding and Faci;ity Management Services
|
$16.53
|
+0.01
0.06% |
$16.62
|
106,547
58.57% of 50 DAV
50 DAV is 181,900
|
$18.46
-10.46%
|
3/15/2011
|
$15.48
|
PP = $15.90
|
|
MB = $16.70
|
Most Recent Note - 5/19/2011 5:31:03 PM
G - Completed a new Public Offering recently and it is now lingering below its 50 DMA line with volume totals cooling. Gains above that short-term average would help its outlook, technically, meanwhile the recent low ($15.44 on 5/05/11) defines the next chart support.
>>> The latest Featured Stock Update with an annotated graph appeared on 5/12/2011. Click here.
View all notes |
Alert me of new notes |
CANSLIM.net Company Profile |
SEC |
Zacks Reports |
StockTalk |
News |
Chart |
Request a new note
C
A N
S L
I M
|
MWIV
-
NASDAQ
M W I Veterinary Supply
HEALTH SERVICES - Medical Instruments and; Supplies
|
$82.08
|
-1.31
-1.57% |
$83.00
|
75,624
83.29% of 50 DAV
50 DAV is 90,800
|
$86.99
-5.64%
|
11/4/2010
|
$61.79
|
PP = $59.60
|
|
MB = $62.58
|
Most Recent Note - 5/19/2011 5:32:05 PM
G - Hovering in a tight trading range near its all-time high with volume totals cooling since 5/05/11 while stubbornly holding its ground. It has not formed a sound base pattern. Its 50 DMA line defines important support to watch.
>>> The latest Featured Stock Update with an annotated graph appeared on 5/5/2011. Click here.
View all notes |
Alert me of new notes |
CANSLIM.net Company Profile |
SEC |
Zacks Reports |
StockTalk |
News |
Chart |
Request a new note
C
A N
S L
I M
|
Symbol/Exchange
Company Name
Industry Group |
PRICE |
CHANGE
(%Change) |
Day High |
Volume
(% DAV)
(% 50 day avg vol) |
52 Wk Hi
% From Hi |
Featured
Date |
Price
Featured |
Pivot Featured |
|
Max Buy |
OPNT
-
NASDAQ
Opnet Technologies
INTERNET - Internet Software and Services
|
$37.48
|
-1.08
-2.80% |
$37.96
|
95,741
74.39% of 50 DAV
50 DAV is 128,700
|
$42.51
-11.83%
|
5/11/2011
|
$41.21
|
PP = $40.50
|
|
MB = $42.53
|
Most Recent Note - 5/23/2011 4:13:33 PM
G - Gapped down and violated its 50 DMA line yet closed near the session high with very light volume behind its loss today. Concerns were raised after it slumped more than -7% below its pivot point and undercut its prior high close ($39.44 on 4/01/11). Its color code was changed to green after it completely negated its latest breakout.
>>> The latest Featured Stock Update with an annotated graph appeared on 5/11/2011. Click here.
View all notes |
Alert me of new notes |
CANSLIM.net Company Profile |
SEC |
Zacks Reports |
StockTalk |
News |
Chart |
Request a new note
C
A N
S L
I M
|
PCLN
-
NASDAQ
Priceline.Com Inc
INTERNET - Internet Software and Services
|
$501.66
|
-18.42
-3.54% |
$513.58
|
1,379,983
124.72% of 50 DAV
50 DAV is 1,106,500
|
$561.88
-10.72%
|
1/3/2011
|
$399.55
|
PP = $428.20
|
|
MB = $449.61
|
Most Recent Note - 5/23/2011 3:55:20 PM
G - Gapped down today, violating its 50 DMA line again with a loss on higher volume indicative of more distributional pressure. Recent chart low ($493.67 on 5/17/11) defines an important near-term support level where further deterioration would raise even greater concerns.
>>> The latest Featured Stock Update with an annotated graph appeared on 5/19/2011. Click here.
View all notes |
Alert me of new notes |
CANSLIM.net Company Profile |
SEC |
Zacks Reports |
StockTalk |
News |
Chart |
Request a new note
C
A N
S L
I M
|
RAX
-
NYSE
Rackspace Hosting Inc
INTERNET - Internet Software and; Services
|
$41.37
|
-1.71
-3.97% |
$42.19
|
1,466,401
82.50% of 50 DAV
50 DAV is 1,777,500
|
$46.50
-11.02%
|
3/16/2011
|
$36.28
|
PP = $40.72
|
|
MB = $42.76
|
Most Recent Note - 5/23/2011 3:58:25 PM
G - Gapped down for a loss today without heavy volume, slumping near its 50 DMA line. It has not formed a sound new base. Deterioration below its recent chart low ($38.84 on 5/12/11) would trigger more worrisome technical sell signals.
>>> The latest Featured Stock Update with an annotated graph appeared on 5/13/2011. Click here.
View all notes |
Alert me of new notes |
CANSLIM.net Company Profile |
SEC |
Zacks Reports |
StockTalk |
News |
Chart |
Request a new note
C
A N
S L
I M
|
TIBX
-
NASDAQ
Tibco Software Inc
COMPUTER SOFTWARE and SERVICES - Business Software and Services
|
$28.20
|
-1.20
-4.07% |
$28.96
|
2,160,299
81.30% of 50 DAV
50 DAV is 2,657,300
|
$30.75
-8.31%
|
3/18/2011
|
$23.88
|
PP = $26.04
|
|
MB = $27.34
|
Most Recent Note - 5/23/2011 3:48:09 PM
G - Gapped down today, consolidating just above its 50 DMA line and recent low ($27.17). Violations may trigger technical sell signals.
>>> The latest Featured Stock Update with an annotated graph appeared on 5/18/2011. Click here.
View all notes |
Alert me of new notes |
CANSLIM.net Company Profile |
SEC |
Zacks Reports |
StockTalk |
News |
Chart |
Request a new note
C
A N
S L
I M
|
ULTA
-
NASDAQ
Ulta Salon Cosm & Frag
SPECIALTY RETAIL - Specialty Retail, Other
|
$52.41
|
-0.09
-0.17% |
$52.88
|
645,975
111.36% of 50 DAV
50 DAV is 580,100
|
$56.87
-7.84%
|
1/6/2011
|
$36.12
|
PP = $37.34
|
|
MB = $39.21
|
Most Recent Note - 5/20/2011 4:49:03 PM
G - Losses this week with higher volume were indicative of distributional pressure while slumping from its all-time high toward its 50 DMA line (now $50.68). Chart readers know that short-term average typically defines support to watch where a violation may trigger a technical sell signal.
>>> The latest Featured Stock Update with an annotated graph appeared on 4/28/2011. Click here.
View all notes |
Alert me of new notes |
CANSLIM.net Company Profile |
SEC |
Zacks Reports |
StockTalk |
News |
Chart |
Request a new note
C
A N
S L
I M
|
Symbol/Exchange
Company Name
Industry Group |
PRICE |
CHANGE
(%Change) |
Day High |
Volume
(% DAV)
(% 50 day avg vol) |
52 Wk Hi
% From Hi |
Featured
Date |
Price
Featured |
Pivot Featured |
|
Max Buy |
|
|
|
THESE ARE NOT BUY RECOMMENDATIONS!
Comments contained in the body of this report are technical
opinions only. The material herein has been obtained
from sources believed to be reliable and accurate, however,
its accuracy and completeness cannot be guaranteed.
This site is not an investment advisor, hence it does
not endorse or recommend any securities or other investments.
Any recommendation contained in this report may not
be suitable for all investors and it is not to be deemed
an offer or solicitation on our part with respect to
the purchase or sale of any securities. All trademarks,
service marks and trade names appearing in this report
are the property of their respective owners, and are
likewise used for identification purposes only.
This report is a service available
only to active Paid Premium Members.
You may opt-out of receiving report notifications
at any time. Questions or comments may be submitted
by writing to Premium Membership Services 665 S.E. 10 Street, Suite 201 Deerfield Beach, FL 33441-5634 or by calling 1-800-965-8307
or 954-785-1121.
|
|
|

