You are not logged in.
This means you
CAN ONLY VIEW reports that were published prior to Monday, April 14, 2025.
You
MUST UPGRADE YOUR MEMBERSHIP if you want to see any current reports.
AFTER MARKET UPDATE - TUESDAY, MAY 22ND, 2012
Previous After Market Report Next After Market Report >>>
|
|
|
|
DOW |
-1.67 |
12,502.81 |
-0.01% |
|
Volume |
846,959,980 |
+6% |
|
Volume |
1,792,252,980 |
-1% |
|
NASDAQ |
-8.13 |
2,839.08 |
-0.29% |
|
Advancers |
1,575 |
50% |
|
Advancers |
923 |
35% |
|
S&P 500 |
+0.64 |
1,316.63 |
+0.05% |
|
Decliners |
1,472 |
47% |
|
Decliners |
1,604 |
61% |
|
Russell 2000 |
-5.01 |
759.63 |
-0.66% |
|
52 Wk Highs |
21 |
|
|
52 Wk Highs |
24 |
|
|
S&P 600 |
-2.70 |
428.03 |
-0.63% |
|
52 Wk Lows |
42 |
|
|
52 Wk Lows |
71 |
|
|
 |
Major Averages Failed to Build on "Day 1" Gains
Kenneth J. Gruneisen - Passed the CAN SLIM® Master's Exam
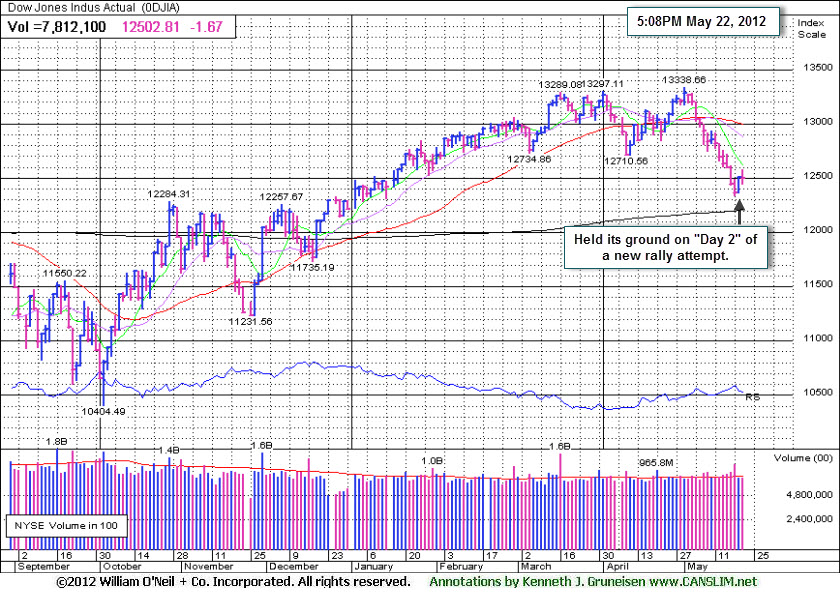
On Tuesday the major averages failed to build on Monday's gains which had snapped a six-day losing streak. Volume totals were reported mixed, lighter on the Nasdaq exchange and higher on the NYSE versus the prior session's totals. Breadth was narrowly positive on the NYSE but decliners led advancers by more than 3-2 on the Nasdaq exchange. New 52-week highs were still outnumbered by new 52-week lows on the NYSE and on the Nasdaq exchange. There were 4 high-ranked companies from the CANSLIM.net Leaders List that made new 52-week highs and appeared on the CANSLIM.net BreakOuts Page, up from the prior session total of 0 stocks. Investors watching for a follow-through day in the days and weeks ahead should be aware that an expansion in the number of stocks hitting new 52-week highs is an important component to any new confirmed rally. Tuesday's session brought gains for 13 of the 20 high-ranked companies currently included on the Featured Stocks Page, a list that recently has been shrinking.
The major averages advanced after a Chinese newspaper reported the country plans to fast track approvals for infrastructure projects and construction spending to spur growth. Positive housing data also provided a tailwind. Homebuilder Pulte Group (PHM +2.48%) was up after existing homes sales unexpectedly rose +3.4% in April. However, Fitch ratings agency downgraded Japan's credit rating with a negative outlook and the OECD projected that global growth would ease this year. European markets rallied to finish the session higher. The FTSE gained +1.9% in London and the DAX added +1.7% in Germany.
JP Morgan Chase & Co (JPM +4.61%) climbed to lead gainers in the Dow. Retailers Urban Outfitters Inc (URBN +7.42%) and Williams-Sonoma Inc (WSM +3.34%) gained after posting earnings ahead of analyst projections. Over in tech, Facebook Inc (FB -8.9%) continued its lackluster start as a public company.
PICTURED: The Dow Jones Industrial Average held its ground on "Day 2" of a new rally attempt. Provided that the prior session's (Day 1) lows are not undercut the new rally effort will remain intact. Ideally, a follow-through day between Day 4-7 of additional confirming gains of +1.4% or greater by at least one of the major averages backed by higher volume, and coupled with an expansion in the number of stocks hitting new highs, would confirm a new rally. Meanwhile, investors should keep up a watchlist of worthy buy candidates while remaining protective of capital. Remember, one day of gains does not change the fact that the major averages (M criteria) are technically still in an ugly "correction" and stocks are vulnerable to much greater downside.
|
 Kenneth J. Gruneisen started out as a licensed stockbroker in August 1987, a couple of months prior to the historic stock market crash that took the Dow Jones Industrial Average down -22.6% in a single day. He has published daily fact-based fundamental and technical analysis on high-ranked stocks online for two decades. Through FACTBASEDINVESTING.COM, Kenneth provides educational articles, news, market commentary, and other information regarding proven investment systems that work in good times and bad.
Comments contained in the body of this report are technical opinions only and are not necessarily those of Gruneisen Growth Corp. The material herein has been obtained from sources believed to be reliable and accurate, however, its accuracy and completeness cannot be guaranteed. Our firm, employees, and customers may effect transactions, including transactions contrary to any recommendation herein, or have positions in the securities mentioned herein or options with respect thereto. Any recommendation contained in this report may not be suitable for all investors and it is not to be deemed an offer or solicitation on our part with respect to the purchase or sale of any securities. |
|
 |
Bank and Retail Indexes' Gains Offset by Broader Losses
Kenneth J. Gruneisen - Passed the CAN SLIM® Master's Exam
The Bank Index ($BKX +1.13%) was a positive influence on the major averages and the Retail Index ($RLX +0.32%) posted a small gain, but the Broker/Dealer Index ($XBD -0.10%) edged lower. Commodity-linked groups were the session's worst laggards as they backpedaled on Tuesday and the Gold & Silver Index ($XAU -1.05%), Oil Services Index ($OSX -0.57%), and Integrated Oil Index ($XOI -0.41%) suffered modest losses. Small losses for the Semiconductor Index ($SOX -0.77%), Internet Index ($IIX -0.49%), and Biotechnology Index ($BTK -0.45%) led the tech sector lower while the Networking Index ($NWX -0.09%) finished the day nearly unchanged. The Healthcare Index ($HMO -0.40%) also drifted lower.
Charts courtesy www.stockcharts.com
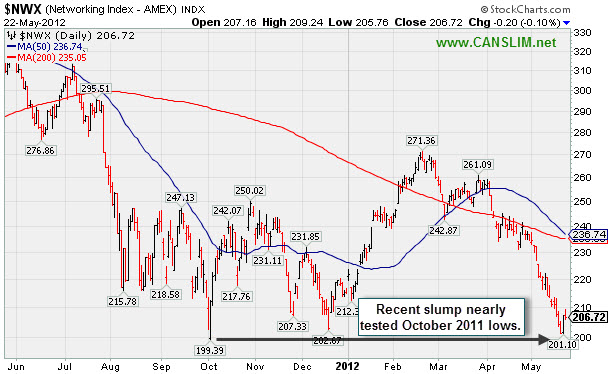
PICTURED: The Networking Index's ($NWX -0.09%) recent slump nearly tested its October 2011 lows.
| Oil Services |
$OSX |
206.96 |
-1.18 |
-0.57% |
-4.31% |
| Healthcare |
$HMO |
2,255.96 |
-9.14 |
-0.40% |
-1.12% |
| Integrated Oil |
$XOI |
1,119.27 |
-4.57 |
-0.41% |
-8.94% |
| Semiconductor |
$SOX |
370.98 |
-2.87 |
-0.77% |
+1.79% |
| Networking |
$NWX |
206.73 |
-0.18 |
-0.09% |
-3.92% |
| Internet |
$IIX |
298.55 |
-1.48 |
-0.49% |
+5.97% |
| Broker/Dealer |
$XBD |
86.45 |
-0.09 |
-0.10% |
+3.81% |
| Retail |
$RLX |
597.28 |
+1.91 |
+0.32% |
+14.16% |
| Gold & Silver |
$XAU |
150.78 |
-1.60 |
-1.05% |
-16.53% |
| Bank |
$BKX |
43.82 |
+0.49 |
+1.13% |
+11.27% |
| Biotech |
$BTK |
1,456.00 |
-6.52 |
-0.45% |
+33.40% |
|
|
|
 |
200-Day Moving Average Acting as Support After Breakout Was Negated
Kenneth J. Gruneisen - Passed the CAN SLIM® Master's Exam
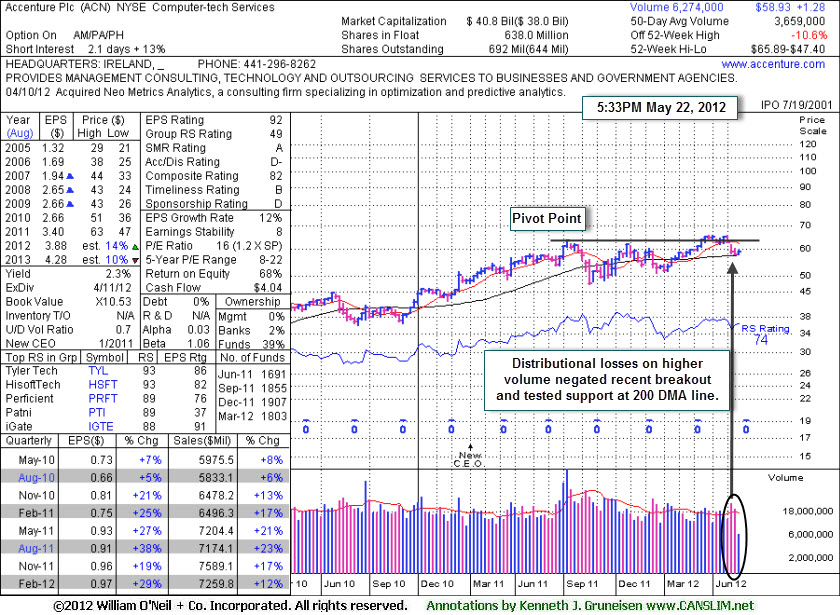
Accenture, Ltd. (ACN -$0.14 or -0.24% to $58.93) recently bounced from support at its longer-term 200-day moving average (DMA) line. It had triggered technical sell signals with its recent losses undercutting prior highs in the $62-63 area and violating its 50 DMA line. It was last shown in this FSU section with an annotated graph on 3/23/12 under the headline, "Gain for New High on +88% Above Average Volume Clears 6 Month Base", as it rallied into new all-time high territory. Technically, it was described then as - "A bit extended after breaking out from an earlier base on 3/05/12, yet its color code was changed to yellow in the mid-day report (read here) with a pivot point cited based on its 7/07/11 high plus 10 cents. Its convincing finish with volume-driven gain above the pivot point was backed by +88% above average volume on Friday clinched a new (or add-on) technical buy signal."
It reported earnings +29% on +12% sales revenues for the quarter ended February 29, 2012 versus the year ago period. In 3 of the 4 most recent quarterly comparisons it showed encouraging earnings increases above the +25% minimum guideline, however sales revenues increases have shown recent deceleration, up +23%, +17%, and +12% in the latest period. Its annual earnings (A criteria) growth history has been good. Increasing ownership by top-rated funds (I criteria) is reassuring, however it is already heavily owned by the institutional crowd. The number of top-rated funds owning its shares rose from 1,691 in Jun '11 to 1.907 in Dec '11, however that total fell to 1,803 in Mar '12, a disconcerting sign concerning the I criteria. Its Up/Down Volume Ratio of 0.7 also is an unbiased indication that it has encountered distributional pressure in the past 50 days. The Computer - Tech Services group's Group RS Rating has slumped to a mediocre 49, however there are still some strong acting leaders in the group that offer some reassurance concerning the L criteria.
|
|
|
Color Codes Explained :
Y - Better candidates highlighted by our
staff of experts.
G - Previously featured
in past reports as yellow but may no longer be buyable under the
guidelines.
***Last / Change / Volume data in this table is the closing quote data***
Symbol/Exchange
Company Name
Industry Group |
PRICE |
CHANGE
(%Change) |
Day High |
Volume
(% DAV)
(% 50 day avg vol) |
52 Wk Hi
% From Hi |
Featured
Date |
Price
Featured |
Pivot Featured |
|
Max Buy |
ACN
-
NYSE
Accenture Plc
DIVERSIFIED SERVICES - Business/Management Services
|
$58.93
|
-0.14
-0.24% |
$59.65
|
3,101,779
84.77% of 50 DAV
50 DAV is 3,659,000
|
$65.89
-10.56%
|
3/23/2012
|
$64.13
|
PP = $63.76
|
|
MB = $66.95
|
 Most Recent Note - 5/22/2012 5:48:52 PM
G - Bounced from support at its longer-term 200 DMA line. Triggered technical sell signals with its recent losses undercutting prior highs in the $62-63 area and violating its 50 DMA line. See the latest FSU analysis for more details and a new annotated weekly graph.
>>> The latest Featured Stock Update with an annotated graph appeared on 5/22/2012. Click here.
View all notes |
Alert me of new notes |
CANSLIM.net Company Profile |
SEC |
Zacks Reports |
StockTalk |
News |
Chart |
Request a new note
C
A N
S L
I M


|
ALXN
-
NASDAQ
Alexion Pharmaceuticals
DRUGS - Drug Manufacturers - Other
|
$92.54
|
+3.78
4.26% |
$94.36
|
5,568,837
432.93% of 50 DAV
50 DAV is 1,286,300
|
$95.01
-2.60%
|
5/1/2012
|
$91.73
|
PP = $95.11
|
|
MB = $99.87
|
Most Recent Note - 5/22/2012 11:56:08 AM
G - Today's impressive gap up gain above its 50 DMA line helped its technical stance and outlook improve. At the close of trading Thursday, Alexion will replace Motorola Mobility Holdings Inc in the S&P 500 Index. Recent lows define near-term chart support well above its 200 DMA line.
>>> The latest Featured Stock Update with an annotated graph appeared on 4/16/2012. Click here.
View all notes |
Alert me of new notes |
CANSLIM.net Company Profile |
SEC |
Zacks Reports |
StockTalk |
News |
Chart |
Request a new note
C
A N
S L
I M
|
ARBA
-
NASDAQ
Ariba Inc
INTERNET - Internet Software and Services
|
$44.87
|
+7.23
19.21% |
$45.48
|
18,324,681
1,833.57% of 50 DAV
50 DAV is 999,400
|
$40.45
10.93%
|
4/27/2012
|
$38.53
|
PP = $37.24
|
|
MB = $39.10
|
Most Recent Note - 5/22/2012 4:25:08 PM
G - Considerable gain today on heavy volume, blasting above its "max buy" level on news it will be bought by SAP in a $4.3 billion deal. Color code is changed to green.
>>> The latest Featured Stock Update with an annotated graph appeared on 4/30/2012. Click here.
View all notes |
Alert me of new notes |
CANSLIM.net Company Profile |
SEC |
Zacks Reports |
StockTalk |
News |
Chart |
Request a new note
C
A N
S L
I M
|
CERN
-
NASDAQ
Cerner Corp
COMPUTER SOFTWARE and SERVICES - Healthcare Information Service
|
$79.11
|
+0.89
1.14% |
$79.68
|
1,263,249
106.90% of 50 DAV
50 DAV is 1,181,700
|
$84.10
-5.93%
|
4/27/2012
|
$77.23
|
PP = $78.63
|
|
MB = $82.56
|
Most Recent Note - 5/21/2012 4:37:40 PM
Y - Color code is changed to yellow after above average volume behind today's gain was a sign of prompt support near its 50 DMA line. Its prior loss had negated its recent technical breakout. Market weakness (M criteria) is an overriding concern that argues against new buying efforts until a new confirmed rally with a follow-through day by at least one of the major averages.
>>> The latest Featured Stock Update with an annotated graph appeared on 5/1/2012. Click here.
View all notes |
Alert me of new notes |
CANSLIM.net Company Profile |
SEC |
Zacks Reports |
StockTalk |
News |
Chart |
Request a new note
C
A N
S L
I M
|
CMCSA
-
NASDAQ
Comcast Corp Cl A
MEDIA - CATV Systems
|
$28.96
|
+0.25
0.87% |
$29.12
|
11,938,862
94.28% of 50 DAV
50 DAV is 12,662,800
|
$30.88
-6.20%
|
5/2/2012
|
$30.04
|
PP = $30.51
|
|
MB = $32.04
|
Most Recent Note - 5/21/2012 4:39:56 PM
G - Posted a gain today with lighter volume. Color code was changed to green after slumping under its 50 DMA line, and last week it also undercut the prior low ($28.54 on 4/10/12) triggering a more worrisome technical sell signal.
>>> The latest Featured Stock Update with an annotated graph appeared on 5/7/2012. Click here.
View all notes |
Alert me of new notes |
CANSLIM.net Company Profile |
SEC |
Zacks Reports |
StockTalk |
News |
Chart |
Request a new note
C
A N
S L
I M
|
Symbol/Exchange
Company Name
Industry Group |
PRICE |
CHANGE
(%Change) |
Day High |
Volume
(% DAV)
(% 50 day avg vol) |
52 Wk Hi
% From Hi |
Featured
Date |
Price
Featured |
Pivot Featured |
|
Max Buy |
COO
-
NYSE
Cooper Companies Inc
HEALTH SERVICES - Medical Instruments and Supplies
|
$85.87
|
-0.45
-0.52% |
$87.42
|
258,426
61.12% of 50 DAV
50 DAV is 422,800
|
$89.31
-3.85%
|
3/9/2012
|
$83.05
|
PP = $81.02
|
|
MB = $85.07
|
Most Recent Note - 5/21/2012 12:27:30 PM
G - Trading up today following a streak of 6 consecutive losses. Consolidating above prior highs in the $83-84 area and its 50 DMA line, important near-term support. A subsequent violation may trigger a worrisome sell signal.
>>> The latest Featured Stock Update with an annotated graph appeared on 5/18/2012. Click here.
View all notes |
Alert me of new notes |
CANSLIM.net Company Profile |
SEC |
Zacks Reports |
StockTalk |
News |
Chart |
Request a new note
C
A N
S L
I M
|
DG
-
NYSE
Dollar General Corp
RETAIL - Discount, Variety Stores
|
$45.90
|
-0.45
-0.97% |
$46.73
|
2,129,360
79.96% of 50 DAV
50 DAV is 2,663,000
|
$48.76
-5.87%
|
5/7/2012
|
$48.51
|
PP = $47.69
|
|
MB = $50.07
|
Most Recent Note - 5/22/2012 4:36:05 PM
G - Down today average volume, encountering resistance at its 50 DMA line. Recent violation of that important short-term average triggered a technical sell signal and its color code was changed to green. It has encountered recent distributional pressure while market conditions (M criteria) turned for the worse.
>>> The latest Featured Stock Update with an annotated graph appeared on 5/9/2012. Click here.
View all notes |
Alert me of new notes |
CANSLIM.net Company Profile |
SEC |
Zacks Reports |
StockTalk |
News |
Chart |
Request a new note
C
A N
S L
I M
|
EXPE
-
NASDAQ
Expedia Inc
INTERNET - Internet Information Providers
|
$42.71
|
+0.36
0.85% |
$43.21
|
2,872,915
65.83% of 50 DAV
50 DAV is 4,363,900
|
$43.92
-2.76%
|
4/27/2012
|
$41.80
|
PP = $35.57
|
|
MB = $37.35
|
Most Recent Note - 5/21/2012 4:57:04 PM
G - Up today with light volume. Volume totals have been cooling while consolidating in a tight range for the past few weeks following its previously noted "breakaway gap".
>>> The latest Featured Stock Update with an annotated graph appeared on 5/3/2012. Click here.
View all notes |
Alert me of new notes |
CANSLIM.net Company Profile |
SEC |
Zacks Reports |
StockTalk |
News |
Chart |
Request a new note
C
A N
S L
I M
|
GNC
-
NYSE
G N C Holdings Inc
RETAIL - Drug Stores
|
$37.50
|
-0.58
-1.52% |
$38.86
|
1,921,702
88.82% of 50 DAV
50 DAV is 2,163,700
|
$41.95
-10.61%
|
1/19/2012
|
$28.99
|
PP = $29.60
|
|
MB = $31.08
|
Most Recent Note - 5/21/2012 4:59:01 PM
G - Found support near prior highs and its 50 DMA line while consolidating. Reported earnings +82% on +23% sales revenues for the quarter ended March 31, 2012 versus the year ago period.
>>> The latest Featured Stock Update with an annotated graph appeared on 4/26/2012. Click here.
View all notes |
Alert me of new notes |
CANSLIM.net Company Profile |
SEC |
Zacks Reports |
StockTalk |
News |
Chart |
Request a new note
C
A N
S L
I M
|
MG
-
NYSE
Mistras Group Inc
DIVERSIFIED SERVICES - Bulding and Faci;ity Management Services
|
$23.85
|
+0.07
0.29% |
$24.00
|
62,389
61.17% of 50 DAV
50 DAV is 102,000
|
$26.24
-9.11%
|
3/22/2012
|
$24.96
|
PP = $26.34
|
|
MB = $27.66
|
Most Recent Note - 5/21/2012 5:00:15 PM
G - Still consolidating in a tight trading range near its 50 DMA line. For more than a month it has been holding its ground above its 200 DMA line. Previously noted - "A volume-driven gain above its recent chart high ($25.49 on 3/21/12) may help trigger a proper technical buy signal after a new base formation, however no new (lower) pivot point is currently being cited, and it may continue encountering stubborn resistance."
>>> The latest Featured Stock Update with an annotated graph appeared on 4/2/2012. Click here.
View all notes |
Alert me of new notes |
CANSLIM.net Company Profile |
SEC |
Zacks Reports |
StockTalk |
News |
Chart |
Request a new note
C
A N
S L
I M
|
Symbol/Exchange
Company Name
Industry Group |
PRICE |
CHANGE
(%Change) |
Day High |
Volume
(% DAV)
(% 50 day avg vol) |
52 Wk Hi
% From Hi |
Featured
Date |
Price
Featured |
Pivot Featured |
|
Max Buy |
NTES
-
NASDAQ
Netease Inc Adr
INTERNET - Internet Information Providers
|
$59.45
|
+0.88
1.50% |
$60.06
|
1,224,986
170.37% of 50 DAV
50 DAV is 719,000
|
$63.07
-5.74%
|
3/19/2012
|
$56.18
|
PP = $55.10
|
|
MB = $57.86
|
Most Recent Note - 5/22/2012 12:16:31 PM
G - Found support above its 50 DMA line after 2 losing sessions with above average volume since its big volume-driven gain on 5/17/12 for a new 52-week high. It had not formed a sound base pattern, however no overhead supply remains to act as resistance. Reported earnings +33% on +36% sales revenues for the quarter ended March 31, 2012 versus the year ago period and it received an analyst upgrade. Recent lows near the $55 area define important chart support to watch.
>>> The latest Featured Stock Update with an annotated graph appeared on 3/27/2012. Click here.
View all notes |
Alert me of new notes |
CANSLIM.net Company Profile |
SEC |
Zacks Reports |
StockTalk |
News |
Chart |
Request a new note
C
A N
S L
I M
|
SWI
-
NYSE
Solarwinds Inc
COMPUTER SOFTWARE and SERVICES - Application Software
|
$45.48
|
-0.46
-1.00% |
$46.91
|
1,380,175
125.02% of 50 DAV
50 DAV is 1,104,000
|
$47.66
-4.57%
|
4/26/2012
|
$45.15
|
PP = $42.32
|
|
MB = $44.44
|
Most Recent Note - 5/21/2012 7:08:21 PM
G - Finished near the session high today with a gain on light volume. Consolidating above prior highs since it was featured again on 4/26/12 following a considerable gap up gain on heavy volume. See latest FSU analysis for more details and a new annotated graph.
>>> The latest Featured Stock Update with an annotated graph appeared on 5/21/2012. Click here.
View all notes |
Alert me of new notes |
CANSLIM.net Company Profile |
SEC |
Zacks Reports |
StockTalk |
News |
Chart |
Request a new note
C
A N
S L
I M
|
SXCI
-
NASDAQ
S X C Health Solutions
COMPUTER SOFTWARE and SERVICES - Healthcare Information Service
|
$90.14
|
-0.08
-0.09% |
$94.70
|
1,099,321
101.39% of 50 DAV
50 DAV is 1,084,300
|
$100.50
-10.31%
|
2/23/2012
|
$68.24
|
PP = $66.05
|
|
MB = $69.35
|
Most Recent Note - 5/22/2012 4:32:09 PM
G - Reversed early gains today and closed near the session low with a small loss on higher (near average) volume. Still holding its ground in a tight range after pricing a new Public Offering last week. Consolidating in a tight range since it posted huge volume-driven gains on 4/18 and 4/19 while rallying on M&A news.
>>> The latest Featured Stock Update with an annotated graph appeared on 5/17/2012. Click here.
View all notes |
Alert me of new notes |
CANSLIM.net Company Profile |
SEC |
Zacks Reports |
StockTalk |
News |
Chart |
Request a new note
C
A N
S L
I M
|
TDG
-
NYSE
Transdigm Group Inc
AEROSPACE/DEFENSE - Aerospace/Defense Products and; Services
|
$125.34
|
+2.72
2.22% |
$125.95
|
593,785
125.48% of 50 DAV
50 DAV is 473,200
|
$132.69
-5.54%
|
2/29/2012
|
$120.10
|
PP = $118.93
|
|
MB = $124.88
|
Most Recent Note - 5/22/2012 4:27:33 PM
G - Two solid gains backed by above average volume were a sign of prompt support at its 50 DMA line and near prior highs which also define important chart support. Poor market conditions (M criteria) argue against making any new buying efforts until a new confirmed rally by at least one of the major averages with a solid follow-through day.
>>> The latest Featured Stock Update with an annotated graph appeared on 3/30/2012. Click here.
View all notes |
Alert me of new notes |
CANSLIM.net Company Profile |
SEC |
Zacks Reports |
StockTalk |
News |
Chart |
Request a new note
C
A N
S L
I M
|
TNGO
-
NASDAQ
Tangoe Inc
COMPUTER SOFTWARE and SERVICES - Technical and System Software
|
$21.50
|
+0.30
1.42% |
$21.77
|
504,212
76.31% of 50 DAV
50 DAV is 660,700
|
$23.05
-6.72%
|
3/27/2012
|
$19.35
|
PP = $20.00
|
|
MB = $21.00
|
Most Recent Note - 5/21/2012 4:45:48 PM
G - Volume totals have been cooling while consolidating above prior highs in the $20 area and above important support at its 50 DMA line. Broader market conditions (M criteria) argue against new buying efforts until a new confirmed rally with follow-through day.
>>> The latest Featured Stock Update with an annotated graph appeared on 4/3/2012. Click here.
View all notes |
Alert me of new notes |
CANSLIM.net Company Profile |
SEC |
Zacks Reports |
StockTalk |
News |
Chart |
Request a new note
C
A N
S L
I M
|
Symbol/Exchange
Company Name
Industry Group |
PRICE |
CHANGE
(%Change) |
Day High |
Volume
(% DAV)
(% 50 day avg vol) |
52 Wk Hi
% From Hi |
Featured
Date |
Price
Featured |
Pivot Featured |
|
Max Buy |
TSCO
-
NASDAQ
Tractor Supply Co
SPECIALTY RETAIL - Specialty Retail, Other
|
$96.78
|
+2.90
3.09% |
$97.39
|
961,503
109.31% of 50 DAV
50 DAV is 879,600
|
$101.20
-4.37%
|
5/1/2012
|
$98.38
|
PP = $101.30
|
|
MB = $106.37
|
Most Recent Note - 5/22/2012 4:29:33 PM
G - Promptly rebounded above its 50 DMA line today with a gain backed near average volume. It did not trigger a new (or add-on) technical buy signal in recent weeks. Market conditions (M criteria) argue against new buying efforts until a new confirmed rally with a solid follow-through day by at least one of the major averages.
>>> The latest Featured Stock Update with an annotated graph appeared on 4/17/2012. Click here.
View all notes |
Alert me of new notes |
CANSLIM.net Company Profile |
SEC |
Zacks Reports |
StockTalk |
News |
Chart |
Request a new note
C
A N
S L
I M
|
UA
-
NYSE
Under Armour Inc Cl A
CONSUMER NON-DURABLES - Textile - Apparel Clothing
|
$94.36
|
+1.15
1.23% |
$95.19
|
607,422
64.20% of 50 DAV
50 DAV is 946,200
|
$102.86
-8.26%
|
2/15/2012
|
$85.77
|
PP = $84.86
|
|
MB = $89.10
|
Most Recent Note - 5/21/2012 4:48:25 PM
G - Posted a gain and finished near the session high today but volume was lighter than average. Concerns were recently raised by weaker fundamentals, its first quarterly earnings increase below the +25% minimum guideline in more than 2 years.
>>> The latest Featured Stock Update with an annotated graph appeared on 4/4/2012. Click here.
View all notes |
Alert me of new notes |
CANSLIM.net Company Profile |
SEC |
Zacks Reports |
StockTalk |
News |
Chart |
Request a new note
C
A N
S L
I M
|
V
-
NYSE
Visa Inc Cl A
DIVERSIFIED SERVICES - Business/Management Services
|
$118.39
|
+2.17
1.87% |
$119.25
|
4,647,763
130.88% of 50 DAV
50 DAV is 3,551,100
|
$125.35
-5.55%
|
3/12/2012
|
$116.53
|
PP = $119.46
|
|
MB = $125.43
|
Most Recent Note - 5/21/2012 4:51:13 PM
G - Up today with lighter volume, rebounding toward it 50 DMA line which has acted as a resistance level after the technical violation on 5/03/12. The longer it lingers below its 50 DMA line the worse its outlook becomes.
>>> The latest Featured Stock Update with an annotated graph appeared on 5/16/2012. Click here.
View all notes |
Alert me of new notes |
CANSLIM.net Company Profile |
SEC |
Zacks Reports |
StockTalk |
News |
Chart |
Request a new note
C
A N
S L
I M
|
VSI
-
NYSE
Vitamin Shoppe Inc
SPECIALTY RETAIL - Specialty Retail, Other
|
$49.57
|
-0.28
-0.56% |
$50.34
|
254,661
53.83% of 50 DAV
50 DAV is 473,100
|
$55.29
-10.35%
|
4/25/2012
|
$47.77
|
PP = $48.46
|
|
MB = $50.88
|
Most Recent Note - 5/21/2012 4:52:57 PM
G - Gain today was backed by lighter than average volume as it found some support near its old highs and halted a streak of 5 consecutive losses since a negative reversal at its 52-week high. It has slumped below its "max buy" level, however broader market weakness (M criteria) is an overriding concern which argues against any new buying efforts until a new rally is confirmed with a solid follow-through day by at least one of the major averages.
>>> The latest Featured Stock Update with an annotated graph appeared on 4/25/2012. Click here.
View all notes |
Alert me of new notes |
CANSLIM.net Company Profile |
SEC |
Zacks Reports |
StockTalk |
News |
Chart |
Request a new note
C
A N
S L
I M
|
WFM
-
NASDAQ
Whole Foods Market Inc
RETAIL - Grocery Stores
|
$86.89
|
+1.26
1.47% |
$87.64
|
2,238,632
140.65% of 50 DAV
50 DAV is 1,591,600
|
$91.50
-5.04%
|
5/3/2012
|
$90.28
|
PP = $86.45
|
|
MB = $90.77
|
Most Recent Note - 5/21/2012 4:55:02 PM
G - Gain today with slightly higher above average volume was a sign of prompt support as it rebounded above its 50 DMA line following a streak of 5 consecutive losses which completely negated the latest breakout. It stalled following its considerable "breakaway gap" on 5/03/12, meanwhile the broader market (M criteria) fell into the latest correction.
>>> The latest Featured Stock Update with an annotated graph appeared on 5/11/2012. Click here.
View all notes |
Alert me of new notes |
CANSLIM.net Company Profile |
SEC |
Zacks Reports |
StockTalk |
News |
Chart |
Request a new note
C
A N
S L
I M
|
Symbol/Exchange
Company Name
Industry Group |
PRICE |
CHANGE
(%Change) |
Day High |
Volume
(% DAV)
(% 50 day avg vol) |
52 Wk Hi
% From Hi |
Featured
Date |
Price
Featured |
Pivot Featured |
|
Max Buy |
|
|
|
THESE ARE NOT BUY RECOMMENDATIONS!
Comments contained in the body of this report are technical
opinions only. The material herein has been obtained
from sources believed to be reliable and accurate, however,
its accuracy and completeness cannot be guaranteed.
This site is not an investment advisor, hence it does
not endorse or recommend any securities or other investments.
Any recommendation contained in this report may not
be suitable for all investors and it is not to be deemed
an offer or solicitation on our part with respect to
the purchase or sale of any securities. All trademarks,
service marks and trade names appearing in this report
are the property of their respective owners, and are
likewise used for identification purposes only.
This report is a service available
only to active Paid Premium Members.
You may opt-out of receiving report notifications
at any time. Questions or comments may be submitted
by writing to Premium Membership Services 665 S.E. 10 Street, Suite 201 Deerfield Beach, FL 33441-5634 or by calling 1-800-965-8307
or 954-785-1121.
|
|
|

