Symbol/Exchange
Company Name
Industry Group |
PRICE |
CHANGE
(%Change) |
Day High |
Volume
(% DAV)
(% 50 day avg vol) |
52 Wk Hi
% From Hi |
Featured
Date |
Price
Featured |
Pivot Featured |
|
Max Buy |
ACN
-
NYSE
Accenture Plc
DIVERSIFIED SERVICES - Business/Management Services
|
$59.07
|
+1.42
2.46% |
$59.18
|
3,185,504
87.53% of 50 DAV
50 DAV is 3,639,400
|
$65.89
-10.35%
|
3/23/2012
|
$64.13
|
PP = $63.76
|
|
MB = $66.95
|
 Most Recent Note - 5/21/2012 4:30:15 PM
G - Bounced from support at its 200 DMA line today. Triggered technical sell signals with its recent losses undercutting prior highs in the $62-63 area and violating its 50 DMA line.
>>> The latest Featured Stock Update with an annotated graph appeared on 3/23/2012. Click here.
View all notes |
Alert me of new notes |
CANSLIM.net Company Profile |
SEC |
Zacks Reports |
StockTalk |
News |
Chart |
Request a new note
C
A N
S L
I M


|
ADS
-
NYSE
Alliance Data Sys Corp
COMPUTER SOFTWARE and SERVICES - Information and Delivery Service
|
$122.04
|
+0.79
0.65% |
$122.54
|
829,361
147.84% of 50 DAV
50 DAV is 561,000
|
$130.66
-6.60%
|
1/17/2012
|
$108.24
|
PP = $107.43
|
|
MB = $112.80
|
Most Recent Note - 5/21/2012 4:32:46 PM
Managed a positive reversal today with a gain on above average volume. Last week's losses under its 50 DMA line and the prior low ($122.70 on 5/09/12) completed a bearish head-and-shoulders pattern and triggered a worrisome technical sell signal. Sub par earnings increases in the 2 latest quarterly reports (Dec '11 and Mar '12) raised fundamental concerns. Based on fundamental and technical deterioration it will be dropped from the Featured Stocks list tonight.
>>> The latest Featured Stock Update with an annotated graph appeared on 4/24/2012. Click here.
View all notes |
Alert me of new notes |
CANSLIM.net Company Profile |
SEC |
Zacks Reports |
StockTalk |
News |
Chart |
Request a new note
C
A N
S L
I M
|
ALXN
-
NASDAQ
Alexion Pharmaceuticals
DRUGS - Drug Manufacturers - Other
|
$88.76
|
+4.50
5.34% |
$89.17
|
1,716,456
134.85% of 50 DAV
50 DAV is 1,272,900
|
$95.01
-6.58%
|
5/1/2012
|
$91.73
|
PP = $95.11
|
|
MB = $99.87
|
Most Recent Note - 5/21/2012 4:34:03 PM
G - Today's gain with above average volume helped it rally near its 50 DMA line which may now act as a resistance level. A rebound above its 50 DMA line is needed for its outlook to improve. Meanwhile its recent low ($81.28 on 5/07/12) defines the only near-term chart support level above its 200 DMA line.
>>> The latest Featured Stock Update with an annotated graph appeared on 4/16/2012. Click here.
View all notes |
Alert me of new notes |
CANSLIM.net Company Profile |
SEC |
Zacks Reports |
StockTalk |
News |
Chart |
Request a new note
C
A N
S L
I M
|
ARBA
-
NASDAQ
Ariba Inc
INTERNET - Internet Software and Services
|
$37.64
|
+1.54
4.27% |
$37.67
|
902,822
90.96% of 50 DAV
50 DAV is 992,600
|
$40.45
-6.95%
|
4/27/2012
|
$38.53
|
PP = $37.24
|
|
MB = $39.10
|
Most Recent Note - 5/21/2012 4:35:53 PM
Y - Closed near the session high with a considerable gain today on lighter volume, rebounding back above its pivot point. Important near-term support to watch is at prior highs in the $35-37 area and its 50 DMA line.
>>> The latest Featured Stock Update with an annotated graph appeared on 4/30/2012. Click here.
View all notes |
Alert me of new notes |
CANSLIM.net Company Profile |
SEC |
Zacks Reports |
StockTalk |
News |
Chart |
Request a new note
C
A N
S L
I M
|
CERN
-
NASDAQ
Cerner Corp
COMPUTER SOFTWARE and SERVICES - Healthcare Information Service
|
$78.22
|
+1.74
2.28% |
$78.49
|
1,690,301
144.13% of 50 DAV
50 DAV is 1,172,800
|
$84.10
-6.99%
|
4/27/2012
|
$77.23
|
PP = $78.63
|
|
MB = $82.56
|
Most Recent Note - 5/21/2012 4:37:40 PM
Y - Color code is changed to yellow after above average volume behind today's gain was a sign of prompt support near its 50 DMA line. Its prior loss had negated its recent technical breakout. Market weakness (M criteria) is an overriding concern that argues against new buying efforts until a new confirmed rally with a follow-through day by at least one of the major averages.
>>> The latest Featured Stock Update with an annotated graph appeared on 5/1/2012. Click here.
View all notes |
Alert me of new notes |
CANSLIM.net Company Profile |
SEC |
Zacks Reports |
StockTalk |
News |
Chart |
Request a new note
C
A N
S L
I M
|
Symbol/Exchange
Company Name
Industry Group |
PRICE |
CHANGE
(%Change) |
Day High |
Volume
(% DAV)
(% 50 day avg vol) |
52 Wk Hi
% From Hi |
Featured
Date |
Price
Featured |
Pivot Featured |
|
Max Buy |
CMCSA
-
NASDAQ
Comcast Corp Cl A
MEDIA - CATV Systems
|
$28.71
|
+0.44
1.54% |
$28.75
|
10,508,050
83.16% of 50 DAV
50 DAV is 12,635,400
|
$30.88
-7.01%
|
5/2/2012
|
$30.04
|
PP = $30.51
|
|
MB = $32.04
|
Most Recent Note - 5/21/2012 4:39:56 PM
G - Posted a gain today with lighter volume. Color code was changed to green after slumping under its 50 DMA line, and last week it also undercut the prior low ($28.54 on 4/10/12) triggering a more worrisome technical sell signal.
>>> The latest Featured Stock Update with an annotated graph appeared on 5/7/2012. Click here.
View all notes |
Alert me of new notes |
CANSLIM.net Company Profile |
SEC |
Zacks Reports |
StockTalk |
News |
Chart |
Request a new note
C
A N
S L
I M
|
COO
-
NYSE
Cooper Companies Inc
HEALTH SERVICES - Medical Instruments and Supplies
|
$86.32
|
+1.35
1.59% |
$86.60
|
454,744
102.70% of 50 DAV
50 DAV is 442,800
|
$89.31
-3.35%
|
3/9/2012
|
$83.05
|
PP = $81.02
|
|
MB = $85.07
|
Most Recent Note - 5/21/2012 12:27:30 PM
G - Trading up today following a streak of 6 consecutive losses. Consolidating above prior highs in the $83-84 area and its 50 DMA line, important near-term support. A subsequent violation may trigger a worrisome sell signal.
>>> The latest Featured Stock Update with an annotated graph appeared on 5/18/2012. Click here.
View all notes |
Alert me of new notes |
CANSLIM.net Company Profile |
SEC |
Zacks Reports |
StockTalk |
News |
Chart |
Request a new note
C
A N
S L
I M
|
DG
-
NYSE
Dollar General Corp
RETAIL - Discount, Variety Stores
|
$46.35
|
+0.70
1.53% |
$46.50
|
2,603,274
98.43% of 50 DAV
50 DAV is 2,644,700
|
$48.76
-4.94%
|
5/7/2012
|
$48.51
|
PP = $47.69
|
|
MB = $50.07
|
Most Recent Note - 5/17/2012 5:49:17 PM
G - Down today with above average volume while violating its 50 DMA line triggering a technical sell signal. Color code is changed to green. It has encountered recent distributional pressure while market conditions (M criteria) turned for the worse.
>>> The latest Featured Stock Update with an annotated graph appeared on 5/9/2012. Click here.
View all notes |
Alert me of new notes |
CANSLIM.net Company Profile |
SEC |
Zacks Reports |
StockTalk |
News |
Chart |
Request a new note
C
A N
S L
I M
|
EXPE
-
NASDAQ
Expedia Inc
INTERNET - Internet Information Providers
|
$42.35
|
+1.63
4.00% |
$42.47
|
2,918,718
65.89% of 50 DAV
50 DAV is 4,429,700
|
$43.92
-3.57%
|
4/27/2012
|
$41.80
|
PP = $35.57
|
|
MB = $37.35
|
Most Recent Note - 5/21/2012 4:57:04 PM
G - Up today with light volume. Volume totals have been cooling while consolidating in a tight range for the past few weeks following its previously noted "breakaway gap".
>>> The latest Featured Stock Update with an annotated graph appeared on 5/3/2012. Click here.
View all notes |
Alert me of new notes |
CANSLIM.net Company Profile |
SEC |
Zacks Reports |
StockTalk |
News |
Chart |
Request a new note
C
A N
S L
I M
|
GNC
-
NYSE
G N C Holdings Inc
RETAIL - Drug Stores
|
$38.08
|
+1.47
4.02% |
$38.08
|
1,257,067
57.91% of 50 DAV
50 DAV is 2,170,900
|
$41.95
-9.23%
|
1/19/2012
|
$28.99
|
PP = $29.60
|
|
MB = $31.08
|
Most Recent Note - 5/21/2012 4:59:01 PM
G - Found support near prior highs and its 50 DMA line while consolidating. Reported earnings +82% on +23% sales revenues for the quarter ended March 31, 2012 versus the year ago period.
>>> The latest Featured Stock Update with an annotated graph appeared on 4/26/2012. Click here.
View all notes |
Alert me of new notes |
CANSLIM.net Company Profile |
SEC |
Zacks Reports |
StockTalk |
News |
Chart |
Request a new note
C
A N
S L
I M
|
Symbol/Exchange
Company Name
Industry Group |
PRICE |
CHANGE
(%Change) |
Day High |
Volume
(% DAV)
(% 50 day avg vol) |
52 Wk Hi
% From Hi |
Featured
Date |
Price
Featured |
Pivot Featured |
|
Max Buy |
MG
-
NYSE
Mistras Group Inc
DIVERSIFIED SERVICES - Bulding and Faci;ity Management Services
|
$23.78
|
+0.60
2.59% |
$23.94
|
98,045
95.84% of 50 DAV
50 DAV is 102,300
|
$26.24
-9.38%
|
3/22/2012
|
$24.96
|
PP = $26.34
|
|
MB = $27.66
|
Most Recent Note - 5/21/2012 5:00:15 PM
G - Still consolidating in a tight trading range near its 50 DMA line. For more than a month it has been holding its ground above its 200 DMA line. Previously noted - "A volume-driven gain above its recent chart high ($25.49 on 3/21/12) may help trigger a proper technical buy signal after a new base formation, however no new (lower) pivot point is currently being cited, and it may continue encountering stubborn resistance."
>>> The latest Featured Stock Update with an annotated graph appeared on 4/2/2012. Click here.
View all notes |
Alert me of new notes |
CANSLIM.net Company Profile |
SEC |
Zacks Reports |
StockTalk |
News |
Chart |
Request a new note
C
A N
S L
I M
|
NTES
-
NASDAQ
Netease Inc Adr
INTERNET - Internet Information Providers
|
$58.57
|
-0.27
-0.46% |
$59.32
|
1,292,606
182.37% of 50 DAV
50 DAV is 708,800
|
$63.07
-7.13%
|
3/19/2012
|
$56.18
|
PP = $55.10
|
|
MB = $57.86
|
Most Recent Note - 5/21/2012 12:51:35 PM
G - Pulling back for a second session since a considerable volume-driven gain on 5/17/12 for a new 52-week high. It had not formed a sound base pattern, however no overhead supply remains to act as resistance. Reported earnings +33% on +36% sales revenues for the quarter ended March 31, 2012 versus the year ago period and it received an analyst upgrade. Recent lows near the $55 area define important chart support to watch.
>>> The latest Featured Stock Update with an annotated graph appeared on 3/27/2012. Click here.
View all notes |
Alert me of new notes |
CANSLIM.net Company Profile |
SEC |
Zacks Reports |
StockTalk |
News |
Chart |
Request a new note
C
A N
S L
I M
|
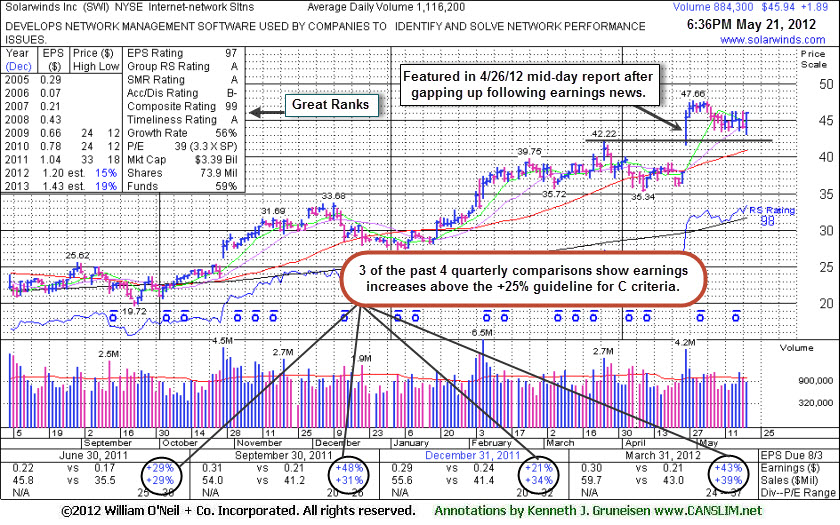
SWI
-
NYSE
Solarwinds Inc
COMPUTER SOFTWARE and SERVICES - Application Software
|
$45.94
|
+1.89
4.29% |
$45.97
|
887,820
79.54% of 50 DAV
50 DAV is 1,116,200
|
$47.66
-3.61%
|
4/26/2012
|
$45.15
|
PP = $42.32
|
|
MB = $44.44
|
Most Recent Note - 5/21/2012 7:08:21 PM
G - Finished near the session high today with a gain on light volume. Consolidating above prior highs since it was featured again on 4/26/12 following a considerable gap up gain on heavy volume. See latest FSU analysis for more details and a new annotated graph.
>>> The latest Featured Stock Update with an annotated graph appeared on 5/21/2012. Click here.
View all notes |
Alert me of new notes |
CANSLIM.net Company Profile |
SEC |
Zacks Reports |
StockTalk |
News |
Chart |
Request a new note
C
A N
S L
I M
|
SXCI
-
NASDAQ
S X C Health Solutions
COMPUTER SOFTWARE and SERVICES - Healthcare Information Service
|
$90.22
|
+1.34
1.51% |
$90.40
|
755,928
69.83% of 50 DAV
50 DAV is 1,082,500
|
$100.50
-10.23%
|
2/23/2012
|
$68.24
|
PP = $66.05
|
|
MB = $69.35
|
Most Recent Note - 5/17/2012 5:28:51 PM
G - Still holding its ground in a tight range after pricing a new Public Offering last week. Consolidating in a tight range since it posted huge volume-driven gains on 4/18 and 4/19 while rallying on M&A news. See latest FSU analysis for more details and a new annotated graph.
>>> The latest Featured Stock Update with an annotated graph appeared on 5/17/2012. Click here.
View all notes |
Alert me of new notes |
CANSLIM.net Company Profile |
SEC |
Zacks Reports |
StockTalk |
News |
Chart |
Request a new note
C
A N
S L
I M
|
TDG
-
NYSE
Transdigm Group Inc
AEROSPACE/DEFENSE - Aerospace/Defense Products and; Services
|
$122.62
|
+3.80
3.20% |
$122.98
|
672,000
144.64% of 50 DAV
50 DAV is 464,600
|
$132.69
-7.59%
|
2/29/2012
|
$120.10
|
PP = $118.93
|
|
MB = $124.88
|
Most Recent Note - 5/21/2012 4:44:57 PM
G - Today's solid gain backed by above average volume was a sign of prompt support at its 50 DMA line and near prior highs which also define important chart support. Poor market conditions (M criteria) argue against making any new buying efforts until a new confirmed rally by at least one of the major averages with a solid follow-through day.
>>> The latest Featured Stock Update with an annotated graph appeared on 3/30/2012. Click here.
View all notes |
Alert me of new notes |
CANSLIM.net Company Profile |
SEC |
Zacks Reports |
StockTalk |
News |
Chart |
Request a new note
C
A N
S L
I M
|
Symbol/Exchange
Company Name
Industry Group |
PRICE |
CHANGE
(%Change) |
Day High |
Volume
(% DAV)
(% 50 day avg vol) |
52 Wk Hi
% From Hi |
Featured
Date |
Price
Featured |
Pivot Featured |
|
Max Buy |
TNGO
-
NASDAQ
Tangoe Inc
COMPUTER SOFTWARE and SERVICES - Technical and System Software
|
$21.20
|
+0.92
4.54% |
$21.52
|
398,980
60.94% of 50 DAV
50 DAV is 654,700
|
$23.05
-8.03%
|
3/27/2012
|
$19.35
|
PP = $20.00
|
|
MB = $21.00
|
Most Recent Note - 5/21/2012 4:45:48 PM
G - Volume totals have been cooling while consolidating above prior highs in the $20 area and above important support at its 50 DMA line. Broader market conditions (M criteria) argue against new buying efforts until a new confirmed rally with follow-through day.
>>> The latest Featured Stock Update with an annotated graph appeared on 4/3/2012. Click here.
View all notes |
Alert me of new notes |
CANSLIM.net Company Profile |
SEC |
Zacks Reports |
StockTalk |
News |
Chart |
Request a new note
C
A N
S L
I M
|
TSCO
-
NASDAQ
Tractor Supply Co
SPECIALTY RETAIL - Specialty Retail, Other
|
$93.88
|
+2.02
2.20% |
$94.04
|
1,277,000
147.63% of 50 DAV
50 DAV is 865,000
|
$101.20
-7.23%
|
5/1/2012
|
$98.38
|
PP = $101.30
|
|
MB = $106.37
|
Most Recent Note - 5/21/2012 4:47:01 PM
G - Rebounded near its 50 DMA line today with a gain backed by above average volume. Damaging losses last week triggered a technical sell signal and its color code was changed to green. It did not trigger a new (or add-on) technical buy signal in recent weeks. Market conditions (M criteria) argue against new buying efforts until a new confirmed rally with a solid follow-through day by at least one of the major averages.
>>> The latest Featured Stock Update with an annotated graph appeared on 4/17/2012. Click here.
View all notes |
Alert me of new notes |
CANSLIM.net Company Profile |
SEC |
Zacks Reports |
StockTalk |
News |
Chart |
Request a new note
C
A N
S L
I M
|
UA
-
NYSE
Under Armour Inc Cl A
CONSUMER NON-DURABLES - Textile - Apparel Clothing
|
$93.21
|
+4.21
4.73% |
$93.46
|
720,519
75.81% of 50 DAV
50 DAV is 950,400
|
$102.86
-9.38%
|
2/15/2012
|
$85.77
|
PP = $84.86
|
|
MB = $89.10
|
Most Recent Note - 5/21/2012 4:48:25 PM
G - Posted a gain and finished near the session high today but volume was lighter than average. Concerns were recently raised by weaker fundamentals, its first quarterly earnings increase below the +25% minimum guideline in more than 2 years.
>>> The latest Featured Stock Update with an annotated graph appeared on 4/4/2012. Click here.
View all notes |
Alert me of new notes |
CANSLIM.net Company Profile |
SEC |
Zacks Reports |
StockTalk |
News |
Chart |
Request a new note
C
A N
S L
I M
|
V
-
NYSE
Visa Inc Cl A
DIVERSIFIED SERVICES - Business/Management Services
|
$116.22
|
+3.58
3.18% |
$116.32
|
3,317,929
94.07% of 50 DAV
50 DAV is 3,527,000
|
$125.35
-7.28%
|
3/12/2012
|
$116.53
|
PP = $119.46
|
|
MB = $125.43
|
Most Recent Note - 5/21/2012 4:51:13 PM
G - Up today with lighter volume, rebounding toward it 50 DMA line which has acted as a resistance level after the technical violation on 5/03/12. The longer it lingers below its 50 DMA line the worse its outlook becomes.
>>> The latest Featured Stock Update with an annotated graph appeared on 5/16/2012. Click here.
View all notes |
Alert me of new notes |
CANSLIM.net Company Profile |
SEC |
Zacks Reports |
StockTalk |
News |
Chart |
Request a new note
C
A N
S L
I M
|
VSI
-
NYSE
Vitamin Shoppe Inc
SPECIALTY RETAIL - Specialty Retail, Other
|
$49.85
|
+1.02
2.09% |
$50.61
|
284,217
59.62% of 50 DAV
50 DAV is 476,700
|
$55.29
-9.84%
|
4/25/2012
|
$47.77
|
PP = $48.46
|
|
MB = $50.88
|
Most Recent Note - 5/21/2012 4:52:57 PM
G - Gain today was backed by lighter than average volume as it found some support near its old highs and halted a streak of 5 consecutive losses since a negative reversal at its 52-week high. It has slumped below its "max buy" level, however broader market weakness (M criteria) is an overriding concern which argues against any new buying efforts until a new rally is confirmed with a solid follow-through day by at least one of the major averages.
>>> The latest Featured Stock Update with an annotated graph appeared on 4/25/2012. Click here.
View all notes |
Alert me of new notes |
CANSLIM.net Company Profile |
SEC |
Zacks Reports |
StockTalk |
News |
Chart |
Request a new note
C
A N
S L
I M
|
Symbol/Exchange
Company Name
Industry Group |
PRICE |
CHANGE
(%Change) |
Day High |
Volume
(% DAV)
(% 50 day avg vol) |
52 Wk Hi
% From Hi |
Featured
Date |
Price
Featured |
Pivot Featured |
|
Max Buy |
WFM
-
NASDAQ
Whole Foods Market Inc
RETAIL - Grocery Stores
|
$85.63
|
+2.58
3.11% |
$85.85
|
1,892,803
120.45% of 50 DAV
50 DAV is 1,571,500
|
$91.50
-6.42%
|
5/3/2012
|
$90.28
|
PP = $86.45
|
|
MB = $90.77
|
Most Recent Note - 5/21/2012 4:55:02 PM
G - Gain today with slightly higher above average volume was a sign of prompt support as it rebounded above its 50 DMA line following a streak of 5 consecutive losses which completely negated the latest breakout. It stalled following its considerable "breakaway gap" on 5/03/12, meanwhile the broader market (M criteria) fell into the latest correction.
>>> The latest Featured Stock Update with an annotated graph appeared on 5/11/2012. Click here.
View all notes |
Alert me of new notes |
CANSLIM.net Company Profile |
SEC |
Zacks Reports |
StockTalk |
News |
Chart |
Request a new note
C
A N
S L
I M
|