You are not logged in.
This means you
CAN ONLY VIEW reports that were published prior to Tuesday, April 15, 2025.
You
MUST UPGRADE YOUR MEMBERSHIP if you want to see any current reports.
AFTER MARKET UPDATE - WEDNESDAY, MAY 23RD, 2012
Previous After Market Report Next After Market Report >>>
|
|
|
|
DOW |
-6.66 |
12,496.15 |
-0.05% |
|
Volume |
863,011,570 |
+2% |
|
Volume |
1,881,807,600 |
+5% |
|
NASDAQ |
+11.04 |
2,850.12 |
+0.39% |
|
Advancers |
1,840 |
58% |
|
Advancers |
1,363 |
52% |
|
S&P 500 |
+2.23 |
1,318.86 |
+0.17% |
|
Decliners |
1,222 |
39% |
|
Decliners |
1,142 |
43% |
|
Russell 2000 |
+5.54 |
765.17 |
+0.73% |
|
52 Wk Highs |
14 |
|
|
52 Wk Highs |
20 |
|
|
S&P 600 |
+2.30 |
430.33 |
+0.54% |
|
52 Wk Lows |
112 |
|
|
52 Wk Lows |
131 |
|
|
 |
Major Averages Still Await Confirming Follow-Though Gains
Kenneth J. Gruneisen - Passed the CAN SLIM® Master's Exam
The Dow Jones Industrial Average undercut its recent low, ending its rally attempt, yet it rebounded to finish near the session high. Meanwhile, the S&P 500 Index and Nasdaq Composite Index both stayed above their "Day 1" lows, and Wednesday's rebound from early losses helped the market's latest rally attempt remain intact. Volume totals were reported higher on the Nasdaq exchange and on the NYSE versus the prior session's totals. Breadth was positive as advancers led decliners by 3-2 on the NYSE, but the lead was narrower on the Nasdaq exchange. New 52-week highs were still outnumbered by new 52-week lows on the NYSE and on the Nasdaq exchange. There were 8 high-ranked companies from the CANSLIM.net Leaders List that made new 52-week highs and appeared on the CANSLIM.net BreakOuts Page, up from the prior session total of 4 stocks. Investors watching for a follow-through day in the days and weeks ahead should be aware that an expansion in the number of stocks hitting new 52-week highs is an important component to any new confirmed rally. There were gains for 13 of the 20 high-ranked companies currently included on the Featured Stocks Page, a list that recently has been shrinking.

The new rally effort still remains intact for the Nasdaq Composite Index, provided that its Day 1 low (2,774.76) is not undercut. Historical studies suggest that the most constructive market rallies produced a solid follow-through day (FTD) between Days 4-7 of a new rally effort. The window is still open for a new confirmed rally to present itself, and such technical proof may give fact-based investors the clearance to begin with new buying efforts only in sound candidates.
The major averages initially declined amid mounting fears Greece may leave the euro as European leaders met in Brussels to discuss the debt crisis. The indices recovered from a sharp sell-off after the Fed's Minneapolis regional president said the central bank has the tools to stem the damage from Europe's debt crisis. Stocks were helped by a report that showed new home sales unexpectedly rose +3.3% last month.
Miners were initially lower in sympathy with declines in metal prices, yet commodity-related stocks led the surge into the close with miners Newmont Mining Corp (NEM +2.92%) and Freeport McMoRan Copper & Gold Inc (FCX +1.97%) rising. Tech was in the red with Dell (DELL -17.18%) trading down sharply after positing disappointing earnings and reducing second quarter revenue guidance. Apple Inc (AAPL +2.44%) gained ground and helped offset the tech weakness, but shares of Hewlett-Packard Co (HPQ -3.21%) also lost ground ahead of its earnings release after the close. Financials finished higher with Bank of America Corp (BAC +2.72%) among the day's best gainers after banks had initially followed European lenders lower. Expedia Inc (EXPE +6.97%) was the biggest gainer in the S&P 500 on a percentage basis. Shares of the online travel services company rose after receiving positive analyst comments.
European markets remained firmly in negative territory on fears over a possible Greek exit from the euro. The FTSE and DAX were both down -1.8% in London and Germany. The 10-year note finish up 1/4 of a point to yield 1.74% after the day's $35 billion auction of 5-year Treasuries.
PICTURED: The S&P 500 Index held its ground on "Day 3" of a new rally attempt after dipping intra-day within 1 point of its 5/21/12 low (1,295.73). The major averages (M criteria) are technically still considered to be in a "correction" and stocks remain vulnerable to much greater downside. Provided that the Day 1 lows are not undercut the new rally effort will remain intact. Ideally, a follow-through day (FTD) between Day 4-7 of additional confirming gains of +1.4% or greater by at least one of the major averages backed by higher volume, and coupled with an expansion in the number of stocks hitting new highs, would "confirm" a new rally. Meanwhile, investors should keep up a watchlist of worthy buy candidates while remaining protective of capital.
|
 Kenneth J. Gruneisen started out as a licensed stockbroker in August 1987, a couple of months prior to the historic stock market crash that took the Dow Jones Industrial Average down -22.6% in a single day. He has published daily fact-based fundamental and technical analysis on high-ranked stocks online for two decades. Through FACTBASEDINVESTING.COM, Kenneth provides educational articles, news, market commentary, and other information regarding proven investment systems that work in good times and bad.
Comments contained in the body of this report are technical opinions only and are not necessarily those of Gruneisen Growth Corp. The material herein has been obtained from sources believed to be reliable and accurate, however, its accuracy and completeness cannot be guaranteed. Our firm, employees, and customers may effect transactions, including transactions contrary to any recommendation herein, or have positions in the securities mentioned herein or options with respect thereto. Any recommendation contained in this report may not be suitable for all investors and it is not to be deemed an offer or solicitation on our part with respect to the purchase or sale of any securities. |
|
 |
Commodity-Linked Groups Helped Lead Rebound
Kenneth J. Gruneisen - Passed the CAN SLIM® Master's Exam
The Bank Index ($BKX +0.78%) tallied a small gain but the Broker/Dealer Index ($XBD -0.13%) suffered another small loss. The Retail Index ($RLX +1.21%) was also a positive influence on the major averages, and the Oil Services Index ($OSX +1.28%) also traded up, but the Integrated Oil Index ($XOI +0.05%) finished flat. The tech sector saw modest gains from the Semiconductor Index ($SOX +0.36%), Networking Index ($NWX +0.57%), and Internet Index ($IIX +0.91%), meanwhile the Biotechnology Index ($BTK -0.55%) sputtered to a small loss, yet the Healthcare Index ($HMO +0.24%) edged higher.
Charts courtesy www.stockcharts.com
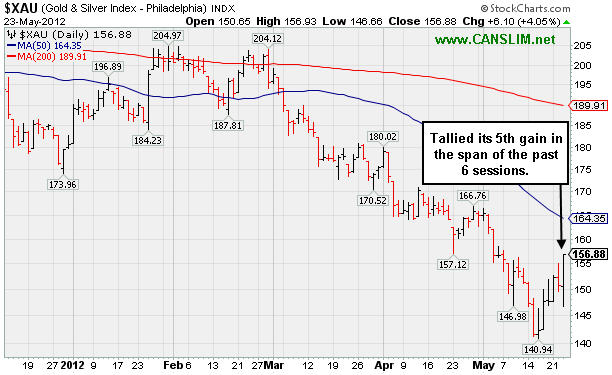
PICTURED: The Gold & Silver Index ($XAU +4.05%) was a standout gainer, bouncing back from a steep sell-off with a solid gain, its 5th gain in the span of 6 trading sessions.
| Oil Services |
$OSX |
209.60 |
+2.64 |
+1.28% |
-3.09% |
| Healthcare |
$HMO |
2,261.35 |
+5.39 |
+0.24% |
-0.89% |
| Integrated Oil |
$XOI |
1,119.81 |
+0.54 |
+0.05% |
-8.89% |
| Semiconductor |
$SOX |
372.33 |
+1.35 |
+0.36% |
+2.16% |
| Networking |
$NWX |
207.92 |
+1.19 |
+0.57% |
-3.37% |
| Internet |
$IIX |
301.27 |
+2.72 |
+0.91% |
+6.93% |
| Broker/Dealer |
$XBD |
86.33 |
-0.11 |
-0.13% |
+3.68% |
| Retail |
$RLX |
604.52 |
+7.24 |
+1.21% |
+15.54% |
| Gold & Silver |
$XAU |
156.88 |
+6.10 |
+4.05% |
-13.15% |
| Bank |
$BKX |
44.16 |
+0.34 |
+0.78% |
+12.14% |
| Biotech |
$BTK |
1,447.95 |
-8.04 |
-0.55% |
+32.67% |
|
|
|
 |
Prior Highs and 50-Day Moving Average Acted as Support
Kenneth J. Gruneisen - Passed the CAN SLIM® Master's Exam
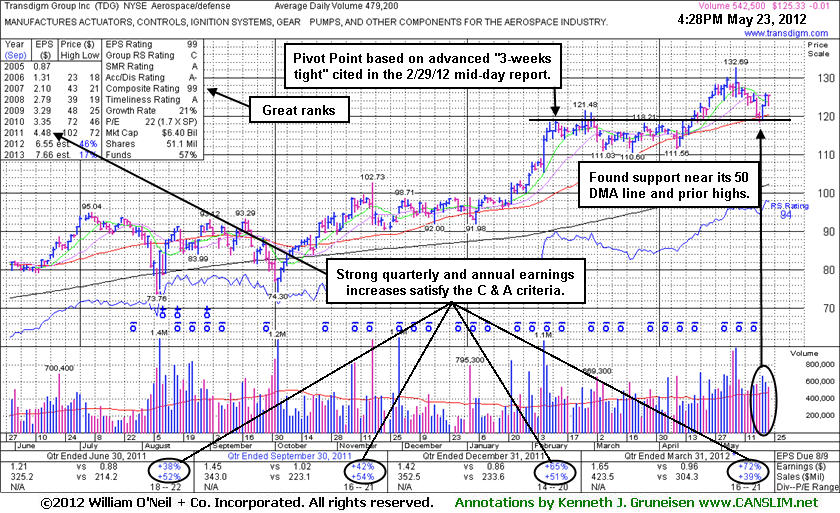
Transdigm Group Inc (TDG -$0.01 or -0.01% to $125.33) held its ground today after tallying 2 solid gains backed by above average volume. The gains are a sign of prompt support arriving at its 50-day moving average (DMA) line and near prior highs which also define important chart support. Poor market conditions (M criteria) argue against making any new buying efforts until a new confirmed rally by at least one of the major averages with a solid follow-through day. The high-ranked Aerospace/Defense firm's last appearance in this FSU section was on 3/30/12 with an annotated graph under the headline, "Enduring Distribution While Consolidating Above 50-Day Average", and after that appearance there was a "shake out" on 4/10/12 as it violated its 50 DMA line with a loss on above average volume. However, it made a stand before undercutting earlier lows and it promptly rebounded back above that important short-term average.
A volume-driven gain on 4/20/12 confirmed a technical buy signal and subsequent gains with heavy volume helped it hit new all-time highs before beginning its latest consolidation. Members may review prior analysis via the "view all notes" link on any stocks highlighted in CANSLIM.net reports.
The number of top-rated funds owning its share rose from 364 in Mar '11 to 430 in Mar '12, a reassuring trend concerning the I criteria. It reported earnings +72% on +39% sales revenues for the quarter ended March 31, 2012 versus the year ago period. That marked another increase in a streak of accelerating earnings comparisons above the +25% minimum guideline for earnings growth (solidly satisfying the C criteria). Its strong annual earnings history also satisfies the A criteria. In recent years it had rebounded and rallied to new highs following a deep consolidation after it was dropped from the Featured Stocks list 1/17/08. Members can review all prior notes, featured articles and analysis with annotated graphs via the Company Profile page where earlier pivot points were identified on annotated graphs.
|
|
|
Color Codes Explained :
Y - Better candidates highlighted by our
staff of experts.
G - Previously featured
in past reports as yellow but may no longer be buyable under the
guidelines.
***Last / Change / Volume data in this table is the closing quote data***
Symbol/Exchange
Company Name
Industry Group |
PRICE |
CHANGE
(%Change) |
Day High |
Volume
(% DAV)
(% 50 day avg vol) |
52 Wk Hi
% From Hi |
Featured
Date |
Price
Featured |
Pivot Featured |
|
Max Buy |
ACN
-
NYSE
Accenture Plc
DIVERSIFIED SERVICES - Business/Management Services
|
$58.91
|
-0.02
-0.03% |
$59.13
|
3,972,861
108.28% of 50 DAV
50 DAV is 3,669,200
|
$65.89
-10.59%
|
3/23/2012
|
$64.13
|
PP = $63.76
|
|
MB = $66.95
|
Most Recent Note - 5/22/2012 5:48:52 PM
G - Bounced from support at its longer-term 200 DMA line. Triggered technical sell signals with its recent losses undercutting prior highs in the $62-63 area and violating its 50 DMA line. See the latest FSU analysis for more details and a new annotated weekly graph.
>>> The latest Featured Stock Update with an annotated graph appeared on 5/22/2012. Click here.
View all notes |
Alert me of new notes |
CANSLIM.net Company Profile |
SEC |
Zacks Reports |
StockTalk |
News |
Chart |
Request a new note
C
A N
S L
I M


|
ALXN
-
NASDAQ
Alexion Pharmaceuticals
DRUGS - Drug Manufacturers - Other
|
$90.57
|
-1.97
-2.13% |
$91.36
|
3,250,008
239.80% of 50 DAV
50 DAV is 1,355,300
|
$95.01
-4.67%
|
5/1/2012
|
$91.73
|
PP = $95.11
|
|
MB = $99.87
|
 Most Recent Note - 5/23/2012 11:55:37 AM
G - Pulling back today near its 50 DMA line today. Its technical stance and outlook improved with a gap up on news that Alexion will replace Motorola Mobility Holdings Inc in the S&P 500 Index at Thursday's close. Recent lows define near-term chart support well above its 200 DMA line.
>>> The latest Featured Stock Update with an annotated graph appeared on 4/16/2012. Click here.
View all notes |
Alert me of new notes |
CANSLIM.net Company Profile |
SEC |
Zacks Reports |
StockTalk |
News |
Chart |
Request a new note
C
A N
S L
I M
|
ARBA
-
NASDAQ
Ariba Inc
INTERNET - Internet Software and Services
|
$45.00
|
+0.13
0.29% |
$45.04
|
18,261,688
1,345.74% of 50 DAV
50 DAV is 1,357,000
|
$45.48
-1.06%
|
4/27/2012
|
$38.53
|
PP = $37.24
|
|
MB = $39.10
|
Most Recent Note - 5/23/2012 11:59:34 AM
G - Holding its ground today following a considerable gain on 5/22/12 with heavy volume on news it will be bought by SAP in a $4.3 billion deal. The stock quickly got extended from its prior base after a quiet consolidation above chart support at its 50 DMA line and prior highs.
>>> The latest Featured Stock Update with an annotated graph appeared on 4/30/2012. Click here.
View all notes |
Alert me of new notes |
CANSLIM.net Company Profile |
SEC |
Zacks Reports |
StockTalk |
News |
Chart |
Request a new note
C
A N
S L
I M
|
CERN
-
NASDAQ
Cerner Corp
COMPUTER SOFTWARE and SERVICES - Healthcare Information Service
|
$79.84
|
+0.73
0.92% |
$80.00
|
980,500
82.51% of 50 DAV
50 DAV is 1,188,300
|
$84.10
-5.07%
|
4/27/2012
|
$77.23
|
PP = $78.63
|
|
MB = $82.56
|
Most Recent Note - 5/21/2012 4:37:40 PM
Y - Color code is changed to yellow after above average volume behind today's gain was a sign of prompt support near its 50 DMA line. Its prior loss had negated its recent technical breakout. Market weakness (M criteria) is an overriding concern that argues against new buying efforts until a new confirmed rally with a follow-through day by at least one of the major averages.
>>> The latest Featured Stock Update with an annotated graph appeared on 5/1/2012. Click here.
View all notes |
Alert me of new notes |
CANSLIM.net Company Profile |
SEC |
Zacks Reports |
StockTalk |
News |
Chart |
Request a new note
C
A N
S L
I M
|
CMCSA
-
NASDAQ
Comcast Corp Cl A
MEDIA - CATV Systems
|
$28.79
|
-0.17
-0.59% |
$28.84
|
10,201,166
80.16% of 50 DAV
50 DAV is 12,726,200
|
$30.88
-6.75%
|
5/2/2012
|
$30.04
|
PP = $30.51
|
|
MB = $32.04
|
Most Recent Note - 5/21/2012 4:39:56 PM
G - Posted a gain today with lighter volume. Color code was changed to green after slumping under its 50 DMA line, and last week it also undercut the prior low ($28.54 on 4/10/12) triggering a more worrisome technical sell signal.
>>> The latest Featured Stock Update with an annotated graph appeared on 5/7/2012. Click here.
View all notes |
Alert me of new notes |
CANSLIM.net Company Profile |
SEC |
Zacks Reports |
StockTalk |
News |
Chart |
Request a new note
C
A N
S L
I M
|
Symbol/Exchange
Company Name
Industry Group |
PRICE |
CHANGE
(%Change) |
Day High |
Volume
(% DAV)
(% 50 day avg vol) |
52 Wk Hi
% From Hi |
Featured
Date |
Price
Featured |
Pivot Featured |
|
Max Buy |
COO
-
NYSE
Cooper Companies Inc
HEALTH SERVICES - Medical Instruments and Supplies
|
$85.76
|
-0.11
-0.13% |
$86.03
|
509,020
124.55% of 50 DAV
50 DAV is 408,700
|
$89.31
-3.97%
|
3/9/2012
|
$83.05
|
PP = $81.02
|
|
MB = $85.07
|
Most Recent Note - 5/21/2012 12:27:30 PM
G - Trading up today following a streak of 6 consecutive losses. Consolidating above prior highs in the $83-84 area and its 50 DMA line, important near-term support. A subsequent violation may trigger a worrisome sell signal.
>>> The latest Featured Stock Update with an annotated graph appeared on 5/18/2012. Click here.
View all notes |
Alert me of new notes |
CANSLIM.net Company Profile |
SEC |
Zacks Reports |
StockTalk |
News |
Chart |
Request a new note
C
A N
S L
I M
|
DG
-
NYSE
Dollar General Corp
RETAIL - Discount, Variety Stores
|
$46.90
|
+1.00
2.18% |
$47.10
|
1,995,722
74.34% of 50 DAV
50 DAV is 2,684,600
|
$48.76
-3.81%
|
5/7/2012
|
$48.51
|
PP = $47.69
|
|
MB = $50.07
|
Most Recent Note - 5/22/2012 4:36:05 PM
G - Down today average volume, encountering resistance at its 50 DMA line. Recent violation of that important short-term average triggered a technical sell signal and its color code was changed to green. It has encountered recent distributional pressure while market conditions (M criteria) turned for the worse.
>>> The latest Featured Stock Update with an annotated graph appeared on 5/9/2012. Click here.
View all notes |
Alert me of new notes |
CANSLIM.net Company Profile |
SEC |
Zacks Reports |
StockTalk |
News |
Chart |
Request a new note
C
A N
S L
I M
|
EXPE
-
NASDAQ
Expedia Inc
INTERNET - Internet Information Providers
|
$45.61
|
+2.90
6.79% |
$46.07
|
8,991,858
206.55% of 50 DAV
50 DAV is 4,353,300
|
$43.92
3.85%
|
4/27/2012
|
$41.80
|
PP = $35.57
|
|
MB = $37.35
|
Most Recent Note - 5/23/2012 6:43:13 PM
G - Hit a new 52-week high today with 2 times average volume behind a considerable gain. Technically, it rallied from an advanced "3-weeks tight" base with no resistance remaining due to overhead supply, however no new pivot point has being cited. Until the market confirms a new rally with a solid follow through day from at least one of the major averages (M criteria) the fact-based investment system argues against new buying efforts in any stocks.
>>> The latest Featured Stock Update with an annotated graph appeared on 5/3/2012. Click here.
View all notes |
Alert me of new notes |
CANSLIM.net Company Profile |
SEC |
Zacks Reports |
StockTalk |
News |
Chart |
Request a new note
C
A N
S L
I M
|
GNC
-
NYSE
G N C Holdings Inc
RETAIL - Drug Stores
|
$38.45
|
+0.95
2.53% |
$39.16
|
2,323,628
106.25% of 50 DAV
50 DAV is 2,186,900
|
$41.95
-8.34%
|
1/19/2012
|
$28.99
|
PP = $29.60
|
|
MB = $31.08
|
Most Recent Note - 5/21/2012 4:59:01 PM
G - Found support near prior highs and its 50 DMA line while consolidating. Reported earnings +82% on +23% sales revenues for the quarter ended March 31, 2012 versus the year ago period.
>>> The latest Featured Stock Update with an annotated graph appeared on 4/26/2012. Click here.
View all notes |
Alert me of new notes |
CANSLIM.net Company Profile |
SEC |
Zacks Reports |
StockTalk |
News |
Chart |
Request a new note
C
A N
S L
I M
|
MG
-
NYSE
Mistras Group Inc
DIVERSIFIED SERVICES - Bulding and Faci;ity Management Services
|
$23.98
|
+0.13
0.55% |
$24.05
|
48,254
47.35% of 50 DAV
50 DAV is 101,900
|
$26.24
-8.61%
|
3/22/2012
|
$24.96
|
PP = $26.34
|
|
MB = $27.66
|
Most Recent Note - 5/21/2012 5:00:15 PM
G - Still consolidating in a tight trading range near its 50 DMA line. For more than a month it has been holding its ground above its 200 DMA line. Previously noted - "A volume-driven gain above its recent chart high ($25.49 on 3/21/12) may help trigger a proper technical buy signal after a new base formation, however no new (lower) pivot point is currently being cited, and it may continue encountering stubborn resistance."
>>> The latest Featured Stock Update with an annotated graph appeared on 4/2/2012. Click here.
View all notes |
Alert me of new notes |
CANSLIM.net Company Profile |
SEC |
Zacks Reports |
StockTalk |
News |
Chart |
Request a new note
C
A N
S L
I M
|
Symbol/Exchange
Company Name
Industry Group |
PRICE |
CHANGE
(%Change) |
Day High |
Volume
(% DAV)
(% 50 day avg vol) |
52 Wk Hi
% From Hi |
Featured
Date |
Price
Featured |
Pivot Featured |
|
Max Buy |
NTES
-
NASDAQ
Netease Inc Adr
INTERNET - Internet Information Providers
|
$59.70
|
+0.25
0.42% |
$60.12
|
1,018,628
139.14% of 50 DAV
50 DAV is 732,100
|
$63.07
-5.34%
|
3/19/2012
|
$56.18
|
PP = $55.10
|
|
MB = $57.86
|
Most Recent Note - 5/22/2012 12:16:31 PM
G - Found support above its 50 DMA line after 2 losing sessions with above average volume since its big volume-driven gain on 5/17/12 for a new 52-week high. It had not formed a sound base pattern, however no overhead supply remains to act as resistance. Reported earnings +33% on +36% sales revenues for the quarter ended March 31, 2012 versus the year ago period and it received an analyst upgrade. Recent lows near the $55 area define important chart support to watch.
>>> The latest Featured Stock Update with an annotated graph appeared on 3/27/2012. Click here.
View all notes |
Alert me of new notes |
CANSLIM.net Company Profile |
SEC |
Zacks Reports |
StockTalk |
News |
Chart |
Request a new note
C
A N
S L
I M
|
SWI
-
NYSE
Solarwinds Inc
COMPUTER SOFTWARE and SERVICES - Application Software
|
$47.88
|
+2.40
5.28% |
$48.00
|
939,732
83.93% of 50 DAV
50 DAV is 1,119,600
|
$47.66
0.46%
|
4/26/2012
|
$45.15
|
PP = $42.32
|
|
MB = $44.44
|
Most Recent Note - 5/23/2012 4:26:37 PM
G - Rallied to a new all-time high today with a considerable gain on below average volume. It did not form a sound new base of sufficient length, and the market (M criteria) is currently in need of a follow-through day to confirm a new rally.
>>> The latest Featured Stock Update with an annotated graph appeared on 5/21/2012. Click here.
View all notes |
Alert me of new notes |
CANSLIM.net Company Profile |
SEC |
Zacks Reports |
StockTalk |
News |
Chart |
Request a new note
C
A N
S L
I M
|
SXCI
-
NASDAQ
S X C Health Solutions
COMPUTER SOFTWARE and SERVICES - Healthcare Information Service
|
$90.44
|
+0.30
0.33% |
$90.61
|
468,626
42.69% of 50 DAV
50 DAV is 1,097,700
|
$100.50
-10.01%
|
2/23/2012
|
$68.24
|
PP = $66.05
|
|
MB = $69.35
|
Most Recent Note - 5/22/2012 4:32:09 PM
G - Reversed early gains today and closed near the session low with a small loss on higher (near average) volume. Still holding its ground in a tight range after pricing a new Public Offering last week. Consolidating in a tight range since it posted huge volume-driven gains on 4/18 and 4/19 while rallying on M&A news.
>>> The latest Featured Stock Update with an annotated graph appeared on 5/17/2012. Click here.
View all notes |
Alert me of new notes |
CANSLIM.net Company Profile |
SEC |
Zacks Reports |
StockTalk |
News |
Chart |
Request a new note
C
A N
S L
I M
|
TDG
-
NYSE
Transdigm Group Inc
AEROSPACE/DEFENSE - Aerospace/Defense Products and; Services
|
$125.33
|
-0.01
-0.01% |
$125.45
|
560,600
116.99% of 50 DAV
50 DAV is 479,200
|
$132.69
-5.55%
|
2/29/2012
|
$120.10
|
PP = $118.93
|
|
MB = $124.88
|
Most Recent Note - 5/23/2012 6:41:55 PM
G - Held its ground today after 2 solid gains backed by above average volume, a sign of prompt support at its 50 DMA line and near prior highs. Poor market conditions (M criteria) argue against making any new buying efforts until a new confirmed rally by at least one of the major averages with a solid follow-through day. See the latest FSU analysis for more details and a new annotated graph.
>>> The latest Featured Stock Update with an annotated graph appeared on 5/23/2012. Click here.
View all notes |
Alert me of new notes |
CANSLIM.net Company Profile |
SEC |
Zacks Reports |
StockTalk |
News |
Chart |
Request a new note
C
A N
S L
I M
|
TNGO
-
NASDAQ
Tangoe Inc
COMPUTER SOFTWARE and SERVICES - Technical and System Software
|
$21.41
|
-0.09
-0.42% |
$21.75
|
291,034
43.72% of 50 DAV
50 DAV is 665,700
|
$23.05
-7.11%
|
3/27/2012
|
$19.35
|
PP = $20.00
|
|
MB = $21.00
|
Most Recent Note - 5/21/2012 4:45:48 PM
G - Volume totals have been cooling while consolidating above prior highs in the $20 area and above important support at its 50 DMA line. Broader market conditions (M criteria) argue against new buying efforts until a new confirmed rally with follow-through day.
>>> The latest Featured Stock Update with an annotated graph appeared on 4/3/2012. Click here.
View all notes |
Alert me of new notes |
CANSLIM.net Company Profile |
SEC |
Zacks Reports |
StockTalk |
News |
Chart |
Request a new note
C
A N
S L
I M
|
Symbol/Exchange
Company Name
Industry Group |
PRICE |
CHANGE
(%Change) |
Day High |
Volume
(% DAV)
(% 50 day avg vol) |
52 Wk Hi
% From Hi |
Featured
Date |
Price
Featured |
Pivot Featured |
|
Max Buy |
TSCO
-
NASDAQ
Tractor Supply Co
SPECIALTY RETAIL - Specialty Retail, Other
|
$97.98
|
+1.20
1.24% |
$98.22
|
1,011,062
113.65% of 50 DAV
50 DAV is 889,600
|
$101.20
-3.18%
|
5/1/2012
|
$98.38
|
PP = $101.30
|
|
MB = $106.37
|
Most Recent Note - 5/22/2012 4:29:33 PM
G - Promptly rebounded above its 50 DMA line today with a gain backed near average volume. It did not trigger a new (or add-on) technical buy signal in recent weeks. Market conditions (M criteria) argue against new buying efforts until a new confirmed rally with a solid follow-through day by at least one of the major averages.
>>> The latest Featured Stock Update with an annotated graph appeared on 4/17/2012. Click here.
View all notes |
Alert me of new notes |
CANSLIM.net Company Profile |
SEC |
Zacks Reports |
StockTalk |
News |
Chart |
Request a new note
C
A N
S L
I M
|
UA
-
NYSE
Under Armour Inc Cl A
CONSUMER NON-DURABLES - Textile - Apparel Clothing
|
$94.88
|
+0.52
0.55% |
$95.71
|
889,774
95.42% of 50 DAV
50 DAV is 932,500
|
$102.86
-7.76%
|
2/15/2012
|
$85.77
|
PP = $84.86
|
|
MB = $89.10
|
Most Recent Note - 5/21/2012 4:48:25 PM
G - Posted a gain and finished near the session high today but volume was lighter than average. Concerns were recently raised by weaker fundamentals, its first quarterly earnings increase below the +25% minimum guideline in more than 2 years.
>>> The latest Featured Stock Update with an annotated graph appeared on 4/4/2012. Click here.
View all notes |
Alert me of new notes |
CANSLIM.net Company Profile |
SEC |
Zacks Reports |
StockTalk |
News |
Chart |
Request a new note
C
A N
S L
I M
|
V
-
NYSE
Visa Inc Cl A
DIVERSIFIED SERVICES - Business/Management Services
|
$119.17
|
+0.78
0.66% |
$119.46
|
4,138,299
114.78% of 50 DAV
50 DAV is 3,605,500
|
$125.35
-4.93%
|
3/12/2012
|
$116.53
|
PP = $119.46
|
|
MB = $125.43
|
Most Recent Note - 5/21/2012 4:51:13 PM
G - Up today with lighter volume, rebounding toward it 50 DMA line which has acted as a resistance level after the technical violation on 5/03/12. The longer it lingers below its 50 DMA line the worse its outlook becomes.
>>> The latest Featured Stock Update with an annotated graph appeared on 5/16/2012. Click here.
View all notes |
Alert me of new notes |
CANSLIM.net Company Profile |
SEC |
Zacks Reports |
StockTalk |
News |
Chart |
Request a new note
C
A N
S L
I M
|
VSI
-
NYSE
Vitamin Shoppe Inc
SPECIALTY RETAIL - Specialty Retail, Other
|
$49.80
|
+0.23
0.46% |
$50.11
|
355,803
75.22% of 50 DAV
50 DAV is 473,000
|
$55.29
-9.93%
|
4/25/2012
|
$47.77
|
PP = $48.46
|
|
MB = $50.88
|
Most Recent Note - 5/21/2012 4:52:57 PM
G - Gain today was backed by lighter than average volume as it found some support near its old highs and halted a streak of 5 consecutive losses since a negative reversal at its 52-week high. It has slumped below its "max buy" level, however broader market weakness (M criteria) is an overriding concern which argues against any new buying efforts until a new rally is confirmed with a solid follow-through day by at least one of the major averages.
>>> The latest Featured Stock Update with an annotated graph appeared on 4/25/2012. Click here.
View all notes |
Alert me of new notes |
CANSLIM.net Company Profile |
SEC |
Zacks Reports |
StockTalk |
News |
Chart |
Request a new note
C
A N
S L
I M
|
WFM
-
NASDAQ
Whole Foods Market Inc
RETAIL - Grocery Stores
|
$86.38
|
-0.51
-0.59% |
$86.95
|
2,016,409
124.22% of 50 DAV
50 DAV is 1,623,200
|
$91.50
-5.60%
|
5/3/2012
|
$90.28
|
PP = $86.45
|
|
MB = $90.77
|
Most Recent Note - 5/21/2012 4:55:02 PM
G - Gain today with slightly higher above average volume was a sign of prompt support as it rebounded above its 50 DMA line following a streak of 5 consecutive losses which completely negated the latest breakout. It stalled following its considerable "breakaway gap" on 5/03/12, meanwhile the broader market (M criteria) fell into the latest correction.
>>> The latest Featured Stock Update with an annotated graph appeared on 5/11/2012. Click here.
View all notes |
Alert me of new notes |
CANSLIM.net Company Profile |
SEC |
Zacks Reports |
StockTalk |
News |
Chart |
Request a new note
C
A N
S L
I M
|
Symbol/Exchange
Company Name
Industry Group |
PRICE |
CHANGE
(%Change) |
Day High |
Volume
(% DAV)
(% 50 day avg vol) |
52 Wk Hi
% From Hi |
Featured
Date |
Price
Featured |
Pivot Featured |
|
Max Buy |
|
|
|
THESE ARE NOT BUY RECOMMENDATIONS!
Comments contained in the body of this report are technical
opinions only. The material herein has been obtained
from sources believed to be reliable and accurate, however,
its accuracy and completeness cannot be guaranteed.
This site is not an investment advisor, hence it does
not endorse or recommend any securities or other investments.
Any recommendation contained in this report may not
be suitable for all investors and it is not to be deemed
an offer or solicitation on our part with respect to
the purchase or sale of any securities. All trademarks,
service marks and trade names appearing in this report
are the property of their respective owners, and are
likewise used for identification purposes only.
This report is a service available
only to active Paid Premium Members.
You may opt-out of receiving report notifications
at any time. Questions or comments may be submitted
by writing to Premium Membership Services 665 S.E. 10 Street, Suite 201 Deerfield Beach, FL 33441-5634 or by calling 1-800-965-8307
or 954-785-1121.
|
|
|

