You are not logged in.
This means you
CAN ONLY VIEW reports that were published prior to Monday, April 14, 2025.
You
MUST UPGRADE YOUR MEMBERSHIP if you want to see any current reports.
AFTER MARKET UPDATE - FRIDAY, MAY 20TH, 2011
Previous After Market Report Next After Market Report >>>
|
|
|
|
DOW |
-93.28 |
12,512.04 |
-0.74% |
|
Volume |
1,005,070,250 |
+15% |
|
Volume |
1,725,007,130 |
+0% |
|
NASDAQ |
-19.99 |
2,803.32 |
-0.71% |
|
Advancers |
1,009 |
32% |
|
Advancers |
861 |
32% |
|
S&P 500 |
-10.33 |
1,333.27 |
-0.77% |
|
Decliners |
2,004 |
64% |
|
Decliners |
1,732 |
64% |
|
Russell 2000 |
-6.10 |
829.06 |
-0.73% |
|
52 Wk Highs |
100 |
|
|
52 Wk Highs |
58 |
|
|
S&P 600 |
-3.45 |
443.25 |
-0.77% |
|
52 Wk Lows |
22 |
|
|
52 Wk Lows |
53 |
|
|
 |
Breadth Negative While Leadership Wanes and Financial Groups Fall
Kenneth J. Gruneisen - Passed the CAN SLIM® Master's Exam
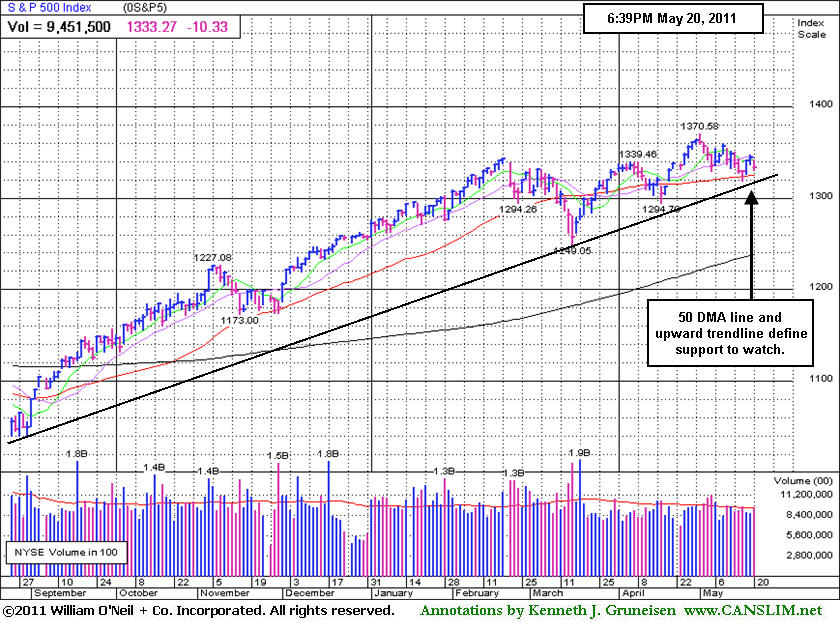
For the week, the Dow Jones Industrial Average was down -0.7%, the S&P 500 Index fell -0.3%, and the Nasdaq Composite Index dropped -0.9%. As the major averages fell on Friday declining issues beat advancers by about 2-1 on both the NYSE and the Nasdaq exchange. Volume totals were reported slightly higher than the prior session totals on the NYSE and on the Nasdaq exchange, indicating heavier selling conviction coming from the institutional crowd, a discouraging sign. New 52-week highs still outnumbered new 52-week lows on the NYSE and on the Nasdaq exchange. Leadership waned as there were only 19 high-ranked companies from the CANSLIM.net Leaders List that made new 52-week highs and appeared on the CANSLIM.net BreakOuts Page, down from the total of 53 on the prior session. On the Featured Stocks Page there were 6 gainers out of the 15 high-ranked leaders currently included.
Global uncertainty and weak retail stocks closed out a volatile week on a sour note. Gold prices rallied and European debt concerns deepened after Fitch downgraded Greece's bonds further into junk status. Fitch said any restructuring of Greece's debt should be considered a default.
The Gap Inc (GPS -17.5%) gapped down for a considerable loss after the retailer slashed its full-year profit forecast by one-quarter because of rising costs. Aeropostale Inc (ARO -14.25%) also warned that second quarter profits would trail forecasts. Meanwhile, Barnes & Noble Inc (BKS +29.91%) gapped up after Liberty Media Corporation (LCAPA -2.06%) offered to buy the bookstore chain for $17 per share. BP Plc (BP +2.53%) rose after one of its partners in the Gulf of Mexico oil disaster agreed to pay over $1 billion to settle its share of the claims.
PICTURED: The S&P 500 Index is consolidating above its 50-day moving average (DMA) line and upward trendline which define important near-term chart support.
|
 Kenneth J. Gruneisen started out as a licensed stockbroker in August 1987, a couple of months prior to the historic stock market crash that took the Dow Jones Industrial Average down -22.6% in a single day. He has published daily fact-based fundamental and technical analysis on high-ranked stocks online for two decades. Through FACTBASEDINVESTING.COM, Kenneth provides educational articles, news, market commentary, and other information regarding proven investment systems that work in good times and bad.
Comments contained in the body of this report are technical opinions only and are not necessarily those of Gruneisen Growth Corp. The material herein has been obtained from sources believed to be reliable and accurate, however, its accuracy and completeness cannot be guaranteed. Our firm, employees, and customers may effect transactions, including transactions contrary to any recommendation herein, or have positions in the securities mentioned herein or options with respect thereto. Any recommendation contained in this report may not be suitable for all investors and it is not to be deemed an offer or solicitation on our part with respect to the purchase or sale of any securities. |
|
 |
Financial Indexes Failing Instead of Leading
Kenneth J. Gruneisen - Passed the CAN SLIM® Master's Exam
Financial shares slumped on Friday and were a negative influence on the major averages as the Bank Index ($BKX -1.80%) and Broker/Dealer Index ($XBD -1.35%) were the worst laggards among the industry groups routinely followed in the Industry Group Watch section. The Retail Index ($RLX -1.38%) also created a drag on the major averages, and the Healthcare Index ($HMO -1.21%) group also backpedaled. The tech sector had a mildly negative bias as the Networking Index ($NWX -0.58%), Semiconductor Index ($SOX -0.30%), Internet Index ($IIX -0.10%), and Biotechnology Index ($BTK -0.08%) finished unanimously lower with small losses. The Gold & Silver Index ($XAU +0.38%) posted a small gain, meanwhile energy-related shares were mixed and mostly indecisive as the Integrated Oil Index ($XOI -0.17%) inched lower and the Oil Services Index ($OSX +0.21%) inched higher.
Charts courtesy www.stockcharts.com
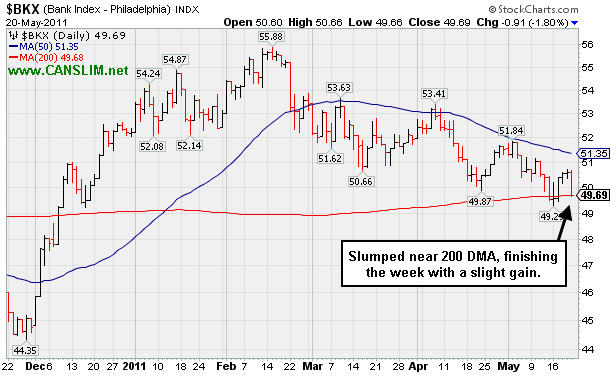
PICTURED 1: The Bank Index ($BKX -1.80%) slumped near its 200-day moving average (DMA) line while finishing with a small weekly gain..
Charts courtesy www.stockcharts.com
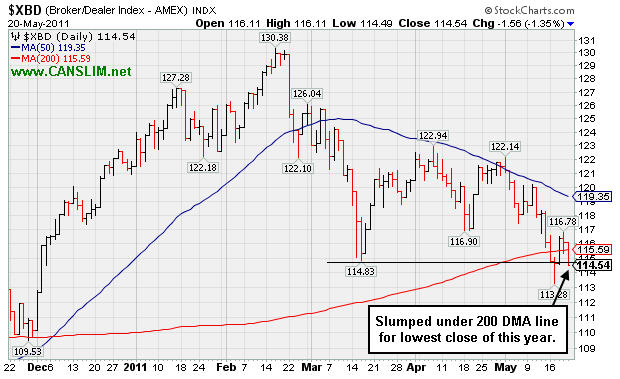
PICTURED 2: The Broker/Dealer Index ($XBD -1.35%) slumped under its 200 DMA to its lowest close of the year. Weak action in the financial groups bodes poorly for the broader market outlook. Until healthier action occurs in the financial groups, greater caution is called for. Historically, the major averages have been prone to bad downdrafts when financial shares are weak.
| Oil Services |
$OSX |
265.37 |
+0.55 |
+0.21% |
+8.26% |
| Healthcare |
$HMO |
2,396.65 |
-29.47 |
-1.21% |
+41.65% |
| Integrated Oil |
$XOI |
1,288.68 |
-2.18 |
-0.17% |
+6.22% |
| Semiconductor |
$SOX |
432.56 |
-1.31 |
-0.30% |
+5.04% |
| Networking |
$NWX |
320.55 |
-1.88 |
-0.58% |
+14.26% |
| Internet |
$IIX |
320.33 |
-0.33 |
-0.10% |
+4.09% |
| Broker/Dealer |
$XBD |
114.54 |
-1.56 |
-1.35% |
-5.74% |
| Retail |
$RLX |
531.23 |
-7.45 |
-1.38% |
+4.49% |
| Gold & Silver |
$XAU |
199.29 |
+0.75 |
+0.38% |
-12.04% |
| Bank |
$BKX |
49.69 |
-0.91 |
-1.80% |
-4.83% |
| Biotech |
$BTK |
1,476.74 |
-1.17 |
-0.08% |
+13.80% |
|
|
|
 |
Extended From Sound Base After +126% Rally in 9 Months
Kenneth J. Gruneisen - Passed the CAN SLIM® Master's Exam
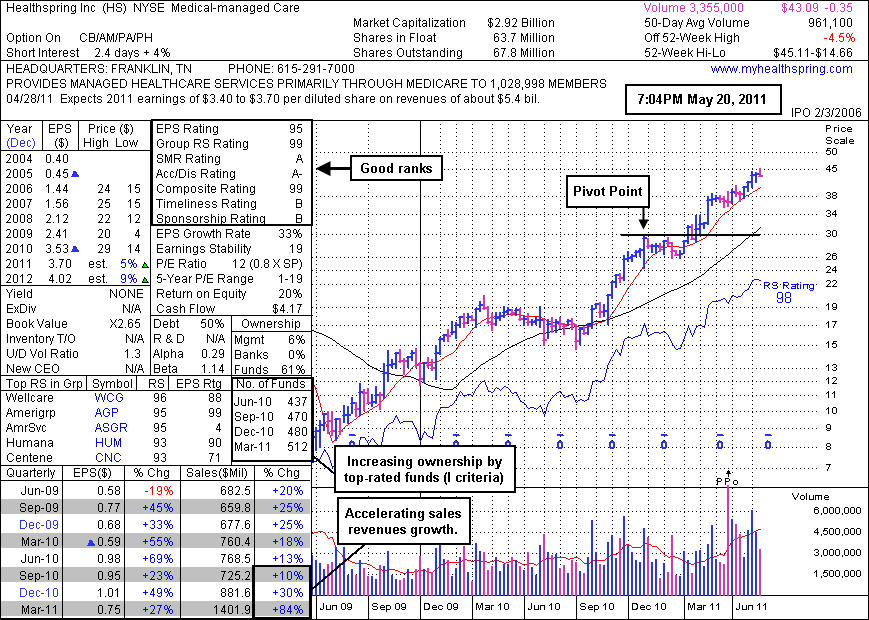
Healthspring Inc's (HS -$1.18 or -2.67% to $43.09) volume total cooled this week while hovering at its all-time high, extended from any sound base pattern. Disciplined investors may watch for a secondary buy point or new base to possibly develop and be noted. Meanwhile, prior highs define important chart support to watch along with its 50-day moving average (DMA) line in the $39-40 area. Violations would trigger technical sell signals. Following its last appearance in this FSU section on April 21, 2011 with an annotated graph under the headline,"Breakout Followed Recently Noted Public Offering", it went on to new all-time highs with move volume driven gains. Since HS was first featured at $19.91 in the 8/27/10 mid-day report it has traded up as much as +126.56%. Along the way it had paused to form a new base and a new pivot point was noted before it broke out again in January.
The number of top-rated funds owning its shares rose from 437 in June '10 to 512 in March '11, a reassuring sign concerning the I criteria. For the quarter ended March 31, 2011 versus the year earlier period its +84% increase in sales revenues marked an acceleration from +30% and +10% increases in the Sep and Dec '10 quarters, respectively. It has maintained strong earnings increases above the +25% guideline (C criteria) in the latest quarters and other bullish characteristics including high ranks. Street earnings estimates calling for EPS growth only in the +5-9% range in FY '11 and FY '12 remain a concern.
|
|
|
Color Codes Explained :
Y - Better candidates highlighted by our
staff of experts.
G - Previously featured
in past reports as yellow but may no longer be buyable under the
guidelines.
***Last / Change / Volume data in this table is the closing quote data***
Symbol/Exchange
Company Name
Industry Group |
PRICE |
CHANGE
(%Change) |
Day High |
Volume
(% DAV)
(% 50 day avg vol) |
52 Wk Hi
% From Hi |
Featured
Date |
Price
Featured |
Pivot Featured |
|
Max Buy |
CMG
-
NYSE
Chipotle Mexican Grill
LEISURE - Restaurants
|
$279.89
|
-1.23
-0.44% |
$281.17
|
677,544
60.33% of 50 DAV
50 DAV is 1,123,100
|
$289.35
-3.27%
|
4/1/2011
|
$274.00
|
PP = $275.10
|
|
MB = $288.86
|
 Most Recent Note - 5/20/2011 4:35:13 PM
G - Hovering near its all-time high after a 5-week cup shaped base with volume totals cooling in recent weeks while consolidating above its 50 DMA line. It faces virtually no resistance due to overhead supply.
>>> The latest Featured Stock Update with an annotated graph appeared on 5/17/2011. Click here.
View all notes |
Alert me of new notes |
CANSLIM.net Company Profile |
SEC |
Zacks Reports |
StockTalk |
News |
Chart |
Request a new note
C
A N
S L
I M


|
CTSH
-
NASDAQ
Cognizant Tech Sol Cl A
COMPUTER SOFTWARE and SERVICES - Business Software and Services
|
$74.05
|
+0.36
0.49% |
$74.66
|
2,145,461
85.73% of 50 DAV
50 DAV is 2,502,600
|
$83.48
-11.30%
|
2/7/2011
|
$75.09
|
PP = $76.46
|
|
MB = $80.28
|
Most Recent Note - 5/19/2011 5:16:37 PM
G - Considerable loss today with (lighter) near average volume, closing -11.7% off its all-time high. Recently slumping toward prior lows in the $70.50 range and its 200 DMA line defining important long-term chart support to watch. Overhead supply up through the $83 level may hinder upward progress for the near term.
>>> The latest Featured Stock Update with an annotated graph appeared on 5/16/2011. Click here.
View all notes |
Alert me of new notes |
CANSLIM.net Company Profile |
SEC |
Zacks Reports |
StockTalk |
News |
Chart |
Request a new note
C
A N
S L
I M
|
EZPW
-
NASDAQ
Ezcorp Inc Cl A
SPECIALTY RETAIL - Specialty Retail, Other
|
$30.96
|
-0.10
-0.31% |
$31.32
|
240,290
68.52% of 50 DAV
50 DAV is 350,700
|
$33.08
-6.41%
|
2/18/2011
|
$27.94
|
PP = $30.04
|
|
MB = $31.54
|
Most Recent Note - 5/19/2011 5:10:19 PM
G - Today's gain with heavier (near average) volume continued its healthy consolidation above its 50 DMA line. It has not formed a sound new base pattern. Recent lows define important nearby chart support to watch where technical violations would raise more serious concerns.
>>> The latest Featured Stock Update with an annotated graph appeared on 5/10/2011. Click here.
View all notes |
Alert me of new notes |
CANSLIM.net Company Profile |
SEC |
Zacks Reports |
StockTalk |
News |
Chart |
Request a new note
C
A N
S L
I M
|
FOSL
-
NASDAQ
Fossil Inc
CONSUMER DURABLES - Recreational Goods, Other
|
$102.94
|
-2.04
-1.94% |
$104.86
|
472,055
55.40% of 50 DAV
50 DAV is 852,100
|
$107.54
-4.28%
|
2/1/2011
|
$73.30
|
PP = $74.44
|
|
MB = $78.16
|
Most Recent Note - 5/20/2011 4:37:08 PM
G - Volume totals have been cooling while holding its ground since its considerable gap up gain on 5/10/11 for a new all-time high. It is extended from any sound base. Prior highs near $96 define initial support to watch above its 50 DMA line.
>>> The latest Featured Stock Update with an annotated graph appeared on 5/2/2011. Click here.
View all notes |
Alert me of new notes |
CANSLIM.net Company Profile |
SEC |
Zacks Reports |
StockTalk |
News |
Chart |
Request a new note
C
A N
S L
I M
|
HMSY
-
NASDAQ
H M S Holdings Corp
COMPUTER SOFTWARE and SERVICES - Healthcare Information Service
|
$78.24
|
+0.46
0.59% |
$78.80
|
154,663
92.83% of 50 DAV
50 DAV is 166,600
|
$84.82
-7.76%
|
11/19/2010
|
$61.89
|
PP = $63.01
|
|
MB = $66.16
|
Most Recent Note - 5/18/2011 5:29:06 PM
G - Gain today on near average volume, rallying toward its 50 DMA line which may now act as resistance. A rally above it would improve its technical stance. Deterioration below its recent chart low ($73.27) would raise more serious concerns and trigger an additional sell signal.
>>> The latest Featured Stock Update with an annotated graph appeared on 4/26/2011. Click here.
View all notes |
Alert me of new notes |
CANSLIM.net Company Profile |
SEC |
Zacks Reports |
StockTalk |
News |
Chart |
Request a new note
C
A N
S L
I M
|
Symbol/Exchange
Company Name
Industry Group |
PRICE |
CHANGE
(%Change) |
Day High |
Volume
(% DAV)
(% 50 day avg vol) |
52 Wk Hi
% From Hi |
Featured
Date |
Price
Featured |
Pivot Featured |
|
Max Buy |
HS
-
NYSE
Healthspring Inc
HEALTH SERVICES - Health Care Plans
|
$43.09
|
-1.18
-2.67% |
$44.42
|
598,667
62.29% of 50 DAV
50 DAV is 961,100
|
$45.11
-4.48%
|
3/22/2011
|
$38.29
|
PP = $38.85
|
|
MB = $40.79
|
Most Recent Note - 5/20/2011 3:31:01 PM
G - Volume totals have cooled this week while hovering at its all-time high, extended from any sound base pattern. Prior highs define important chart support to watch along with its 50 DMA line in the $39-40 area. Violations would trigger technical sell signals.
>>> The latest Featured Stock Update with an annotated graph appeared on 5/20/2011. Click here.
View all notes |
Alert me of new notes |
CANSLIM.net Company Profile |
SEC |
Zacks Reports |
StockTalk |
News |
Chart |
Request a new note
C
A N
S L
I M
|
INFA
-
NASDAQ
Informatica Corp
COMPUTER SOFTWARE and SERVICES - Business Software and Services
|
$55.38
|
+0.49
0.89% |
$55.52
|
831,414
77.03% of 50 DAV
50 DAV is 1,079,300
|
$56.49
-1.96%
|
3/24/2011
|
$50.04
|
PP = $49.86
|
|
MB = $52.35
|
Most Recent Note - 5/18/2011 4:24:09 PM
G - Considerable gain today with above average volume. It has not formed a sound new base pattern. Prior highs in the $49 area and its 50 DMA line, important chart support to watch. Subsequent violations would trigger technical sell signals.
>>> The latest Featured Stock Update with an annotated graph appeared on 4/27/2011. Click here.
View all notes |
Alert me of new notes |
CANSLIM.net Company Profile |
SEC |
Zacks Reports |
StockTalk |
News |
Chart |
Request a new note
C
A N
S L
I M
|
LULU
-
NASDAQ
Lululemon Athletica
MANUFACTURING - Textile Manufacturing
|
$96.29
|
-0.95
-0.98% |
$96.80
|
1,189,842
56.31% of 50 DAV
50 DAV is 2,113,000
|
$102.83
-6.36%
|
5/18/2011
|
$98.15
|
PP = $102.93
|
|
MB = $108.08
|
Most Recent Note - 5/18/2011 4:47:05 PM
Y - Volume totals have been cooling and lighter than average in recent weeks while this high-ranked Retail-Apparel firm has been consolidating near its all-time highs. Color code is changed to yellow with new pivot point cited based on a "square box" base pattern formed since its 4/21/11 high. Its 50 DMA line defines support above prior highs in the $85 area, important levels to watch on pullbacks.
>>> The latest Featured Stock Update with an annotated graph appeared on 5/3/2011. Click here.
View all notes |
Alert me of new notes |
CANSLIM.net Company Profile |
SEC |
Zacks Reports |
StockTalk |
News |
Chart |
Request a new note
C
A N
S L
I M
|
MG
-
NYSE
Mistras Group Inc
DIVERSIFIED SERVICES - Bulding and Faci;ity Management Services
|
$16.52
|
-0.11
-0.66% |
$16.67
|
70,559
38.81% of 50 DAV
50 DAV is 181,800
|
$18.46
-10.51%
|
3/15/2011
|
$15.48
|
PP = $15.90
|
|
MB = $16.70
|
Most Recent Note - 5/19/2011 5:31:03 PM
G - Completed a new Public Offering recently and it is now lingering below its 50 DMA line with volume totals cooling. Gains above that short-term average would help its outlook, technically, meanwhile the recent low ($15.44 on 5/05/11) defines the next chart support.
>>> The latest Featured Stock Update with an annotated graph appeared on 5/12/2011. Click here.
View all notes |
Alert me of new notes |
CANSLIM.net Company Profile |
SEC |
Zacks Reports |
StockTalk |
News |
Chart |
Request a new note
C
A N
S L
I M
|
MWIV
-
NASDAQ
M W I Veterinary Supply
HEALTH SERVICES - Medical Instruments and; Supplies
|
$83.39
|
+0.69
0.83% |
$84.57
|
54,849
59.36% of 50 DAV
50 DAV is 92,400
|
$86.99
-4.14%
|
11/4/2010
|
$61.79
|
PP = $59.60
|
|
MB = $62.58
|
Most Recent Note - 5/19/2011 5:32:05 PM
G - Hovering in a tight trading range near its all-time high with volume totals cooling since 5/05/11 while stubbornly holding its ground. It has not formed a sound base pattern. Its 50 DMA line defines important support to watch.
>>> The latest Featured Stock Update with an annotated graph appeared on 5/5/2011. Click here.
View all notes |
Alert me of new notes |
CANSLIM.net Company Profile |
SEC |
Zacks Reports |
StockTalk |
News |
Chart |
Request a new note
C
A N
S L
I M
|
Symbol/Exchange
Company Name
Industry Group |
PRICE |
CHANGE
(%Change) |
Day High |
Volume
(% DAV)
(% 50 day avg vol) |
52 Wk Hi
% From Hi |
Featured
Date |
Price
Featured |
Pivot Featured |
|
Max Buy |
OPNT
-
NASDAQ
Opnet Technologies
INTERNET - Internet Software and Services
|
$38.56
|
-0.22
-0.57% |
$39.19
|
61,756
47.65% of 50 DAV
50 DAV is 129,600
|
$42.51
-9.29%
|
5/11/2011
|
$41.21
|
PP = $40.50
|
|
MB = $42.53
|
Most Recent Note - 5/18/2011 5:10:48 PM
G - Gain today on light volume helped it make a stand at its 50 DMA line. Concerns were raised after it slumped more than -7% below its pivot point and undercut its prior high close ($39.44 on 4/01/11). Its color code was changed to green after it completely negated its latest breakout.
>>> The latest Featured Stock Update with an annotated graph appeared on 5/11/2011. Click here.
View all notes |
Alert me of new notes |
CANSLIM.net Company Profile |
SEC |
Zacks Reports |
StockTalk |
News |
Chart |
Request a new note
C
A N
S L
I M
|
PCLN
-
NASDAQ
Priceline.Com Inc
INTERNET - Internet Software and Services
|
$520.08
|
-2.02
-0.39% |
$525.99
|
764,534
68.40% of 50 DAV
50 DAV is 1,117,800
|
$561.88
-7.44%
|
1/3/2011
|
$399.55
|
PP = $428.20
|
|
MB = $449.61
|
Most Recent Note - 5/19/2011 6:48:09 PM
G - Technically, it found support at its 50 DMA line this week. That short-term average has been a reliable support level this year. See the latest FSU analysis for details and a new annotated graph.
>>> The latest Featured Stock Update with an annotated graph appeared on 5/19/2011. Click here.
View all notes |
Alert me of new notes |
CANSLIM.net Company Profile |
SEC |
Zacks Reports |
StockTalk |
News |
Chart |
Request a new note
C
A N
S L
I M
|
RAX
-
NYSE
Rackspace Hosting Inc
INTERNET - Internet Software and; Services
|
$43.08
|
+0.36
0.84% |
$43.35
|
1,643,766
92.79% of 50 DAV
50 DAV is 1,771,400
|
$46.50
-7.34%
|
3/16/2011
|
$36.28
|
PP = $40.72
|
|
MB = $42.76
|
Most Recent Note - 5/18/2011 4:52:25 PM
G - Gains this week helped it make a stand near its 50 DMA line. It has not formed a sound new base. Deterioration below its short-term average and recent chart low ($38.84) would trigger a more worrisome technical sell signals.
>>> The latest Featured Stock Update with an annotated graph appeared on 5/13/2011. Click here.
View all notes |
Alert me of new notes |
CANSLIM.net Company Profile |
SEC |
Zacks Reports |
StockTalk |
News |
Chart |
Request a new note
C
A N
S L
I M
|
TIBX
-
NASDAQ
Tibco Software Inc
COMPUTER SOFTWARE and SERVICES - Business Software and Services
|
$29.39
|
+0.54
1.85% |
$29.66
|
3,117,112
117.97% of 50 DAV
50 DAV is 2,642,200
|
$30.75
-4.42%
|
3/18/2011
|
$23.88
|
PP = $26.04
|
|
MB = $27.34
|
Most Recent Note - 5/20/2011 3:28:37 PM
G - After a small gap down today it has managed a positive reversal. It is consolidating above its 50 DMA line, extended from a sound base pattern. Technically, that short-term average and recent low ($27.17) mark important chart support levels to watch where violations may trigger sell signals.
>>> The latest Featured Stock Update with an annotated graph appeared on 5/18/2011. Click here.
View all notes |
Alert me of new notes |
CANSLIM.net Company Profile |
SEC |
Zacks Reports |
StockTalk |
News |
Chart |
Request a new note
C
A N
S L
I M
|
ULTA
-
NASDAQ
Ulta Salon Cosm & Frag
SPECIALTY RETAIL - Specialty Retail, Other
|
$52.50
|
-0.95
-1.78% |
$53.28
|
690,203
116.88% of 50 DAV
50 DAV is 590,500
|
$56.87
-7.68%
|
1/6/2011
|
$36.12
|
PP = $37.34
|
|
MB = $39.21
|
Most Recent Note - 5/20/2011 4:49:03 PM
G - Losses this week with higher volume were indicative of distributional pressure while slumping from its all-time high toward its 50 DMA line (now $50.68). Chart readers know that short-term average typically defines support to watch where a violation may trigger a technical sell signal.
>>> The latest Featured Stock Update with an annotated graph appeared on 4/28/2011. Click here.
View all notes |
Alert me of new notes |
CANSLIM.net Company Profile |
SEC |
Zacks Reports |
StockTalk |
News |
Chart |
Request a new note
C
A N
S L
I M
|
Symbol/Exchange
Company Name
Industry Group |
PRICE |
CHANGE
(%Change) |
Day High |
Volume
(% DAV)
(% 50 day avg vol) |
52 Wk Hi
% From Hi |
Featured
Date |
Price
Featured |
Pivot Featured |
|
Max Buy |
|
|
|
THESE ARE NOT BUY RECOMMENDATIONS!
Comments contained in the body of this report are technical
opinions only. The material herein has been obtained
from sources believed to be reliable and accurate, however,
its accuracy and completeness cannot be guaranteed.
This site is not an investment advisor, hence it does
not endorse or recommend any securities or other investments.
Any recommendation contained in this report may not
be suitable for all investors and it is not to be deemed
an offer or solicitation on our part with respect to
the purchase or sale of any securities. All trademarks,
service marks and trade names appearing in this report
are the property of their respective owners, and are
likewise used for identification purposes only.
This report is a service available
only to active Paid Premium Members.
You may opt-out of receiving report notifications
at any time. Questions or comments may be submitted
by writing to Premium Membership Services 665 S.E. 10 Street, Suite 201 Deerfield Beach, FL 33441-5634 or by calling 1-800-965-8307
or 954-785-1121.
|
|
|

