You are not logged in.
This means you
CAN ONLY VIEW reports that were published prior to Tuesday, April 15, 2025.
You
MUST UPGRADE YOUR MEMBERSHIP if you want to see any current reports.
AFTER MARKET UPDATE - THURSDAY, MAY 19TH, 2011
Previous After Market Report Next After Market Report >>>
|
|
|
|
DOW |
+45.14 |
12,605.32 |
+0.36% |
|
Volume |
872,760,730 |
-1% |
|
Volume |
1,716,808,490 |
-6% |
|
NASDAQ |
+8.31 |
2,823.31 |
+0.30% |
|
Advancers |
1,763 |
56% |
|
Advancers |
1,309 |
48% |
|
S&P 500 |
+2.92 |
1,343.60 |
+0.22% |
|
Decliners |
1,237 |
39% |
|
Decliners |
1,312 |
48% |
|
Russell 2000 |
+1.71 |
835.16 |
+0.21% |
|
52 Wk Highs |
179 |
|
|
52 Wk Highs |
81 |
|
|
S&P 600 |
+0.84 |
446.70 |
+0.19% |
|
52 Wk Lows |
18 |
|
|
52 Wk Lows |
38 |
|
|
 |
Leadership Expands but Major Indices' Rally Lacks Volume Surge
Kenneth J. Gruneisen - Passed the CAN SLIM® Master's Exam
Fewer Americans than forecast filed applications for unemployment benefits last week, and this news was considered a bright point on Thursday as the major averages posted gains. Advancing issues beat decliners by about 3-2 on the NYSE while the mixture was even on the Nasdaq exchange. Volume totals were reported slightly lighter than the prior session totals on the NYSE and on the Nasdaq exchange, which still indicated a lack of great buying conviction coming from the institutional crowd. New 52-week highs outnumbered new 52-week lows on the NYSE and on the Nasdaq exchange. Leadership expanded as there were 53 high-ranked companies from the CANSLIM.net Leaders List that made new 52-week highs and appeared on the CANSLIM.net BreakOuts Page, up from the total of 32 on the prior session. On the Featured Stocks Page there were 10 gainers out of the 15 high-ranked leaders currently included.
A trio of weaker-than-expected economic reports suggested the Federal Reserve will be in no hurry to raise interest rates. April existing home sales, April economic indicators, and the May Philadelphia factory report were all weaker than forecast. Leading indicators fell 0.3%, the first decline since last June. Existing home sales dropped 0.8%, and the average selling price for an existing home is 5% below year-ago levels.
Oil prices gave up early gains following the reports, and oil traded below $100 per barrel. Dollar Tree Inc (DLTR +2.9%) and PetsMart Inc (PETM +7.2%) were among retailers posting positive earnings. LinkedIn (LNKD +109%) blasted to nearly $123 per share on its first day of trading.
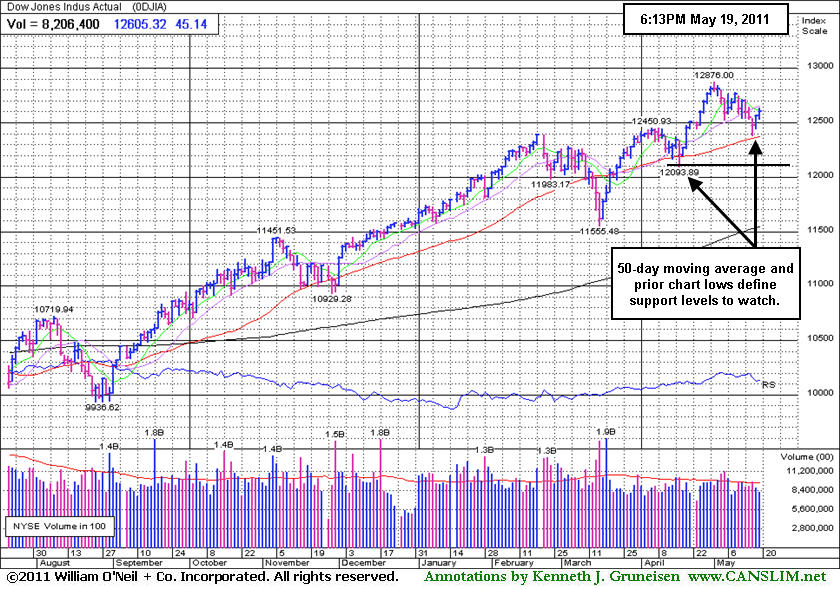
PICTURED: The Dow Jones Industrial Average was up as many as 73 points in early trading.
|
 Kenneth J. Gruneisen started out as a licensed stockbroker in August 1987, a couple of months prior to the historic stock market crash that took the Dow Jones Industrial Average down -22.6% in a single day. He has published daily fact-based fundamental and technical analysis on high-ranked stocks online for two decades. Through FACTBASEDINVESTING.COM, Kenneth provides educational articles, news, market commentary, and other information regarding proven investment systems that work in good times and bad.
Comments contained in the body of this report are technical opinions only and are not necessarily those of Gruneisen Growth Corp. The material herein has been obtained from sources believed to be reliable and accurate, however, its accuracy and completeness cannot be guaranteed. Our firm, employees, and customers may effect transactions, including transactions contrary to any recommendation herein, or have positions in the securities mentioned herein or options with respect thereto. Any recommendation contained in this report may not be suitable for all investors and it is not to be deemed an offer or solicitation on our part with respect to the purchase or sale of any securities. |
|
 |
Biotech Index Healthier Than Weak Leading Indicators
Kenneth J. Gruneisen - Passed the CAN SLIM® Master's Exam
The Internet Index ($IIX +0.58%) led then tech sector while the Networking Index ($NWX +0.04%) ended flat and the Semiconductor Index ($SOX -0.85%) and Biotechnology Index ($BTK -0.65%) suffered losses. The Healthcare Index ($HMO +0.03%) and Gold & Silver Index ($XAU -0.05%) finished flat and energy-linked indexes traded with no distinct bias as the Oil Services Index ($OSX -0.26%) inched lower and the Integrated Oil Index ($XOI +0.14%) inched higher. The Retail Index ($RLX -0.16%), Broker/Dealer Index ($XBD -0.23%), and Bank Index ($BKX +0.10%) also showed very little change.
Charts courtesy www.stockcharts.com
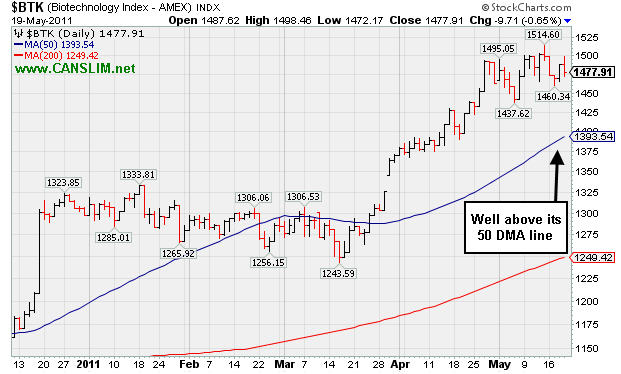
PICTURED: The Biotechnology Index ($BTK -0.65%) is consolidating well above its rising 50-day moving average line. These are characteristic of a strong group that remains in healthy shape. This contrasts greatly with the financial indexes, leading indicators which recent reports have shown (read here) struggling below their 50 and 200 DMA lines.
| Oil Services |
$OSX |
264.82 |
-0.70 |
-0.26% |
+8.04% |
| Healthcare |
$HMO |
2,426.12 |
+0.70 |
+0.03% |
+43.39% |
| Integrated Oil |
$XOI |
1,290.86 |
+1.75 |
+0.14% |
+6.40% |
| Semiconductor |
$SOX |
433.87 |
-3.72 |
-0.85% |
+5.35% |
| Networking |
$NWX |
322.44 |
+0.13 |
+0.04% |
+14.93% |
| Internet |
$IIX |
320.65 |
+1.85 |
+0.58% |
+4.20% |
| Broker/Dealer |
$XBD |
116.11 |
-0.27 |
-0.23% |
-4.45% |
| Retail |
$RLX |
538.68 |
-0.85 |
-0.16% |
+5.96% |
| Gold & Silver |
$XAU |
198.54 |
-0.09 |
-0.05% |
-12.38% |
| Bank |
$BKX |
50.60 |
+0.05 |
+0.10% |
-3.08% |
| Biotech |
$BTK |
1,477.91 |
-9.71 |
-0.65% |
+13.89% |
|
|
|
 |
50-Day Moving Average Line Tested This Week
Kenneth J. Gruneisen - Passed the CAN SLIM® Master's Exam
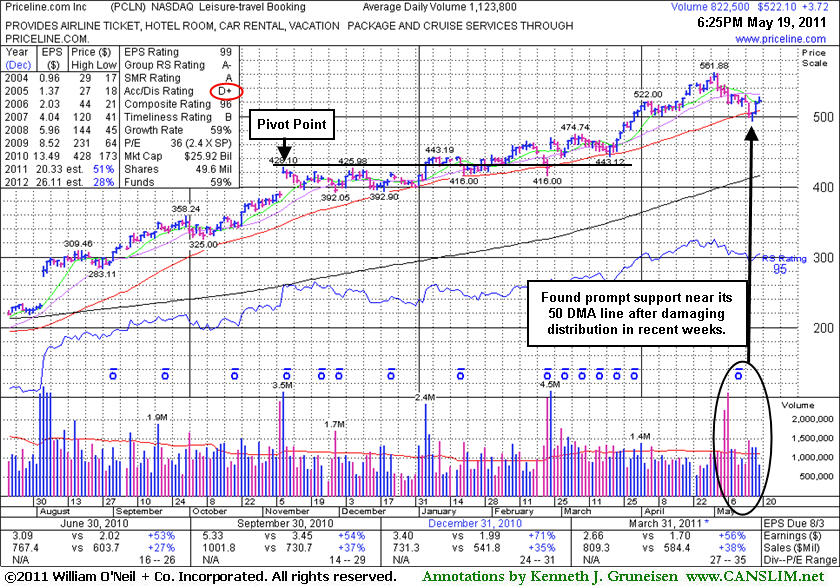
Priceline.com Inc. (PCLN +$3.72 or +0.72% to $522.10) posted a small gain today on light volume. Technically, it found support at its 50-day moving average (DMA) line this week and posted gains with slightly above average volume. That short-term average has been a reliable support level this year. It is now -7.1% off its 52-week high, and any subsequent violation of the recent chart low ($493.67 on 5/17/11) would raise more serious concerns and trigger a worrisome technical sell signal. It could go on to produce more climactic gains, but disciplined investors know that it is usually best to avoid chasing extended stocks and watch for a sound base pattern and convincing technical buy signal. Patient investors may watch for a subsequent base to possibly form and be noted in the weeks ahead. If so, it will be noted and its color code will be changed to yellow again when a new pivot point is cited.
Distributional pressure in recent weeks ate into the gains it had tallied since its last appearance in this FSU section with an annotated graph on 4/20/11 under the headline, "Extended Leader Already Familiar Among Institutional Crowd", when it went on and rallied as high as $561.88. Keep in mind, the investment system's biggest winning models were typically held by at least a few mutual funds and attracting many others. However, once a stock is very heavily owned by a long list of mutual funds, as is now the case with PCLN, investors should be especially cautious and alert for any technical sell signals or fundamental disappointments which could prompt a rush for the exits. The number of top-rated funds owning its shares rose from 1,348 in Sep '10 to 1,523 in Mar '11, and increasing interest is an encouraging sign concerning the I criteria.
|
|
|
Color Codes Explained :
Y - Better candidates highlighted by our
staff of experts.
G - Previously featured
in past reports as yellow but may no longer be buyable under the
guidelines.
***Last / Change / Volume data in this table is the closing quote data***
Symbol/Exchange
Company Name
Industry Group |
PRICE |
CHANGE
(%Change) |
Day High |
Volume
(% DAV)
(% 50 day avg vol) |
52 Wk Hi
% From Hi |
Featured
Date |
Price
Featured |
Pivot Featured |
|
Max Buy |
CMG
-
NYSE
Chipotle Mexican Grill
LEISURE - Restaurants
|
$281.12
|
+2.37
0.85% |
$282.61
|
538,907
47.43% of 50 DAV
50 DAV is 1,136,100
|
$289.35
-2.84%
|
4/1/2011
|
$274.00
|
PP = $275.10
|
|
MB = $288.86
|
Most Recent Note - 5/17/2011 6:03:08 PM
G - Perched only -5.1% off its 52-week high with no resistance due to overhead supply, but it has not formed a sound base after negating latest breakout. See latest FSU analysis for details and a new annotated graph.
>>> The latest Featured Stock Update with an annotated graph appeared on 5/17/2011. Click here.
View all notes |
Alert me of new notes |
CANSLIM.net Company Profile |
SEC |
Zacks Reports |
StockTalk |
News |
Chart |
Request a new note
C
A N
S L
I M


|
CTSH
-
NASDAQ
Cognizant Tech Sol Cl A
COMPUTER SOFTWARE and SERVICES - Business Software and Services
|
$73.69
|
+0.32
0.44% |
$73.95
|
2,904,743
116.34% of 50 DAV
50 DAV is 2,496,700
|
$83.48
-11.73%
|
2/7/2011
|
$75.09
|
PP = $76.46
|
|
MB = $80.28
|
 Most Recent Note - 5/19/2011 5:16:37 PM
G - Considerable loss today with (lighter) near average volume, closing -11.7% off its all-time high. Recently slumping toward prior lows in the $70.50 range and its 200 DMA line defining important long-term chart support to watch. Overhead supply up through the $83 level may hinder upward progress for the near term.
>>> The latest Featured Stock Update with an annotated graph appeared on 5/16/2011. Click here.
View all notes |
Alert me of new notes |
CANSLIM.net Company Profile |
SEC |
Zacks Reports |
StockTalk |
News |
Chart |
Request a new note
C
A N
S L
I M
|
EZPW
-
NASDAQ
Ezcorp Inc Cl A
SPECIALTY RETAIL - Specialty Retail, Other
|
$31.06
|
+0.68
2.22% |
$31.22
|
340,769
95.88% of 50 DAV
50 DAV is 355,400
|
$33.08
-6.12%
|
2/18/2011
|
$27.94
|
PP = $30.04
|
|
MB = $31.54
|
Most Recent Note - 5/19/2011 5:10:19 PM
G - Today's gain with heavier (near average) volume continued its healthy consolidation above its 50 DMA line. It has not formed a sound new base pattern. Recent lows define important nearby chart support to watch where technical violations would raise more serious concerns.
>>> The latest Featured Stock Update with an annotated graph appeared on 5/10/2011. Click here.
View all notes |
Alert me of new notes |
CANSLIM.net Company Profile |
SEC |
Zacks Reports |
StockTalk |
News |
Chart |
Request a new note
C
A N
S L
I M
|
FOSL
-
NASDAQ
Fossil Inc
CONSUMER DURABLES - Recreational Goods, Other
|
$104.98
|
+2.85
2.79% |
$105.34
|
713,670
82.23% of 50 DAV
50 DAV is 867,900
|
$107.54
-2.38%
|
2/1/2011
|
$73.30
|
PP = $74.44
|
|
MB = $78.16
|
Most Recent Note - 5/19/2011 5:08:40 PM
G - Still holding its ground stubbornly since its considerable gap up gain on 5/10/11 for a new all-time high, extended from any sound base. Prior highs near $96 define initial support to watch above its 50 DMA line.
>>> The latest Featured Stock Update with an annotated graph appeared on 5/2/2011. Click here.
View all notes |
Alert me of new notes |
CANSLIM.net Company Profile |
SEC |
Zacks Reports |
StockTalk |
News |
Chart |
Request a new note
C
A N
S L
I M
|
HMSY
-
NASDAQ
H M S Holdings Corp
COMPUTER SOFTWARE and SERVICES - Healthcare Information Service
|
$77.78
|
+0.21
0.27% |
$78.24
|
157,135
94.43% of 50 DAV
50 DAV is 166,400
|
$84.82
-8.30%
|
11/19/2010
|
$61.89
|
PP = $63.01
|
|
MB = $66.16
|
Most Recent Note - 5/18/2011 5:29:06 PM
G - Gain today on near average volume, rallying toward its 50 DMA line which may now act as resistance. A rally above it would improve its technical stance. Deterioration below its recent chart low ($73.27) would raise more serious concerns and trigger an additional sell signal.
>>> The latest Featured Stock Update with an annotated graph appeared on 4/26/2011. Click here.
View all notes |
Alert me of new notes |
CANSLIM.net Company Profile |
SEC |
Zacks Reports |
StockTalk |
News |
Chart |
Request a new note
C
A N
S L
I M
|
Symbol/Exchange
Company Name
Industry Group |
PRICE |
CHANGE
(%Change) |
Day High |
Volume
(% DAV)
(% 50 day avg vol) |
52 Wk Hi
% From Hi |
Featured
Date |
Price
Featured |
Pivot Featured |
|
Max Buy |
HS
-
NYSE
Healthspring Inc
HEALTH SERVICES - Health Care Plans
|
$44.27
|
+0.03
0.07% |
$45.11
|
661,794
69.30% of 50 DAV
50 DAV is 955,000
|
$44.87
-1.34%
|
3/22/2011
|
$38.29
|
PP = $38.85
|
|
MB = $40.79
|
Most Recent Note - 5/18/2011 4:56:15 PM
G - Finished at a new high close with a gain on light volume today. It is extended from any sound base pattern. Prior highs define important chart support to watch along with its 50 DMA line in the $39-40 area. Violations would trigger technical sell signals.
>>> The latest Featured Stock Update with an annotated graph appeared on 4/21/2011. Click here.
View all notes |
Alert me of new notes |
CANSLIM.net Company Profile |
SEC |
Zacks Reports |
StockTalk |
News |
Chart |
Request a new note
C
A N
S L
I M
|
INFA
-
NASDAQ
Informatica Corp
COMPUTER SOFTWARE and SERVICES - Business Software and Services
|
$54.89
|
+0.01
0.02% |
$55.52
|
908,994
83.96% of 50 DAV
50 DAV is 1,082,600
|
$56.49
-2.83%
|
3/24/2011
|
$50.04
|
PP = $49.86
|
|
MB = $52.35
|
Most Recent Note - 5/18/2011 4:24:09 PM
G - Considerable gain today with above average volume. It has not formed a sound new base pattern. Prior highs in the $49 area and its 50 DMA line, important chart support to watch. Subsequent violations would trigger technical sell signals.
>>> The latest Featured Stock Update with an annotated graph appeared on 4/27/2011. Click here.
View all notes |
Alert me of new notes |
CANSLIM.net Company Profile |
SEC |
Zacks Reports |
StockTalk |
News |
Chart |
Request a new note
C
A N
S L
I M
|
LULU
-
NASDAQ
Lululemon Athletica
MANUFACTURING - Textile Manufacturing
|
$97.24
|
-0.91
-0.93% |
$99.00
|
1,074,295
50.77% of 50 DAV
50 DAV is 2,115,800
|
$102.83
-5.44%
|
5/18/2011
|
$98.15
|
PP = $102.93
|
|
MB = $108.08
|
Most Recent Note - 5/18/2011 4:47:05 PM
Y - Volume totals have been cooling and lighter than average in recent weeks while this high-ranked Retail-Apparel firm has been consolidating near its all-time highs. Color code is changed to yellow with new pivot point cited based on a "square box" base pattern formed since its 4/21/11 high. Its 50 DMA line defines support above prior highs in the $85 area, important levels to watch on pullbacks.
>>> The latest Featured Stock Update with an annotated graph appeared on 5/3/2011. Click here.
View all notes |
Alert me of new notes |
CANSLIM.net Company Profile |
SEC |
Zacks Reports |
StockTalk |
News |
Chart |
Request a new note
C
A N
S L
I M
|
MG
-
NYSE
Mistras Group Inc
DIVERSIFIED SERVICES - Bulding and Faci;ity Management Services
|
$16.63
|
-0.05
-0.30% |
$16.79
|
52,094
28.70% of 50 DAV
50 DAV is 181,500
|
$18.46
-9.91%
|
3/15/2011
|
$15.48
|
PP = $15.90
|
|
MB = $16.70
|
Most Recent Note - 5/19/2011 5:31:03 PM
G - Completed a new Public Offering recently and it is now lingering below its 50 DMA line with volume totals cooling. Gains above that short-term average would help its outlook, technically, meanwhile the recent low ($15.44 on 5/05/11) defines the next chart support.
>>> The latest Featured Stock Update with an annotated graph appeared on 5/12/2011. Click here.
View all notes |
Alert me of new notes |
CANSLIM.net Company Profile |
SEC |
Zacks Reports |
StockTalk |
News |
Chart |
Request a new note
C
A N
S L
I M
|
MWIV
-
NASDAQ
M W I Veterinary Supply
HEALTH SERVICES - Medical Instruments and; Supplies
|
$82.70
|
-0.15
-0.18% |
$83.34
|
70,024
71.75% of 50 DAV
50 DAV is 97,600
|
$86.99
-4.93%
|
11/4/2010
|
$61.79
|
PP = $59.60
|
|
MB = $62.58
|
Most Recent Note - 5/19/2011 5:32:05 PM
G - Hovering in a tight trading range near its all-time high with volume totals cooling since 5/05/11 while stubbornly holding its ground. It has not formed a sound base pattern. Its 50 DMA line defines important support to watch.
>>> The latest Featured Stock Update with an annotated graph appeared on 5/5/2011. Click here.
View all notes |
Alert me of new notes |
CANSLIM.net Company Profile |
SEC |
Zacks Reports |
StockTalk |
News |
Chart |
Request a new note
C
A N
S L
I M
|
Symbol/Exchange
Company Name
Industry Group |
PRICE |
CHANGE
(%Change) |
Day High |
Volume
(% DAV)
(% 50 day avg vol) |
52 Wk Hi
% From Hi |
Featured
Date |
Price
Featured |
Pivot Featured |
|
Max Buy |
OPNT
-
NASDAQ
Opnet Technologies
INTERNET - Internet Software and Services
|
$38.78
|
+0.09
0.23% |
$39.37
|
43,006
32.65% of 50 DAV
50 DAV is 131,700
|
$42.51
-8.77%
|
5/11/2011
|
$41.21
|
PP = $40.50
|
|
MB = $42.53
|
Most Recent Note - 5/18/2011 5:10:48 PM
G - Gain today on light volume helped it make a stand at its 50 DMA line. Concerns were raised after it slumped more than -7% below its pivot point and undercut its prior high close ($39.44 on 4/01/11). Its color code was changed to green after it completely negated its latest breakout.
>>> The latest Featured Stock Update with an annotated graph appeared on 5/11/2011. Click here.
View all notes |
Alert me of new notes |
CANSLIM.net Company Profile |
SEC |
Zacks Reports |
StockTalk |
News |
Chart |
Request a new note
C
A N
S L
I M
|
PCLN
-
NASDAQ
Priceline.Com Inc
INTERNET - Internet Software and Services
|
$522.10
|
+3.72
0.72% |
$527.50
|
823,746
73.32% of 50 DAV
50 DAV is 1,123,500
|
$561.88
-7.08%
|
1/3/2011
|
$399.55
|
PP = $428.20
|
|
MB = $449.61
|
Most Recent Note - 5/19/2011 6:48:09 PM
G - Technically, it found support at its 50 DMA line this week. That short-term average has been a reliable support level this year. See the latest FSU analysis for details and a new annotated graph.
>>> The latest Featured Stock Update with an annotated graph appeared on 5/19/2011. Click here.
View all notes |
Alert me of new notes |
CANSLIM.net Company Profile |
SEC |
Zacks Reports |
StockTalk |
News |
Chart |
Request a new note
C
A N
S L
I M
|
RAX
-
NYSE
Rackspace Hosting Inc
INTERNET - Internet Software and; Services
|
$42.72
|
+0.39
0.92% |
$43.37
|
1,414,454
80.50% of 50 DAV
50 DAV is 1,757,100
|
$46.50
-8.12%
|
3/16/2011
|
$36.28
|
PP = $40.72
|
|
MB = $42.76
|
Most Recent Note - 5/18/2011 4:52:25 PM
G - Gains this week helped it make a stand near its 50 DMA line. It has not formed a sound new base. Deterioration below its short-term average and recent chart low ($38.84) would trigger a more worrisome technical sell signals.
>>> The latest Featured Stock Update with an annotated graph appeared on 5/13/2011. Click here.
View all notes |
Alert me of new notes |
CANSLIM.net Company Profile |
SEC |
Zacks Reports |
StockTalk |
News |
Chart |
Request a new note
C
A N
S L
I M
|
TIBX
-
NASDAQ
Tibco Software Inc
COMPUTER SOFTWARE and SERVICES - Business Software and Services
|
$28.86
|
-0.10
-0.33% |
$29.24
|
1,702,256
64.53% of 50 DAV
50 DAV is 2,638,000
|
$30.75
-6.16%
|
3/18/2011
|
$23.88
|
PP = $26.04
|
|
MB = $27.34
|
Most Recent Note - 5/18/2011 6:43:06 PM
G - Volume totals have been cooling while consolidating above its 50 DMA line, extended from a sound base pattern. Technically, that short-term average and recent low ($27.17) mark important chart support levels to watch where violations may trigger sell signals. See the latest FSU analysis for details and a new annotated graph.
>>> The latest Featured Stock Update with an annotated graph appeared on 5/18/2011. Click here.
View all notes |
Alert me of new notes |
CANSLIM.net Company Profile |
SEC |
Zacks Reports |
StockTalk |
News |
Chart |
Request a new note
C
A N
S L
I M
|
ULTA
-
NASDAQ
Ulta Salon Cosm & Frag
SPECIALTY RETAIL - Specialty Retail, Other
|
$53.45
|
-0.32
-0.60% |
$54.10
|
496,155
83.18% of 50 DAV
50 DAV is 596,500
|
$56.87
-6.01%
|
1/6/2011
|
$36.12
|
PP = $37.34
|
|
MB = $39.21
|
Most Recent Note - 5/18/2011 4:53:57 PM
G - Posted a small gain on light volume today. It is extended from any sound base pattern, and its 50 DMA line (now $50.22) defines chart support to watch where a violation may trigger a technical sell signal.
>>> The latest Featured Stock Update with an annotated graph appeared on 4/28/2011. Click here.
View all notes |
Alert me of new notes |
CANSLIM.net Company Profile |
SEC |
Zacks Reports |
StockTalk |
News |
Chart |
Request a new note
C
A N
S L
I M
|
Symbol/Exchange
Company Name
Industry Group |
PRICE |
CHANGE
(%Change) |
Day High |
Volume
(% DAV)
(% 50 day avg vol) |
52 Wk Hi
% From Hi |
Featured
Date |
Price
Featured |
Pivot Featured |
|
Max Buy |
|
|
|
THESE ARE NOT BUY RECOMMENDATIONS!
Comments contained in the body of this report are technical
opinions only. The material herein has been obtained
from sources believed to be reliable and accurate, however,
its accuracy and completeness cannot be guaranteed.
This site is not an investment advisor, hence it does
not endorse or recommend any securities or other investments.
Any recommendation contained in this report may not
be suitable for all investors and it is not to be deemed
an offer or solicitation on our part with respect to
the purchase or sale of any securities. All trademarks,
service marks and trade names appearing in this report
are the property of their respective owners, and are
likewise used for identification purposes only.
This report is a service available
only to active Paid Premium Members.
You may opt-out of receiving report notifications
at any time. Questions or comments may be submitted
by writing to Premium Membership Services 665 S.E. 10 Street, Suite 201 Deerfield Beach, FL 33441-5634 or by calling 1-800-965-8307
or 954-785-1121.
|
|
|

