You are not logged in.
This means you
CAN ONLY VIEW reports that were published prior to Monday, April 14, 2025.
You
MUST UPGRADE YOUR MEMBERSHIP if you want to see any current reports.
AFTER MARKET UPDATE - FRIDAY, MAY 13TH, 2011
Previous After Market Report Next After Market Report >>>
|
|
|
|
DOW |
-100.17 |
12,595.75 |
-0.79% |
|
Volume |
898,915,620 |
-7% |
|
Volume |
1,871,089,450 |
-13% |
|
NASDAQ |
-34.57 |
2,828.47 |
-1.21% |
|
Advancers |
836 |
27% |
|
Advancers |
626 |
23% |
|
S&P 500 |
-10.88 |
1,337.77 |
-0.81% |
|
Decliners |
2,184 |
70% |
|
Decliners |
2,000 |
73% |
|
Russell 2000 |
-11.86 |
835.67 |
-1.40% |
|
52 Wk Highs |
182 |
|
|
52 Wk Highs |
93 |
|
|
S&P 600 |
-5.88 |
447.11 |
-1.30% |
|
52 Wk Lows |
22 |
|
|
52 Wk Lows |
50 |
|
|
 |
Breadth Negative While Leadership Narrows
Kenneth J. Gruneisen - Passed the CAN SLIM® Master's Exam
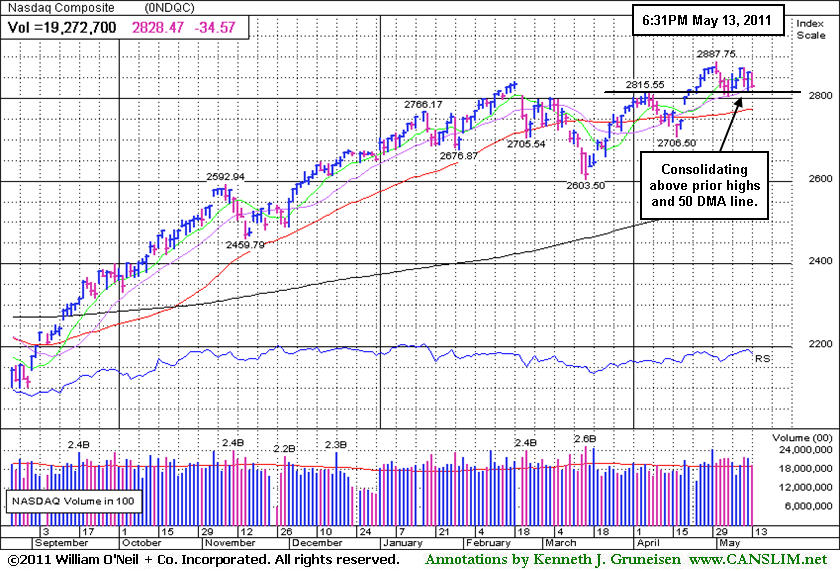
For the week, the Dow Jones Industrial Average was down -0.7%, the S&P 500 Index was down -0.2%, and the Nasdaq Composite Index ended gained about one point for the week to finish just above unchanged. On Friday's session declining issues beat advancers by 5-2 on the NYSE and by more than 3-1 on the Nasdaq. Volume totals were reported lighter than the prior session totals on the NYSE and on the Nasdaq exchange, which was a sign that institutional investors were not aggressively dumping shares. There were 49 high-ranked companies from the CANSLIM.net Leaders List that made new 52-week highs and appeared on the CANSLIM.net BreakOuts Page, down from the total of 55 on the prior session. New 52-week highs outnumbered new 52-week lows on the NYSE and on the Nasdaq exchange. Healthspring Inc (HS +3.82%) was the biggest of the session's gainers included on the Featured Stocks Page as it gapped up for a solid gain with above average volume, finishing the session +118.18% up from when first featured in yellow less than 9 months ago in the 8/27/10 mid-day report at $19.91 and (read here).
The U.S. government forecast that Medicare funding will be insufficient in 2024, five years sooner than last year's outlook. The market shrugged off two economic reports. A report on consumer prices was in line with expectations. The April consumer price index rose 0.4%. Higher gasoline costs accounted for more than half the increase. Excluding food and energy, the gain was only 0.2%. A reading of May consumer sentiment by the University of Michigan was better than expected, but failed to give the market a lift.
Oil and metal prices continued their choppy trading, with oil closing below $100 per barrel. Technology and banking shares were also among the weakest groups. Reports that Osama bin Laden was preparing an attempt on President Obama's life corresponded with the market's decline to session lows.
Nvidia Corp (NVDA -10.93%), the graphics software company, sank on concerns about shrinking margins even though earnings at the company beat expectations. CA Technologies Inc (CA -8.62%), the second-largest maker of software for mainframe computers, reported earnings and sales that missed estimates and its shares suffered their biggest percentage drop since 2009. Yahoo! Inc (YHOO -3.61%) slumped on concerns the company might lose business in China following the spin-off of an online payment business. Citigroup Inc (C -2.1%) shares continued to fall after it announced it would reinstate a quarterly dividend of one cent per share.
PICTURED: The Nasdaq Composite Index is consolidating above prior highs and its 50-day moving average line.
|
 Kenneth J. Gruneisen started out as a licensed stockbroker in August 1987, a couple of months prior to the historic stock market crash that took the Dow Jones Industrial Average down -22.6% in a single day. He has published daily fact-based fundamental and technical analysis on high-ranked stocks online for two decades. Through FACTBASEDINVESTING.COM, Kenneth provides educational articles, news, market commentary, and other information regarding proven investment systems that work in good times and bad.
Comments contained in the body of this report are technical opinions only and are not necessarily those of Gruneisen Growth Corp. The material herein has been obtained from sources believed to be reliable and accurate, however, its accuracy and completeness cannot be guaranteed. Our firm, employees, and customers may effect transactions, including transactions contrary to any recommendation herein, or have positions in the securities mentioned herein or options with respect thereto. Any recommendation contained in this report may not be suitable for all investors and it is not to be deemed an offer or solicitation on our part with respect to the purchase or sale of any securities. |
|
 |
Worrisome Deterioration in Financial Groups Continues
Kenneth J. Gruneisen - Passed the CAN SLIM® Master's Exam
The Bank Index ($BKX -1.77%) slumped to a new 2011 low. The Broker/Dealer Index ($XBD -1.68%) sank near its 200-day moving average (DMA) line and finished at the year's second-to-worst close. Tech shares had a negative bias as the Semiconductor Index ($SOX -1.38%), Internet Index ($IIX -1.05%), and Networking Index ($NWX -0.94%) ended unanimously lower. The Biotechnology Index ($BTK -0.26%) held its ground better than the other tech sector indices and the Healthcare Index ($HMO +0.34%) eked out a small gain. The Retail Index ($RLX -0.74%) backpedaled and, and weakness weighed on commodity-linked groups as the Integrated Oil Index ($XOI -0.75%) and Gold & Silver Index ($XAU -0.68%) closed modestly lower.
Charts courtesy www.stockcharts.com
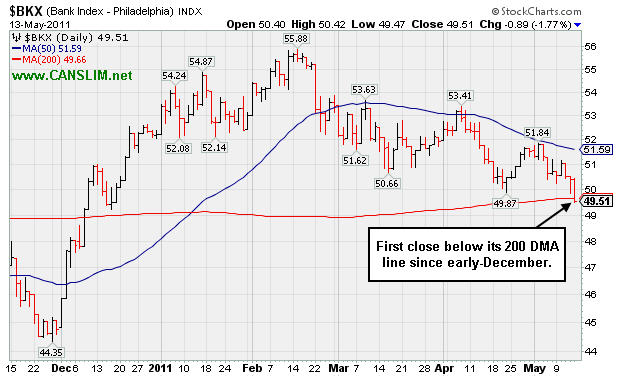
PICTURED 1: The Bank Index ($BKX -1.77%) violated its 200 DMA line, and weakness continues to abound in the financial group. Regular readers of this commentary know that these important "leading indicators", by their further deterioration, are posing a serious threat to any sustainable market advance.
Charts courtesy www.stockcharts.com
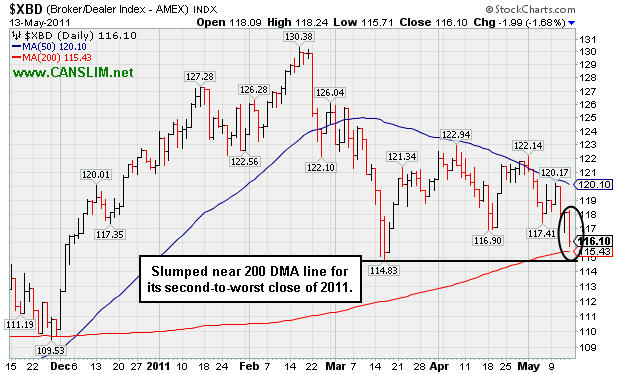
PICTURED 2: The Broker/Dealer Index ($XBD -1.68%) sank near its 200-day moving average (DMA) line and finished at the year's second-to-worst close.
| Oil Services |
$OSX |
262.86 |
+0.17 |
+0.06% |
+7.24% |
| Healthcare |
$HMO |
2,386.13 |
+8.12 |
+0.34% |
+41.03% |
| Integrated Oil |
$XOI |
1,282.53 |
-9.65 |
-0.75% |
+5.72% |
| Semiconductor |
$SOX |
440.95 |
-6.18 |
-1.38% |
+7.07% |
| Networking |
$NWX |
328.33 |
-3.12 |
-0.94% |
+17.03% |
| Internet |
$IIX |
321.83 |
-3.43 |
-1.05% |
+4.58% |
| Broker/Dealer |
$XBD |
116.10 |
-1.99 |
-1.68% |
-4.45% |
| Retail |
$RLX |
547.25 |
-4.09 |
-0.74% |
+7.65% |
| Gold & Silver |
$XAU |
195.26 |
-1.33 |
-0.68% |
-13.82% |
| Bank |
$BKX |
49.51 |
-0.89 |
-1.77% |
-5.17% |
| Biotech |
$BTK |
1,498.20 |
-3.97 |
-0.26% |
+15.46% |
|
|
|
 |
Positive Reversal Indicated Prompt Support Near Prior Resistance
Kenneth J. Gruneisen - Passed the CAN SLIM® Master's Exam
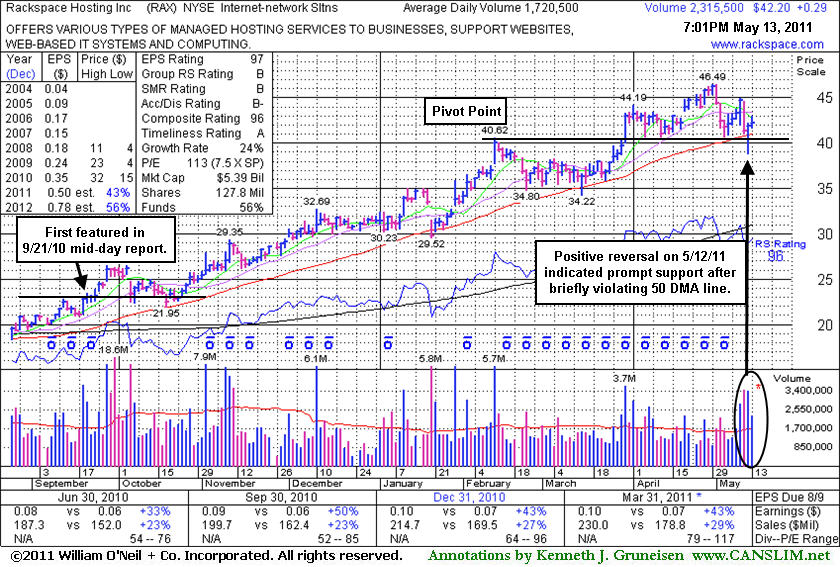
Rackspace Hosting Inc (RAX +$0.29 or +0.69% to $42.20) found prompt support and managed an impressive positive reversal on 5/12/11 after violating its 50-day moving average (DMA) line and undercutting prior highs near $40 with its early loss. More damaging losses would raise greater concerns, meanwhile it has not formed a sound new base. Since its last appearance in this FSU section on 4/18/11 under the headline, "High-Ranked Internet-Networking Solutions Firm Racked Up Big Gains", this high-ranked Internet-Networking Solutions firm had rallied to a new all-time high and then encountered distributional pressure. The above mentioned article noted - "The investment system permits investors to accumulate shares on light volume pullbacks, but research has proven that odds are best for a successful trade when buying is done as a stock is moving up in price rather than pulling back."
The past 4 quarterly earnings comparisons showed better than +25% increases. Its annual earnings history (A criteria) since trading began in 2008 has been good. Increasing institutional ownership (I criteria) is a reassuring sign, as the number of top-rated funds owning its shares rose from 317 in Mar '10 to 463 in Mar '11. RAX has traded up as much as +103.5% since first featured in yellow less than 8 months ago in the 9/21/10 mid-day report (read here) when noted - "Trading pennies from its 52-week high, with no overhead supply remaining to hinder its progress. A solid gain on the prior session reconfirmed a recent technical breakout above prior chart highs. Subsequent gains into new high territory with volume conviction could signal the beginning of a meaningful price advance."
|
|
|
Color Codes Explained :
Y - Better candidates highlighted by our
staff of experts.
G - Previously featured
in past reports as yellow but may no longer be buyable under the
guidelines.
***Last / Change / Volume data in this table is the closing quote data***
Symbol/Exchange
Company Name
Industry Group |
PRICE |
CHANGE
(%Change) |
Day High |
Volume
(% DAV)
(% 50 day avg vol) |
52 Wk Hi
% From Hi |
Featured
Date |
Price
Featured |
Pivot Featured |
|
Max Buy |
BIDU
-
NASDAQ
Baidu Inc Ads
INTERNET - Internet Information Providers
|
$131.28
|
-6.92
-5.01% |
$137.39
|
13,650,910
176.38% of 50 DAV
50 DAV is 7,739,500
|
$156.04
-15.87%
|
3/17/2011
|
$121.97
|
PP = $131.73
|
|
MB = $138.32
|
 Most Recent Note - 5/13/2011 4:11:59 PM
Today's large loss on heavy volume violated its 50 DMA line and undercut last week's low triggering a technical sell signal. Only a prompt rebound above that short-term average would help its outlook, technically. While it may find support at its prior high near $131, any further deterioration could trigger more worrisome technical sell signals. Based on weak action it will be dropped from the Featured Stocks list tonight
>>> The latest Featured Stock Update with an annotated graph appeared on 5/9/2011. Click here.
View all notes |
Alert me of new notes |
CANSLIM.net Company Profile |
SEC |
Zacks Reports |
StockTalk |
News |
Chart |
Request a new note
C
A N
S L
I M


|
CMG
-
NYSE
Chipotle Mexican Grill
LEISURE - Restaurants
|
$280.40
|
+4.52
1.64% |
$281.98
|
1,024,883
89.55% of 50 DAV
50 DAV is 1,144,500
|
$289.35
-3.09%
|
4/1/2011
|
$274.00
|
PP = $275.10
|
|
MB = $288.86
|
Most Recent Note - 5/13/2011 10:39:42 AM
G - Small gains on light volume this week have it quietly wedging toward prior highs, and no resistance remains due to overhead supply. Recently found support near its 50 DMA line after it negated its latest technical breakout.
>>> The latest Featured Stock Update with an annotated graph appeared on 4/13/2011. Click here.
View all notes |
Alert me of new notes |
CANSLIM.net Company Profile |
SEC |
Zacks Reports |
StockTalk |
News |
Chart |
Request a new note
C
A N
S L
I M
|
CTSH
-
NASDAQ
Cognizant Tech Sol Cl A
COMPUTER SOFTWARE and SERVICES - Business Software and Services
|
$76.47
|
-1.54
-1.97% |
$77.88
|
1,621,612
66.06% of 50 DAV
50 DAV is 2,454,700
|
$83.48
-8.40%
|
2/7/2011
|
$75.09
|
PP = $76.46
|
|
MB = $80.28
|
Most Recent Note - 5/13/2011 4:53:25 PM
G - Loss on light volume today led to its lowest close since 3/21/11. Its 50 DMA line has acted as resistance since its 5/03/11 gap down triggered a technical sell signal following earnings news. Overhead supply up through the $83 level may also hinder upward progress for the near term.
>>> The latest Featured Stock Update with an annotated graph appeared on 4/15/2011. Click here.
View all notes |
Alert me of new notes |
CANSLIM.net Company Profile |
SEC |
Zacks Reports |
StockTalk |
News |
Chart |
Request a new note
C
A N
S L
I M
|
EZPW
-
NASDAQ
Ezcorp Inc Cl A
SPECIALTY RETAIL - Specialty Retail, Other
|
$30.13
|
-0.96
-3.09% |
$31.18
|
245,775
68.98% of 50 DAV
50 DAV is 356,300
|
$33.08
-8.92%
|
2/18/2011
|
$27.94
|
PP = $30.04
|
|
MB = $31.54
|
Most Recent Note - 5/13/2011 3:22:33 PM
G - Volume totals have been cooling in recent weeks while consolidating above its 50 DMA line. Recent lows also define important nearby chart support to watch where technical violations would raise more serious concerns. It has not formed a sound new base pattern.
>>> The latest Featured Stock Update with an annotated graph appeared on 5/10/2011. Click here.
View all notes |
Alert me of new notes |
CANSLIM.net Company Profile |
SEC |
Zacks Reports |
StockTalk |
News |
Chart |
Request a new note
C
A N
S L
I M
|
FOSL
-
NASDAQ
Fossil Inc
CONSUMER DURABLES - Recreational Goods, Other
|
$105.34
|
-1.42
-1.33% |
$107.08
|
690,654
75.70% of 50 DAV
50 DAV is 912,300
|
$107.54
-2.04%
|
2/1/2011
|
$73.30
|
PP = $74.44
|
|
MB = $78.16
|
Most Recent Note - 5/13/2011 10:55:51 AM
G - Stubbornly holding its ground in a tight range with volume totals cooling since its considerable gap up gain on 5/10/11 for a new all-time high. It is extended from a sound base. Prior highs near $96 define initial support to watch above its 50 DMA line.
>>> The latest Featured Stock Update with an annotated graph appeared on 5/2/2011. Click here.
View all notes |
Alert me of new notes |
CANSLIM.net Company Profile |
SEC |
Zacks Reports |
StockTalk |
News |
Chart |
Request a new note
C
A N
S L
I M
|
Symbol/Exchange
Company Name
Industry Group |
PRICE |
CHANGE
(%Change) |
Day High |
Volume
(% DAV)
(% 50 day avg vol) |
52 Wk Hi
% From Hi |
Featured
Date |
Price
Featured |
Pivot Featured |
|
Max Buy |
HMSY
-
NASDAQ
H M S Holdings Corp
COMPUTER SOFTWARE and SERVICES - Healthcare Information Service
|
$77.30
|
-0.21
-0.27% |
$78.05
|
90,887
52.02% of 50 DAV
50 DAV is 174,700
|
$84.82
-8.87%
|
11/19/2010
|
$61.89
|
PP = $63.01
|
|
MB = $66.16
|
Most Recent Note - 5/13/2011 10:44:26 AM
G - Continuing to linger quietly below its 50 DMA line after damaging distribution in recent weeks. That short-term average may now act as resistance, while a rally above it would improve its technical stance. Deterioration below its recent chart low ($73.27) would raise more serious concerns and trigger an additional sell signal.
>>> The latest Featured Stock Update with an annotated graph appeared on 4/26/2011. Click here.
View all notes |
Alert me of new notes |
CANSLIM.net Company Profile |
SEC |
Zacks Reports |
StockTalk |
News |
Chart |
Request a new note
C
A N
S L
I M
|
HS
-
NYSE
Healthspring Inc
HEALTH SERVICES - Health Care Plans
|
$43.44
|
+1.60
3.82% |
$44.12
|
1,487,584
160.89% of 50 DAV
50 DAV is 924,600
|
$44.47
-2.32%
|
3/22/2011
|
$38.29
|
PP = $38.85
|
|
MB = $40.79
|
Most Recent Note - 5/13/2011 12:32:47 PM
G - Off its early highs after a small gap up today. It is extended from any sound base. Prior highs define important chart support to watch along with its 50 DMA line in the $39-40 area, where subsequent violations would trigger technical sell signals.
>>> The latest Featured Stock Update with an annotated graph appeared on 4/21/2011. Click here.
View all notes |
Alert me of new notes |
CANSLIM.net Company Profile |
SEC |
Zacks Reports |
StockTalk |
News |
Chart |
Request a new note
C
A N
S L
I M
|
INFA
-
NASDAQ
Informatica Corp
COMPUTER SOFTWARE and SERVICES - Business Software and Services
|
$54.14
|
+0.28
0.52% |
$54.45
|
1,668,291
160.78% of 50 DAV
50 DAV is 1,037,600
|
$56.49
-4.16%
|
3/24/2011
|
$50.04
|
PP = $49.86
|
|
MB = $52.35
|
Most Recent Note - 5/13/2011 4:56:23 PM
G - Posted small gains with above average volume fore the past 2 sessions while consolidating above prior highs in the $49 area and its 50 DMA line, important chart support to watch. Subsequent violations would trigger technical sell signals.
>>> The latest Featured Stock Update with an annotated graph appeared on 4/27/2011. Click here.
View all notes |
Alert me of new notes |
CANSLIM.net Company Profile |
SEC |
Zacks Reports |
StockTalk |
News |
Chart |
Request a new note
C
A N
S L
I M
|
LULU
-
NASDAQ
Lululemon Athletica
MANUFACTURING - Textile Manufacturing
|
$95.23
|
-1.81
-1.87% |
$97.09
|
1,158,010
54.09% of 50 DAV
50 DAV is 2,140,900
|
$102.83
-7.39%
|
3/28/2011
|
$68.11
|
PP = $85.38
|
|
MB = $89.65
|
Most Recent Note - 5/13/2011 4:43:57 PM
G - Volume totals have been cooling and lighter than average in recent weeks while this high-ranked Retail-Apparel firm has been consolidating near its all-time highs. Prior highs and its 50 DMA line in the $85 area define important chart support to watch.
>>> The latest Featured Stock Update with an annotated graph appeared on 5/3/2011. Click here.
View all notes |
Alert me of new notes |
CANSLIM.net Company Profile |
SEC |
Zacks Reports |
StockTalk |
News |
Chart |
Request a new note
C
A N
S L
I M
|
MG
-
NYSE
Mistras Group Inc
DIVERSIFIED SERVICES - Bulding and Faci;ity Management Services
|
$16.81
|
-0.39
-2.27% |
$17.22
|
80,388
44.07% of 50 DAV
50 DAV is 182,400
|
$18.46
-8.94%
|
3/15/2011
|
$15.48
|
PP = $15.90
|
|
MB = $16.70
|
Most Recent Note - 5/13/2011 4:48:51 PM
G - It has not formed a sound base pattern and today it slumped to a close below its 50 DMA line. Completed a new Public Offering on 5/05/11 and it is consolidating -8.9% off its 52-week high. See the latest FSU analysis for more details and a new annotated graph.
>>> The latest Featured Stock Update with an annotated graph appeared on 5/12/2011. Click here.
View all notes |
Alert me of new notes |
CANSLIM.net Company Profile |
SEC |
Zacks Reports |
StockTalk |
News |
Chart |
Request a new note
C
A N
S L
I M
|
Symbol/Exchange
Company Name
Industry Group |
PRICE |
CHANGE
(%Change) |
Day High |
Volume
(% DAV)
(% 50 day avg vol) |
52 Wk Hi
% From Hi |
Featured
Date |
Price
Featured |
Pivot Featured |
|
Max Buy |
MWIV
-
NASDAQ
M W I Veterinary Supply
HEALTH SERVICES - Medical Instruments and; Supplies
|
$83.02
|
-0.36
-0.43% |
$83.35
|
77,368
77.60% of 50 DAV
50 DAV is 99,700
|
$86.99
-4.56%
|
11/4/2010
|
$61.79
|
PP = $59.60
|
|
MB = $62.58
|
Most Recent Note - 5/13/2011 10:49:03 AM
G - Hovering near its all-time high with volume totals cooling since 5/05/11 while stubbornly holding its ground. It has not formed a sound base pattern. Its 50 DMA line defines important support to watch.
>>> The latest Featured Stock Update with an annotated graph appeared on 5/5/2011. Click here.
View all notes |
Alert me of new notes |
CANSLIM.net Company Profile |
SEC |
Zacks Reports |
StockTalk |
News |
Chart |
Request a new note
C
A N
S L
I M
|
OPNT
-
NASDAQ
Opnet Technologies
INTERNET - Internet Software and Services
|
$39.66
|
-1.33
-3.23% |
$41.17
|
67,767
49.76% of 50 DAV
50 DAV is 136,200
|
$42.51
-6.72%
|
5/11/2011
|
$41.21
|
PP = $40.50
|
|
MB = $42.53
|
Most Recent Note - 5/13/2011 3:31:24 PM
Y - Perched near its 52-week high, quietly consolidating near prior highs that define initial chart support to watch. Following solid earnings news it rallied from a late stage flat base above its 50 DMA line and triggered a technical buy signal on 5/10/11. Any close below its prior high close ($39.44 on 4/01/11) would completely negate its latest breakout and raise concerns. See the latest FSU analysis for more details and an annotated graph.
>>> The latest Featured Stock Update with an annotated graph appeared on 5/11/2011. Click here.
View all notes |
Alert me of new notes |
CANSLIM.net Company Profile |
SEC |
Zacks Reports |
StockTalk |
News |
Chart |
Request a new note
C
A N
S L
I M
|
PCLN
-
NASDAQ
Priceline.Com Inc
INTERNET - Internet Software and Services
|
$520.61
|
-3.35
-0.64% |
$530.68
|
842,370
73.99% of 50 DAV
50 DAV is 1,138,500
|
$561.88
-7.34%
|
1/3/2011
|
$399.55
|
PP = $428.20
|
|
MB = $449.61
|
Most Recent Note - 5/13/2011 10:52:22 AM
G - Following distributional losses it has failed to follow up with solid gains on volume. It has not formed a sound base pattern. Its 50 DMA line defines important support to watch.
>>> The latest Featured Stock Update with an annotated graph appeared on 4/20/2011. Click here.
View all notes |
Alert me of new notes |
CANSLIM.net Company Profile |
SEC |
Zacks Reports |
StockTalk |
News |
Chart |
Request a new note
C
A N
S L
I M
|
RAX
-
NYSE
Rackspace Hosting Inc
INTERNET - Internet Software and; Services
|
$42.20
|
+0.29
0.69% |
$42.97
|
2,319,542
134.82% of 50 DAV
50 DAV is 1,720,500
|
$46.50
-9.24%
|
3/16/2011
|
$36.28
|
PP = $40.72
|
|
MB = $42.76
|
Most Recent Note - 5/13/2011 10:28:31 AM
G - Found prompt support and managed an impressive positive reversal on the prior session after violating its 50 DMA line and undercutting prior highs near $40 with its early loss. More damaging losses would raise greater concerns, meanwhile it has not formed a sound new base.
>>> The latest Featured Stock Update with an annotated graph appeared on 5/13/2011. Click here.
View all notes |
Alert me of new notes |
CANSLIM.net Company Profile |
SEC |
Zacks Reports |
StockTalk |
News |
Chart |
Request a new note
C
A N
S L
I M
|
TIBX
-
NASDAQ
Tibco Software Inc
COMPUTER SOFTWARE and SERVICES - Business Software and Services
|
$29.49
|
-0.70
-2.32% |
$30.34
|
1,538,115
58.80% of 50 DAV
50 DAV is 2,616,000
|
$30.75
-4.10%
|
3/18/2011
|
$23.88
|
PP = $26.04
|
|
MB = $27.34
|
Most Recent Note - 5/13/2011 4:41:33 PM
G - Quietly holding its ground perched near its all-time high, technically extended from a sound base pattern. Its 50 DMA line and recent low ($27.17) define important chart support to watch where violations may trigger sell signals.
>>> The latest Featured Stock Update with an annotated graph appeared on 4/14/2011. Click here.
View all notes |
Alert me of new notes |
CANSLIM.net Company Profile |
SEC |
Zacks Reports |
StockTalk |
News |
Chart |
Request a new note
C
A N
S L
I M
|
Symbol/Exchange
Company Name
Industry Group |
PRICE |
CHANGE
(%Change) |
Day High |
Volume
(% DAV)
(% 50 day avg vol) |
52 Wk Hi
% From Hi |
Featured
Date |
Price
Featured |
Pivot Featured |
|
Max Buy |
ULTA
-
NASDAQ
Ulta Salon Cosm & Frag
SPECIALTY RETAIL - Specialty Retail, Other
|
$55.51
|
-0.40
-0.72% |
$56.87
|
427,540
71.48% of 50 DAV
50 DAV is 598,100
|
$55.95
-0.79%
|
1/6/2011
|
$36.12
|
PP = $37.34
|
|
MB = $39.21
|
Most Recent Note - 5/13/2011 4:57:49 PM
G - Finished the session with a small loss after quietly touching a new all-time high. It is extended from any sound base pattern. Its 50 DMA line defines chart support to watch well above prior highs.
>>> The latest Featured Stock Update with an annotated graph appeared on 4/28/2011. Click here.
View all notes |
Alert me of new notes |
CANSLIM.net Company Profile |
SEC |
Zacks Reports |
StockTalk |
News |
Chart |
Request a new note
C
A N
S L
I M
|
|
|
|
THESE ARE NOT BUY RECOMMENDATIONS!
Comments contained in the body of this report are technical
opinions only. The material herein has been obtained
from sources believed to be reliable and accurate, however,
its accuracy and completeness cannot be guaranteed.
This site is not an investment advisor, hence it does
not endorse or recommend any securities or other investments.
Any recommendation contained in this report may not
be suitable for all investors and it is not to be deemed
an offer or solicitation on our part with respect to
the purchase or sale of any securities. All trademarks,
service marks and trade names appearing in this report
are the property of their respective owners, and are
likewise used for identification purposes only.
This report is a service available
only to active Paid Premium Members.
You may opt-out of receiving report notifications
at any time. Questions or comments may be submitted
by writing to Premium Membership Services 665 S.E. 10 Street, Suite 201 Deerfield Beach, FL 33441-5634 or by calling 1-800-965-8307
or 954-785-1121.
|
|
|

