You are not logged in.
This means you
CAN ONLY VIEW reports that were published prior to Tuesday, April 15, 2025.
You
MUST UPGRADE YOUR MEMBERSHIP if you want to see any current reports.
AFTER MARKET UPDATE - THURSDAY, MAY 12TH, 2011
Previous After Market Report Next After Market Report >>>
|
|
|
|
DOW |
+65.89 |
12,695.92 |
+0.52% |
|
Volume |
968,435,730 |
-1% |
|
Volume |
2,156,049,960 |
-2% |
|
NASDAQ |
+17.98 |
2,863.04 |
+0.63% |
|
Advancers |
1,880 |
60% |
|
Advancers |
1,712 |
63% |
|
S&P 500 |
+6.57 |
1,348.65 |
+0.49% |
|
Decliners |
1,179 |
37% |
|
Decliners |
911 |
34% |
|
Russell 2000 |
+6.87 |
847.53 |
+0.82% |
|
52 Wk Highs |
172 |
|
|
52 Wk Highs |
113 |
|
|
S&P 600 |
+3.93 |
452.99 |
+0.88% |
|
52 Wk Lows |
36 |
|
|
52 Wk Lows |
55 |
|
|
 |
Positive Reversal For Major Averages After Early Weakness
Kenneth J. Gruneisen - Passed the CAN SLIM® Master's Exam
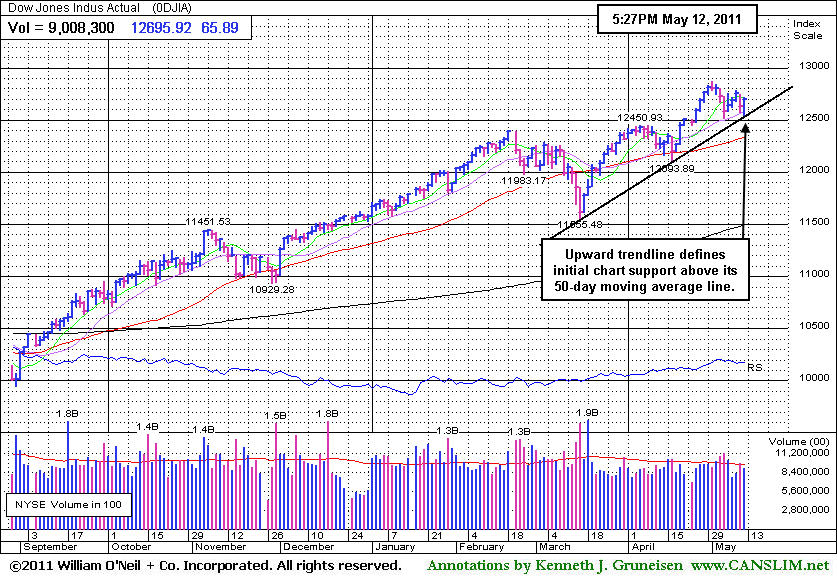
An appetite for risk reappeared on Thursday afternoon and the major stock averages shifted course at mid-day. The Dow Jones Industrial Average recovered from an early loss of 92 points and closed up 65 points, meanwhile the other major averages also enjoyed positive reversals after early weakness. Advancers outnumbered decliners by around 3-2 on the NYSE and by almost 2-1 on the Nasdaq exchange. Volume totals were reported lighter than the prior session totals on the NYSE and on the Nasdaq exchange, revealing a lack of great buying demand from institutional investors. There were 55 high-ranked companies from the CANSLIM.net Leaders List that made new 52-week highs and appeared on the CANSLIM.net BreakOuts Page, up from the total of 48 on the prior session. New 52-week highs still outnumbered new 52-week lows on the NYSE and on the Nasdaq exchange. Ulta Salon Cosmetics & Fragrances, Inc (ULTA +2.97%) was the biggest of the gainers included on the Featured Stocks Page as it rallied to a new high while finishing the session +145.11% up from when first featured in yellow 15 months ago in the 3/12/10 mid-day report at $22.81 and (read here).
Inflation fears remained a concern as the April producer price index rose 0.8%, more than expected, while China once again raised its reserve requirements for banks in an effort to keep prices in check. Reports on retail sales and initial jobless claims signaled the economic recovery remains weak. Sales increased 0.5%, less than expected. First-time claims for unemployment benefits remained at an elevated level.
Commodities stabilized and the dollar lost ground against the euro. Crude oil and gold prices rebounded to close higher, meanwhile silver continued its slide to a ten-week low. U.S. companies with substantial overseas sales benefited from the dollar weakness.
Technology stocks overcame a disappointing forecast from Cisco Systems Inc (CSCO -4.78%). Meanwhile, Symantech Corp (SYMC +5.20%) rallied after the security software company forecast higher sales. The Goldman Sachs Group Inc (GS -3.47%) weighed on the financial sector after a banking industry analyst cited litigation worries for his rating downgrade.
The May 2011 issue of CANSLIM.net News includes a comprehensive summary of market action, leading industry groups, the most action-worthy leaders, and more. Only upgraded members can access CANSLIM.net News.
PICTURED: The Dow Jones Industrial Average's upward trendline defines initial chart support above its 50-day moving average (DMA) line.
|
 Kenneth J. Gruneisen started out as a licensed stockbroker in August 1987, a couple of months prior to the historic stock market crash that took the Dow Jones Industrial Average down -22.6% in a single day. He has published daily fact-based fundamental and technical analysis on high-ranked stocks online for two decades. Through FACTBASEDINVESTING.COM, Kenneth provides educational articles, news, market commentary, and other information regarding proven investment systems that work in good times and bad.
Comments contained in the body of this report are technical opinions only and are not necessarily those of Gruneisen Growth Corp. The material herein has been obtained from sources believed to be reliable and accurate, however, its accuracy and completeness cannot be guaranteed. Our firm, employees, and customers may effect transactions, including transactions contrary to any recommendation herein, or have positions in the securities mentioned herein or options with respect thereto. Any recommendation contained in this report may not be suitable for all investors and it is not to be deemed an offer or solicitation on our part with respect to the purchase or sale of any securities. |
|
 |
Retail and Tech Sector Indices Led Gainers
Kenneth J. Gruneisen - Passed the CAN SLIM® Master's Exam
The Retail Index ($RLX +1.00%) and tech sector underpinned the major averages' advance on Thursday as the Networking Index ($NWX +0.44%), Internet Index ($IIX +0.65%), Biotechnology Index ($BTK +1.19%), and Semiconductor Index ($SOX +1.42%) posted unanimous gains. Defensive groups including the Healthcare Index ($HMO -0.81%) and Gold & Silver Index ($XAU -0.27%) slumped. Energy-related shares were mixed and mostly indecisive as the Oil Services Index ($OSX +0.72%) posed a gain and the Integrated Oil Index ($XOI -0.53%) finished modestly lower. The Broker/Dealer Index ($XBD +0.03%) held its ground and the Bank Index ($BKX -0.24%) edged lower, and both financial indexes (leading indicators) are still failing to offer any encouraging improvement.
Charts courtesy www.stockcharts.com
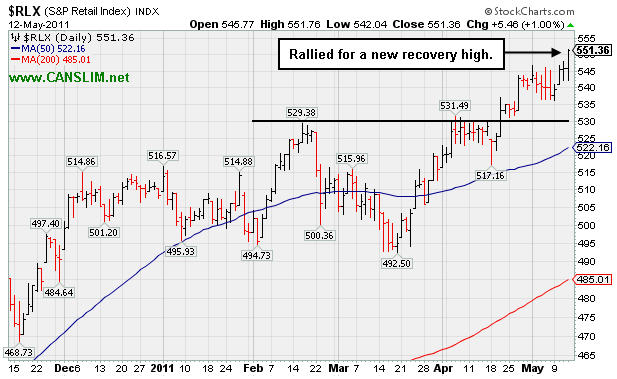
PICTURED: The Retail Index ($RLX +1.00%) rallied to a new recovery high. Pundits may speak of high unemployment rates and the adverse impact of high gasoline prices, but regardless of those concerns the consumer is still alive and spending. Since ordinary consumers account for about two thirds of the US economy, the strength the retail index has recently shown is viewed as a reassuring sign for investors.
| Oil Services |
$OSX |
262.69 |
+1.88 |
+0.72% |
+7.17% |
| Healthcare |
$HMO |
2,378.01 |
-19.41 |
-0.81% |
+40.55% |
| Integrated Oil |
$XOI |
1,292.18 |
-6.92 |
-0.53% |
+6.51% |
| Semiconductor |
$SOX |
447.13 |
+6.24 |
+1.42% |
+8.57% |
| Networking |
$NWX |
331.45 |
+1.44 |
+0.44% |
+18.14% |
| Internet |
$IIX |
325.26 |
+2.09 |
+0.65% |
+5.70% |
| Broker/Dealer |
$XBD |
118.09 |
+0.03 |
+0.03% |
-2.82% |
| Retail |
$RLX |
551.34 |
+5.44 |
+1.00% |
+8.45% |
| Gold & Silver |
$XAU |
196.59 |
-0.53 |
-0.27% |
-13.24% |
| Bank |
$BKX |
50.40 |
-0.12 |
-0.24% |
-3.47% |
| Biotech |
$BTK |
1,502.18 |
+17.67 |
+1.19% |
+15.76% |
|
|
|
 |
Recent Public Offering Contributed To Volatility
Kenneth J. Gruneisen - Passed the CAN SLIM® Master's Exam
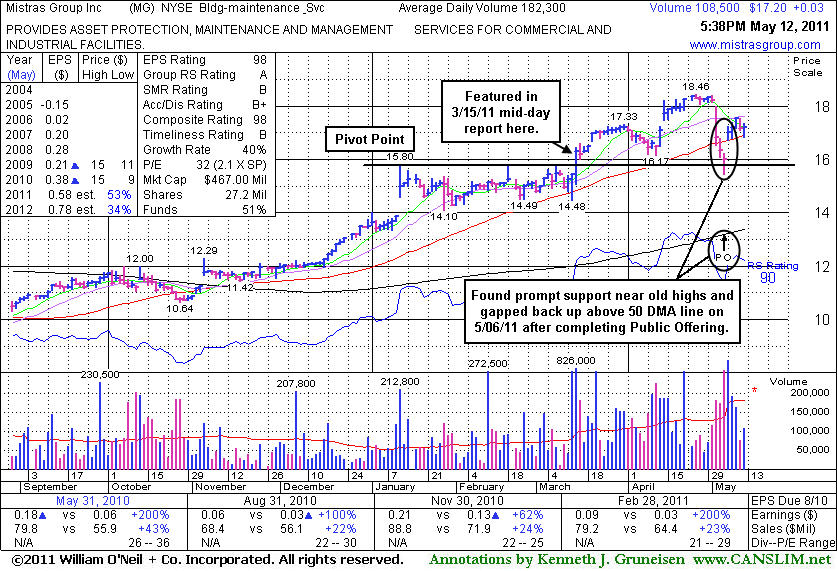
Mistras Group Inc (MG +$0.03 or +0.17% to $17.20) was up today with lighter than average volume, continuing its recent consolidation above its 50-day moving average (DMA) line. Immediately after its last appearance in this FSU section on 4/12/11 with an annotated graph under the headline, "Distributional 'Churning' Pressured and Limited Progress", this high-ranked Building - Maintenance Service firm spiked higher and tallied a streak of consecutive gains with above average volume.
It has not formed a sound base pattern since a sharp downdraft last week with damaging losses on heavy volume likely prompted cautious investors into selling. After completing a new Public Offering, the gap up on 5/06/11 promptly repaired its 50 DMA violation and technically improved its outlook. Recent quarterly comparisons showed solid sales and earnings increases versus the year earlier. Some resistance remains due to overhead supply up through the $18.40 level. Disciplined investors may watch for a new sound base to possibly form and be noted. Meanwhile, odds might be more favorable with a fresh breakout.
|
|
|
Color Codes Explained :
Y - Better candidates highlighted by our
staff of experts.
G - Previously featured
in past reports as yellow but may no longer be buyable under the
guidelines.
***Last / Change / Volume data in this table is the closing quote data***
Symbol/Exchange
Company Name
Industry Group |
PRICE |
CHANGE
(%Change) |
Day High |
Volume
(% DAV)
(% 50 day avg vol) |
52 Wk Hi
% From Hi |
Featured
Date |
Price
Featured |
Pivot Featured |
|
Max Buy |
AIXG
-
NASDAQ
Aixtron Se
ELECTRONICS - Semiconductor Equipment andamp; Mate
|
$38.88
|
-0.01
-0.03% |
$39.30
|
200,829
77.33% of 50 DAV
50 DAV is 259,700
|
$44.96
-13.52%
|
4/5/2011
|
$44.14
|
PP = $44.64
|
|
MB = $46.87
|
Most Recent Note - 5/11/2011 5:32:42 PM
Considerable loss today with near average volume led to its lowest close since January 5th. Its Relative Strength rank has slumped to a mediocre 68, below the 80+ guideline typically required for ideal buy candidates. It faces overhead supply up through the $45 level that may act as resistance. Based on weak action it will be dropped from the Featured Stocks list tonight.
>>> The latest Featured Stock Update with an annotated graph appeared on 5/6/2011. Click here.
View all notes |
Alert me of new notes |
CANSLIM.net Company Profile |
SEC |
Zacks Reports |
StockTalk |
News |
Chart |
Request a new note
C
A N
S L
I M


|
BIDU
-
NASDAQ
Baidu Inc Ads
INTERNET - Internet Information Providers
|
$138.20
|
-0.70
-0.50% |
$139.27
|
6,910,086
90.03% of 50 DAV
50 DAV is 7,675,600
|
$156.04
-11.43%
|
3/17/2011
|
$121.97
|
PP = $131.73
|
|
MB = $138.32
|
Most Recent Note - 5/11/2011 6:09:33 PM
G - Cooling off with quieter volume totals for the past week since halting its slide just above its 50 DMA line. Prior high near $131 defines additional support to watch below its short-term average.
>>> The latest Featured Stock Update with an annotated graph appeared on 5/9/2011. Click here.
View all notes |
Alert me of new notes |
CANSLIM.net Company Profile |
SEC |
Zacks Reports |
StockTalk |
News |
Chart |
Request a new note
C
A N
S L
I M
|
CMG
-
NYSE
Chipotle Mexican Grill
LEISURE - Restaurants
|
$275.88
|
+1.58
0.58% |
$278.91
|
922,617
80.49% of 50 DAV
50 DAV is 1,146,200
|
$289.35
-4.66%
|
4/1/2011
|
$274.00
|
PP = $275.10
|
|
MB = $288.86
|
Most Recent Note - 5/9/2011 5:38:22 PM
G - Small loss on light volume today. Recently found support near its 50 DMA line after it negated its latest technical breakout.
>>> The latest Featured Stock Update with an annotated graph appeared on 4/13/2011. Click here.
View all notes |
Alert me of new notes |
CANSLIM.net Company Profile |
SEC |
Zacks Reports |
StockTalk |
News |
Chart |
Request a new note
C
A N
S L
I M
|
CTSH
-
NASDAQ
Cognizant Tech Sol Cl A
COMPUTER SOFTWARE and SERVICES - Business Software and Services
|
$78.01
|
+1.26
1.64% |
$78.04
|
1,986,941
80.76% of 50 DAV
50 DAV is 2,460,400
|
$83.48
-6.55%
|
2/7/2011
|
$75.09
|
PP = $76.46
|
|
MB = $80.28
|
Most Recent Note - 5/11/2011 6:43:52 PM
G - Its 50 DMA line has acted as resistance since its 5/03/11 gap down triggered a technical sell signal following earnings news. Overhead supply up through the $83 level may also hinder upward progress for the near term.
>>> The latest Featured Stock Update with an annotated graph appeared on 4/15/2011. Click here.
View all notes |
Alert me of new notes |
CANSLIM.net Company Profile |
SEC |
Zacks Reports |
StockTalk |
News |
Chart |
Request a new note
C
A N
S L
I M
|
EZPW
-
NASDAQ
Ezcorp Inc Cl A
SPECIALTY RETAIL - Specialty Retail, Other
|
$31.09
|
+0.74
2.44% |
$31.17
|
243,227
68.32% of 50 DAV
50 DAV is 356,000
|
$33.08
-6.02%
|
2/18/2011
|
$27.94
|
PP = $30.04
|
|
MB = $31.54
|
 Most Recent Note - 5/12/2011 4:22:57 PM
G - Closed near the session high with light volume behind today's gain. Volume totals have been cooling in recent weeks while it has not formed a sound new base pattern. Its 50 DMA line and recent lows define important nearby chart support levels to watch where technical violations would raise more serious concerns.
>>> The latest Featured Stock Update with an annotated graph appeared on 5/10/2011. Click here.
View all notes |
Alert me of new notes |
CANSLIM.net Company Profile |
SEC |
Zacks Reports |
StockTalk |
News |
Chart |
Request a new note
C
A N
S L
I M
|
Symbol/Exchange
Company Name
Industry Group |
PRICE |
CHANGE
(%Change) |
Day High |
Volume
(% DAV)
(% 50 day avg vol) |
52 Wk Hi
% From Hi |
Featured
Date |
Price
Featured |
Pivot Featured |
|
Max Buy |
FOSL
-
NASDAQ
Fossil Inc
CONSUMER DURABLES - Recreational Goods, Other
|
$106.76
|
-0.08
-0.07% |
$107.54
|
917,422
101.12% of 50 DAV
50 DAV is 907,300
|
$107.38
-0.58%
|
2/1/2011
|
$73.30
|
PP = $74.44
|
|
MB = $78.16
|
Most Recent Note - 5/10/2011 12:20:32 PM
G - Gapped up today for a considerable volume-driven gain and new all-time high after reporting +62% earnings on +37% sales revenues for the quarter ended March 31, 2011 versus the year ago period. As previously noted - "It could produce more climactic gains, but it is extended from any sound base."
>>> The latest Featured Stock Update with an annotated graph appeared on 5/2/2011. Click here.
View all notes |
Alert me of new notes |
CANSLIM.net Company Profile |
SEC |
Zacks Reports |
StockTalk |
News |
Chart |
Request a new note
C
A N
S L
I M
|
HMSY
-
NASDAQ
H M S Holdings Corp
COMPUTER SOFTWARE and SERVICES - Healthcare Information Service
|
$77.51
|
-0.02
-0.03% |
$77.79
|
147,920
84.96% of 50 DAV
50 DAV is 174,100
|
$84.82
-8.62%
|
11/19/2010
|
$61.89
|
PP = $63.01
|
|
MB = $66.16
|
Most Recent Note - 5/9/2011 4:23:10 PM
G - Closed near the high end of its intra-day range today with a solid gain on above average volume. A subsequent rebound above its 50 DMA line (now $79.94) would help its outlook, but that short-term average may now act as resistance.
>>> The latest Featured Stock Update with an annotated graph appeared on 4/26/2011. Click here.
View all notes |
Alert me of new notes |
CANSLIM.net Company Profile |
SEC |
Zacks Reports |
StockTalk |
News |
Chart |
Request a new note
C
A N
S L
I M
|
HS
-
NYSE
Healthspring Inc
HEALTH SERVICES - Health Care Plans
|
$41.84
|
-1.06
-2.47% |
$42.71
|
1,140,390
125.26% of 50 DAV
50 DAV is 910,400
|
$44.47
-5.91%
|
3/22/2011
|
$38.29
|
PP = $38.85
|
|
MB = $40.79
|
Most Recent Note - 5/12/2011 4:17:00 PM
G - Gapped down today for a small loss with above average volume. It is extended from any sound base, and prior highs define important chart support to watch along with its 50 DMA line.
>>> The latest Featured Stock Update with an annotated graph appeared on 4/21/2011. Click here.
View all notes |
Alert me of new notes |
CANSLIM.net Company Profile |
SEC |
Zacks Reports |
StockTalk |
News |
Chart |
Request a new note
C
A N
S L
I M
|
INFA
-
NASDAQ
Informatica Corp
COMPUTER SOFTWARE and SERVICES - Business Software and Services
|
$53.86
|
+1.17
2.22% |
$54.28
|
1,684,725
163.69% of 50 DAV
50 DAV is 1,029,200
|
$56.49
-4.66%
|
3/24/2011
|
$50.04
|
PP = $49.86
|
|
MB = $52.35
|
Most Recent Note - 5/12/2011 4:21:43 PM
G - Overcame early weakness today after briefly dipping under its "max buy" level, ultimately posting a solid gain with above average volume for a positive reversal. Consolidating above prior highs in the $49 area and its 50 DMA line, important chart support to watch. Subsequent violations would trigger technical sell signals.
>>> The latest Featured Stock Update with an annotated graph appeared on 4/27/2011. Click here.
View all notes |
Alert me of new notes |
CANSLIM.net Company Profile |
SEC |
Zacks Reports |
StockTalk |
News |
Chart |
Request a new note
C
A N
S L
I M
|
LULU
-
NASDAQ
Lululemon Athletica
MANUFACTURING - Textile Manufacturing
|
$97.04
|
+0.37
0.38% |
$98.00
|
868,870
40.19% of 50 DAV
50 DAV is 2,162,100
|
$102.83
-5.63%
|
3/28/2011
|
$68.11
|
PP = $85.38
|
|
MB = $89.65
|
Most Recent Note - 5/11/2011 6:36:57 PM
G - Volume totals have been lighter than average in recent weeks while this high-ranked Retail-Apparel firm has been noted as extended from any sound base pattern. Prior highs and its 50 DMA line in the $85 area define important chart support to watch.
>>> The latest Featured Stock Update with an annotated graph appeared on 5/3/2011. Click here.
View all notes |
Alert me of new notes |
CANSLIM.net Company Profile |
SEC |
Zacks Reports |
StockTalk |
News |
Chart |
Request a new note
C
A N
S L
I M
|
Symbol/Exchange
Company Name
Industry Group |
PRICE |
CHANGE
(%Change) |
Day High |
Volume
(% DAV)
(% 50 day avg vol) |
52 Wk Hi
% From Hi |
Featured
Date |
Price
Featured |
Pivot Featured |
|
Max Buy |
MG
-
NYSE
Mistras Group Inc
DIVERSIFIED SERVICES - Bulding and Faci;ity Management Services
|
$17.20
|
+0.03
0.17% |
$17.37
|
113,441
62.23% of 50 DAV
50 DAV is 182,300
|
$18.46
-6.83%
|
3/15/2011
|
$15.48
|
PP = $15.90
|
|
MB = $16.70
|
Most Recent Note - 5/12/2011 6:10:51 PM
G - Since completing a new Public Offering it promptly repaired its 50 DMA violation, technically improving its outlook, however it has not formed a sound base pattern. See the latest FSU analysis for more details and a new annotated graph.
>>> The latest Featured Stock Update with an annotated graph appeared on 5/12/2011. Click here.
View all notes |
Alert me of new notes |
CANSLIM.net Company Profile |
SEC |
Zacks Reports |
StockTalk |
News |
Chart |
Request a new note
C
A N
S L
I M
|
MWIV
-
NASDAQ
M W I Veterinary Supply
HEALTH SERVICES - Medical Instruments and; Supplies
|
$83.38
|
+1.09
1.32% |
$83.62
|
78,064
78.14% of 50 DAV
50 DAV is 99,900
|
$86.99
-4.15%
|
11/4/2010
|
$61.79
|
PP = $59.60
|
|
MB = $62.58
|
Most Recent Note - 5/9/2011 4:29:50 PM
G - Holding its ground near its all-time high. Extended from any sound base pattern now, its 50 DMA line defines important support to watch. Reported earnings +34% on +28% sales for the quarter ended March 31st.
>>> The latest Featured Stock Update with an annotated graph appeared on 5/5/2011. Click here.
View all notes |
Alert me of new notes |
CANSLIM.net Company Profile |
SEC |
Zacks Reports |
StockTalk |
News |
Chart |
Request a new note
C
A N
S L
I M
|
OPNT
-
NASDAQ
Opnet Technologies
INTERNET - Internet Software and Services
|
$40.98
|
+0.67
1.66% |
$41.33
|
100,214
74.07% of 50 DAV
50 DAV is 135,300
|
$42.51
-3.60%
|
5/11/2011
|
$41.21
|
PP = $40.50
|
|
MB = $42.53
|
Most Recent Note - 5/11/2011 7:52:06 PM
Y - Pulled back today for a loss with above average volume and closed just below its pivot point, raising concerns with its weak finish after it was featured in yellow in the mid-day report. Following solid earnings news it rallied from a late stage flat base above its 50 DMA line and triggered a technical buy signal on the prior session. Recent quarters showed improving sales and earnings. Strength and leadership (L criteria) in the Computer Software - Database group is reassuring. Ownership by top-rated funds has also been on the rise, a reassuring sign concerning the I criteria. See the latest FSU analysis for more details and an annotated graph.
>>> The latest Featured Stock Update with an annotated graph appeared on 5/11/2011. Click here.
View all notes |
Alert me of new notes |
CANSLIM.net Company Profile |
SEC |
Zacks Reports |
StockTalk |
News |
Chart |
Request a new note
C
A N
S L
I M
|
PAY
-
NYSE
Verifone Systems Inc
COMPUTER HARDWARE - Transaction Automation Systems
|
$46.64
|
-3.36
-6.72% |
$51.02
|
14,347,113
575.96% of 50 DAV
50 DAV is 2,491,000
|
$58.88
-20.79%
|
4/29/2011
|
$54.73
|
PP = $58.98
|
|
MB = $61.93
|
Most Recent Note - 5/12/2011 4:13:42 PM
Finished near the middle of its intra-day range today with a considerable loss on very heavy volume after 3PM headlines announced news that the U.S. Justice Department filed a lawsuit to block this credit card swipe machine maker's proposed buy of smaller rival Hypercom Corp (HYC). The technical damage raised more serious concerns while it closed the session -20.8% off its 52-week high after violating last week's low. Subsequent gains above its 50 DMA line are needed for its outlook to improve, technically. It will be dropped from the Featured Stocks page tonight.
>>> The latest Featured Stock Update with an annotated graph appeared on 5/4/2011. Click here.
View all notes |
Alert me of new notes |
CANSLIM.net Company Profile |
SEC |
Zacks Reports |
StockTalk |
News |
Chart |
Request a new note
C
A N
S L
I M
|
PCLN
-
NASDAQ
Priceline.Com Inc
INTERNET - Internet Software and Services
|
$523.96
|
+2.97
0.57% |
$527.04
|
989,568
86.45% of 50 DAV
50 DAV is 1,144,700
|
$561.88
-6.75%
|
1/3/2011
|
$399.55
|
PP = $428.20
|
|
MB = $449.61
|
Most Recent Note - 5/9/2011 5:40:05 PM
G - Gain today halted its slide after a down week with damaging distributional losses. Its 50 DMA line defines important support to watch. Reported earnings +56% on +38% sales revenues fore the quarter ended March 31, 2011 versus the year ago period.
>>> The latest Featured Stock Update with an annotated graph appeared on 4/20/2011. Click here.
View all notes |
Alert me of new notes |
CANSLIM.net Company Profile |
SEC |
Zacks Reports |
StockTalk |
News |
Chart |
Request a new note
C
A N
S L
I M
|
Symbol/Exchange
Company Name
Industry Group |
PRICE |
CHANGE
(%Change) |
Day High |
Volume
(% DAV)
(% 50 day avg vol) |
52 Wk Hi
% From Hi |
Featured
Date |
Price
Featured |
Pivot Featured |
|
Max Buy |
RAX
-
NYSE
Rackspace Hosting Inc
INTERNET - Internet Software and; Services
|
$41.91
|
+0.59
1.43% |
$42.21
|
3,402,688
202.52% of 50 DAV
50 DAV is 1,680,200
|
$46.50
-9.86%
|
3/16/2011
|
$36.28
|
PP = $40.72
|
|
MB = $42.76
|
Most Recent Note - 5/12/2011 10:15:49 AM
G - Up from today's early lows after violating its 50 DMA line and undercutting prior highs near $40 with its early loss, raising more serious concerns. A considerable loss with heavier volume on 5/11/11 erased its 4 prior gains, and heavy volume without meaningful price progress was noted as a sign of distributional pressure.
>>> The latest Featured Stock Update with an annotated graph appeared on 4/18/2011. Click here.
View all notes |
Alert me of new notes |
CANSLIM.net Company Profile |
SEC |
Zacks Reports |
StockTalk |
News |
Chart |
Request a new note
C
A N
S L
I M
|
TIBX
-
NASDAQ
Tibco Software Inc
COMPUTER SOFTWARE and SERVICES - Business Software and Services
|
$30.19
|
+0.48
1.62% |
$30.30
|
1,875,790
71.99% of 50 DAV
50 DAV is 2,605,700
|
$30.75
-1.82%
|
3/18/2011
|
$23.88
|
PP = $26.04
|
|
MB = $27.34
|
Most Recent Note - 5/11/2011 6:14:16 PM
G - Perched near its all-time high, technically extended from a sound base pattern. Its 50 DMA line and recent low ($27.17) define important chart support to watch where violations may trigger sell signals.
>>> The latest Featured Stock Update with an annotated graph appeared on 4/14/2011. Click here.
View all notes |
Alert me of new notes |
CANSLIM.net Company Profile |
SEC |
Zacks Reports |
StockTalk |
News |
Chart |
Request a new note
C
A N
S L
I M
|
ULTA
-
NASDAQ
Ulta Salon Cosm & Frag
SPECIALTY RETAIL - Specialty Retail, Other
|
$55.91
|
+1.61
2.97% |
$55.95
|
400,445
66.86% of 50 DAV
50 DAV is 598,900
|
$55.70
0.38%
|
1/6/2011
|
$36.12
|
PP = $37.34
|
|
MB = $39.21
|
Most Recent Note - 5/12/2011 4:26:29 PM
G - Finished the session near its intra-day high while quietly climbing to a new all-time high with another gain on below average volume. It is extended from any sound base pattern. Its 50 DMA line defines chart support to watch well above prior highs.
>>> The latest Featured Stock Update with an annotated graph appeared on 4/28/2011. Click here.
View all notes |
Alert me of new notes |
CANSLIM.net Company Profile |
SEC |
Zacks Reports |
StockTalk |
News |
Chart |
Request a new note
C
A N
S L
I M
|
|
|
|
THESE ARE NOT BUY RECOMMENDATIONS!
Comments contained in the body of this report are technical
opinions only. The material herein has been obtained
from sources believed to be reliable and accurate, however,
its accuracy and completeness cannot be guaranteed.
This site is not an investment advisor, hence it does
not endorse or recommend any securities or other investments.
Any recommendation contained in this report may not
be suitable for all investors and it is not to be deemed
an offer or solicitation on our part with respect to
the purchase or sale of any securities. All trademarks,
service marks and trade names appearing in this report
are the property of their respective owners, and are
likewise used for identification purposes only.
This report is a service available
only to active Paid Premium Members.
You may opt-out of receiving report notifications
at any time. Questions or comments may be submitted
by writing to Premium Membership Services 665 S.E. 10 Street, Suite 201 Deerfield Beach, FL 33441-5634 or by calling 1-800-965-8307
or 954-785-1121.
|
|
|

