You are not logged in.
This means you
CAN ONLY VIEW reports that were published prior to Tuesday, July 9, 2024.
You
MUST UPGRADE YOUR MEMBERSHIP if you want to see any current reports.
AFTER MARKET UPDATE - THURSDAY, APRIL 25TH, 2024
Previous After Market Report Next After Market Report >>>
|
|
|
|
DOW |
-375.12 |
38,085.80 |
-0.98% |
|
Volume |
985,569,349 |
+6% |
|
Volume |
4,772,244,600 |
+0% |
|
NASDAQ |
-100.99 |
15,611.76 |
-0.64% |
|
Advancers |
810 |
29% |
|
Advancers |
1,449 |
35% |
|
S&P 500 |
-23.21 |
5,048.42 |
-0.46% |
|
Decliners |
1,950 |
71% |
|
Decliners |
2,729 |
65% |
|
Russell 2000 |
-14.31 |
1,981.12 |
-0.72% |
|
52 Wk Highs |
40 |
|
|
52 Wk Highs |
38 |
|
|
S&P 600 |
-10.57 |
1,274.18 |
-0.82% |
|
52 Wk Lows |
46 |
|
|
52 Wk Lows |
201 |
|
|
Since Wednesday April 10th members of FACTBASEDINVESTING.COM were cautioned as a shift in conditions (M criteria) signaled a market "correction". Use greater caution, raise cash and reduce exposure by selling any weakening stocks on a case-by-case basis. New buying efforts will be avoided by disciplined investors until a solid follow-through day is noted confirming a new uptrend.
|
 |
Major Indices Slumped With Clearly Negative Breadth
Kenneth J. Gruneisen - Passed the CAN SLIM® Master's Exam
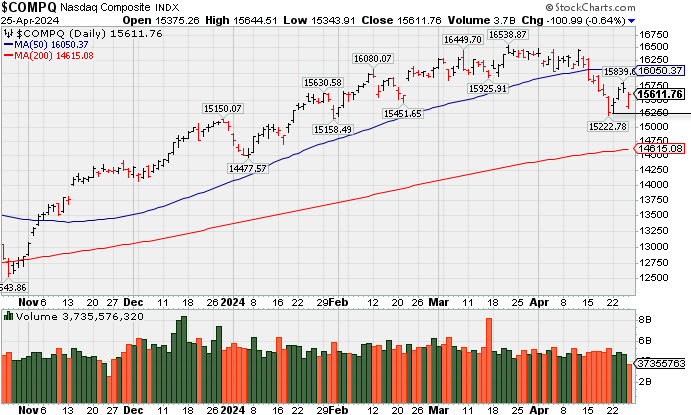
The major indices closed with declines, but staged a big recovery off their lows for the session. At their worst levels of the day, the S&P 500, Nasdaq Composite, and Dow Jones Industrial Average were down -1.6%, -2.3%, and -1.8%, respectively. Losses by the close ranged from -0.5% to -1.0%. Volume reported was higher than the prior session total on the NYSE and near the prior session total on the Nasdaq exchange. Breadth was negative as decliners led advancers by about a 5-2 margin on the NYSE and by nearly 2-1 on the Nasdaq exchange. There were 17 high-ranked companies from the Leaders List that hit new 52-week highs and were listed on the BreakOuts Page versus 31 on the prior session. New 52-week lows outnumbered new 52-week highs on the NYSE and on the Nasdaq exchange. The major indices recently signaled a market correction (M criteria). Greater caution is important for all investors until a follow-through day signals a new confirmed uptrend.
PICTURED: The Nasdaq Composite Index remains well below its 50-day moving average (DMA) line and it fell toward the recent low after 3 consecutiev gains. The window remains open for a follow-through day a as long as the Day 1 low is not violated.
A fresh $44 billion 7-yr note sale met solid demand. The Advance Q1 GDP report showed weaker growth and higher inflation, and the weekly jobless claims report showed ongoing strength in the labor market.
The market suffered with negative responses to earnings news from some widely held names including Meta Platforms (META -10.56%) and Dow components IBM (IBM -8.25%) and Caterpillar (CAT -7.02%).
The S&P 500 materials (+0.7%), energy (+0.5%), industrials (+0.3%), utilities (+0.3%), and information technology (+0.2%) sectors were all lower in the early going before closing with gains.
|
 Kenneth J. Gruneisen started out as a licensed stockbroker in August 1987, a couple of months prior to the historic stock market crash that took the Dow Jones Industrial Average down -22.6% in a single day. He has published daily fact-based fundamental and technical analysis on high-ranked stocks online for two decades. Through FACTBASEDINVESTING.COM, Kenneth provides educational articles, news, market commentary, and other information regarding proven investment systems that work in good times and bad.
Comments contained in the body of this report are technical opinions only and are not necessarily those of Gruneisen Growth Corp. The material herein has been obtained from sources believed to be reliable and accurate, however, its accuracy and completeness cannot be guaranteed. Our firm, employees, and customers may effect transactions, including transactions contrary to any recommendation herein, or have positions in the securities mentioned herein or options with respect thereto. Any recommendation contained in this report may not be suitable for all investors and it is not to be deemed an offer or solicitation on our part with respect to the purchase or sale of any securities. |
|
 |
Semiconductor and Gold & Silver Indexes Posted Standout Gains
Kenneth J. Gruneisen - Passed the CAN SLIM® Master's Exam
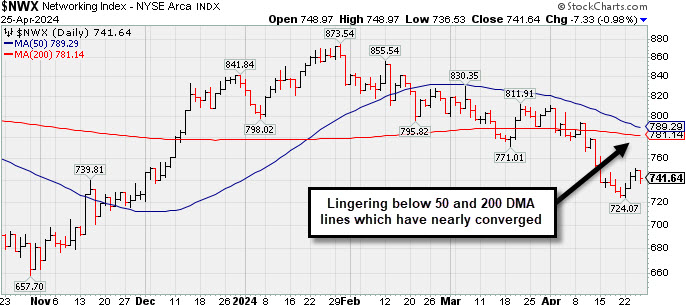
The Retail Index ($RLX -1.17%), Bank Index ($BKX -1.14%), and the Broker/Dealer Index ($XBD -0.33%) each slumped and had a negative impact on the major indices. The tech sector was mixed as the Semiconductor Index ($SOX +1.96%) rose but the Networking Index ($NWX -0.98%) and the Biotech Index ($BTK -1.73%) both lost ground. The Gold & Silver Index ($XAU +3.13%) posted a standout gain while the Integrated Oil Index ($XOI +0.55%) posted a smaller gain and the Oil Services Index ($OSX -0.07%) was little changed.
![]() PICTURED: The Networking Index ($NWX -0.98%) has recently been lingering below its 50-day and 200-day moving average (DMA) lines which have nealry converged.
| Oil Services |
$OSX |
88.44 |
-0.06 |
-0.07% |
+5.44% |
| Integrated Oil |
$XOI |
2,204.96 |
+12.07 |
+0.55% |
+18.39% |
| Semiconductor |
$SOX |
4,615.04 |
+88.84 |
+1.96% |
+10.53% |
| Networking |
$NWX |
741.64 |
-7.33 |
-0.98% |
-10.95% |
| Broker/Dealer |
$XBD |
593.75 |
-1.97 |
-0.33% |
+6.54% |
| Retail |
$RLX |
4,237.90 |
-50.33 |
-1.17% |
+8.98% |
| Gold & Silver |
$XAU |
137.22 |
+4.17 |
+3.13% |
+9.17% |
| Bank |
$BKX |
102.39 |
-1.17 |
-1.13% |
+6.63% |
| Biotech |
$BTK |
4,902.00 |
-86.39 |
-1.73% |
-9.54% |
|
|
|
 |
HUBS Testing 50-day Moving Average Line Again
Kenneth J. Gruneisen - Passed the CAN SLIM® Master's Exam
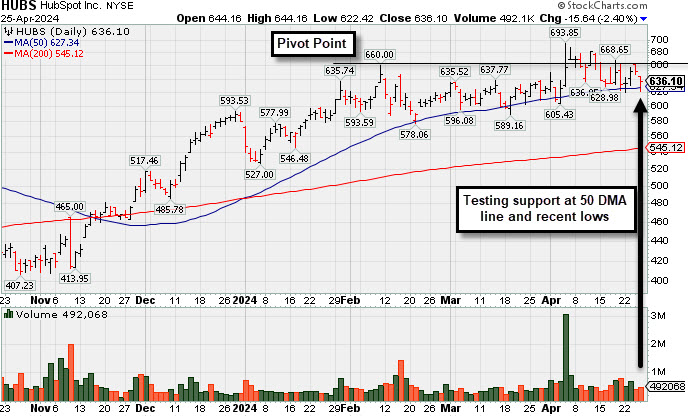
Hubspot Inc (HUBS -$16.06 or -2.46% to $635.68) pulled back again today with near average volume, testing support at its 50-day moving average (DMA) line ($627) and recent lows. More damaging losses would raise serious concerns and trigger a worrisome technical sell signal.
HUBS has a highest possible Earnings Per Share Rating of 99. Dec '23 quarterly earnings +59% on +24% sales revenues versus the year-ago period marked its 6th consecutive quarterly comparison well above the +25% minimum guideline (C criteria). Its annual earnings history (A criteria) has been strong. It faces some resistance due to old overhead supply up to the $866 level.
The number of top-rated funds owning its shares rose from 1,530 in Jun '23 to 1,821 in Mar '24, a reassuring sign concerning the I criteria. Its current Up/Down Volume Ratio of 1.6 is an unbiased indication its shares have been under accumulation over the past 50 days.
|
|
|
Color Codes Explained :
Y - Better candidates highlighted by our
staff of experts.
G - Previously featured
in past reports as yellow but may no longer be buyable under the
guidelines.
***Last / Change / Volume data in this table is the closing quote data***
Symbol/Exchange
Company Name
Industry Group |
PRICE |
CHANGE
(%Change) |
Day High |
Volume
(% DAV)
(% 50 day avg vol) |
52 Wk Hi
% From Hi |
Featured
Date |
Price
Featured |
Pivot Featured |
|
Max Buy |
 NVO
-
NYSE
NVO
-
NYSE
Novo Nordisk ADR
Medical-Ethical Drugs
|
$125.79
|
-0.37
-0.29% |
$125.85
|
3,392,925
71.21% of 50 DAV
50 DAV is 4,765,000
|
$138.28
-9.03%
|
3/1/2024
|
$124.23
|
PP = $124.97
|
|
MB = $131.22
|
Most Recent Note - 4/24/2024 5:13:30 PM
G - Slumped below its 50 DMA line ($126) which may now act as resistance. A rebound above the 50 DMA line is needed for its outlook to improve. See the latest FSU analysis for more details and a new annotated graph.
>>> FEATURED STOCK ARTICLE : Fell Below 50-Day Moving Average Which May Act as Resistance - 4/24/2024 |
View all notes |
Set NEW NOTE alert |
Company Profile |
SEC
News |
Chart |
Request a new note
C
A
S
I |
AXON
-
NASDAQ
Axon Enterprise
Security/Sfty
|
$306.24
|
+3.83
1.27% |
$308.83
|
297,827
56.30% of 50 DAV
50 DAV is 529,000
|
$329.87
-7.16%
|
4/5/2024
|
$309.90
|
PP = $325.73
|
|
MB = $342.02
|
Most Recent Note - 4/23/2024 5:59:01 PM
Y - Posted a gain today with near-average volume and closed just above its 50 DMA line ($301). Color code was changed to yellow with new pivot point cited based on its 3/04/24 high plus 10 cents. A gain above the pivot point backed by at least +40% above average volume is needed to trigger a proper technical buy signal. Fundamentals remain strong.
>>> FEATURED STOCK ARTICLE : Volume Totals Cooling While Building a New Base - 4/8/2024 |
View all notes |
Set NEW NOTE alert |
Company Profile |
SEC
News |
Chart |
Request a new note
C
A
S
I |
TDG
-
NYSE
TransDigm Group
Aerospace/Defense
|
$1,256.58
|
+14.96
1.20% |
$1,265.25
|
229,179
116.33% of 50 DAV
50 DAV is 197,000
|
$1,255.59
0.08%
|
4/12/2024
|
$1,224.21
|
PP = $1,246.32
|
|
MB = $1,308.64
|
Most Recent Note - 4/23/2024 5:54:37 PM
Y - Posted a solid gain today with +22% above average volume for a best-ever close. Color code was changed to yellow after holding its ground in a tight range near its all-time high. New pivot point was cited based on its 4/04/24 high plus 10 cents. Subsequent gains above the pivot point backed by at least +40% above average volume are needed to trigger a proper new technical buy signal. Its 50 DMA line ($1,193) defines near-term support to watch.
>>> FEATURED STOCK ARTICLE : Volume Totals Cooling While Perched Near High - 4/9/2024 |
View all notes |
Set NEW NOTE alert |
Company Profile |
SEC
News |
Chart |
Request a new note
C
A
S
I |
PCAR
-
NASDAQ
Paccar
Trucks and Parts-Hvy Duty
|
$112.62
|
-1.12
-0.98% |
$113.65
|
3,243,394
141.51% of 50 DAV
50 DAV is 2,292,000
|
$125.50
-10.26%
|
1/23/2024
|
$100.35
|
PP = $98.57
|
|
MB = $103.50
|
Most Recent Note - 4/24/2024 5:17:09 PM
G - Halted its slide after a recently noted slump below its 50 DMA line ($116) triggered a technical sell signal. A prompt rebound above the 50 DMA line is needed for its outlook to improve. Fundamentals remain strong.
>>> FEATURED STOCK ARTICLE : Pulling Back From High and Slumping Toward 50-Day Moving Average - 4/12/2024 |
View all notes |
Set NEW NOTE alert |
Company Profile |
SEC
News |
Chart |
Request a new note
C
A
S
I |
HUBB
-
NYSE
Hubbell
Electrical-Power/Equipmt
|
$402.27
|
+3.72
0.93% |
$403.58
|
341,231
84.67% of 50 DAV
50 DAV is 403,000
|
$429.61
-6.36%
|
1/30/2024
|
$343.26
|
PP = $336.83
|
|
MB = $353.67
|
Most Recent Note - 4/24/2024 5:15:39 PM
G - Posted a 3rd consecutive gain today with below-average volume after finding prompt support near its 50 DMA line ($392.82).
>>> FEATURED STOCK ARTICLE : Closed Just Below 50-Day Moving Average With Quiet Loss - 4/19/2024 |
View all notes |
Set NEW NOTE alert |
Company Profile |
SEC
News |
Chart |
Request a new note
C
A
S
I |
Symbol/Exchange
Company Name
Industry Group |
PRICE |
CHANGE
(%Change) |
Day High |
Volume
(% DAV)
(% 50 day avg vol) |
52 Wk Hi
% From Hi |
Featured
Date |
Price
Featured |
Pivot Featured |
|
Max Buy |
USLM
-
NASDAQ
U.S. Lime & Minerals
Bldg-Cement/Concrt/Ag
|
$301.24
|
-2.76
-0.91% |
$301.43
|
13,300
57.83% of 50 DAV
50 DAV is 23,000
|
$308.00
-2.19%
|
2/9/2024
|
$254.68
|
PP = $265.09
|
|
MB = $278.34
|
Most Recent Note - 4/23/2024 6:01:02 PM
G - Posted a 3rd consecutive gain today challenging its all-time high. Its 50 DMA line ($282.71) defines near-term support to watch.
>>> FEATURED STOCK ARTICLE : Gain With Light Volume for Best Ever Close - 4/5/2024 |
View all notes |
Set NEW NOTE alert |
Company Profile |
SEC
News |
Chart |
Request a new note
C
A
S
I |
PAY
-
NYSE
Paymentus Holdings
Finance-CrdtCard/PmtPr
|
$20.10
|
-0.52
-2.52% |
$20.30
|
148,304
37.08% of 50 DAV
50 DAV is 400,000
|
$25.21
-20.27%
|
3/5/2024
|
$19.97
|
PP = $18.89
|
|
MB = $19.83
|
Most Recent Note - 4/24/2024 5:18:52 PM
G - Posted a 3rd consecutive gain today with ever-increasing (but below-average) volume, finding support near its 50 DMA line ($19.75). Prior highs in the $18 range define the next support. More damaging losses would raise greater concerns.
>>> FEATURED STOCK ARTICLE : Prior Highs Define Important Near-Term Support - 4/22/2024 |
View all notes |
Set NEW NOTE alert |
Company Profile |
SEC
News |
Chart |
Request a new note
C
A
S
I |
HUBS
-
NYSE
HubSpot
Comp Sftwr-Spec Enterprs
|
$635.68
|
-16.06
-2.46% |
$644.16
|
466,554
86.24% of 50 DAV
50 DAV is 541,000
|
$693.85
-8.38%
|
4/4/2024
|
$686.66
|
PP = $660.10
|
|
MB = $693.11
|
 Most Recent Note - 4/25/2024 4:54:07 PM
Y - Pulled back again today with near average volume, testing support at its 50 DMA line ($627) and recent lows. Stalled after highlighted yellow in the 4/04/24 mid-day report with pivot point cited based on its 2/09/24 high plus 10 cents. Fundamentals remain strong. See the latest FSU analysis for more details and an annotated graph.
>>> FEATURED STOCK ARTICLE : HUBS Testing 50-day Moving Average Line Again - 4/25/2024 |
View all notes |
Set NEW NOTE alert |
Company Profile |
SEC
News |
Chart |
Request a new note
C
A
S
I |
|
|
|
THESE ARE NOT BUY RECOMMENDATIONS!
Comments contained in the body of this report are technical
opinions only. The material herein has been obtained
from sources believed to be reliable and accurate, however,
its accuracy and completeness cannot be guaranteed.
This site is not an investment advisor, hence it does
not endorse or recommend any securities or other investments.
Any recommendation contained in this report may not
be suitable for all investors and it is not to be deemed
an offer or solicitation on our part with respect to
the purchase or sale of any securities. All trademarks,
service marks and trade names appearing in this report
are the property of their respective owners, and are
likewise used for identification purposes only.
This report is a service available
only to active Paid Premium Members.
You may opt-out of receiving report notifications
at any time. Questions or comments may be submitted
by writing to Premium Membership Services 665 S.E. 10 Street, Suite 201 Deerfield Beach, FL 33441-5634 or by calling 1-800-965-8307
or 954-785-1121.
|
|
|