***Last / Change / Volume data in this table is the closing quote data***
Symbol/Exchange
Company Name
Industry Group |
PRICE |
CHANGE
(%Change) |
Day High |
Volume
(% DAV)
(% 50 day avg vol) |
52 Wk Hi
% From Hi |
Featured
Date |
Price
Featured |
Pivot Featured |
|
Max Buy |
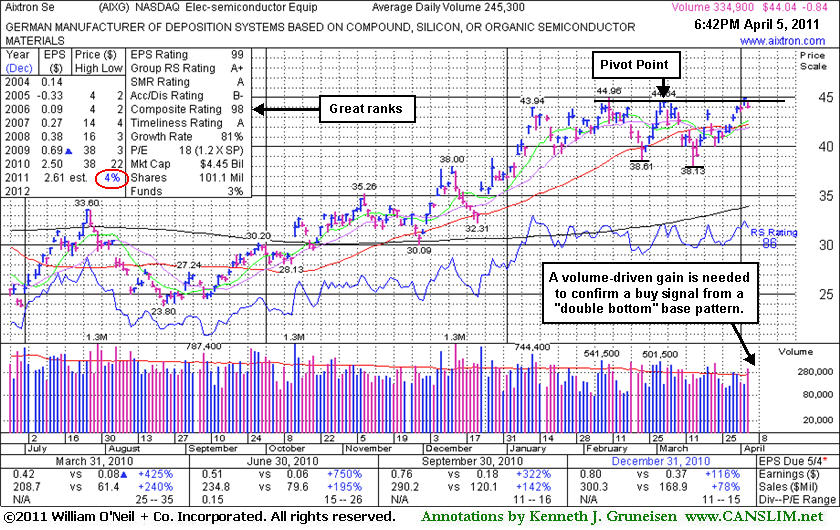
AIXG
-
NASDAQ
Aixtron Se
ELECTRONICS - Semiconductor Equipment andamp; Mate
|
$44.02
|
-0.86
-1.92% |
$44.51
|
337,848
136.45% of 50 DAV
50 DAV is 247,600
|
$44.96
-2.09%
|
4/5/2011
|
$44.14
|
PP = $44.64
|
|
MB = $46.87
|
 Most Recent Note - 4/5/2011 7:06:27 PM
Y - Pulled back today with higher volume while perched near its high after building a base above prior resistance in the $38 area. Color code was changed to yellow when featured in today's mid-day report with pivot point cited based on its 3/03/11 high after an 8-week double bottom base pattern. Volume driven gains above its pivot point may trigger a technical buy signal, but disciplined investors will watch for proof of institutional buying demand and avoid the urge to get in "early". See the latest FSU analysis for details and an annotated graph.
>>> The latest Featured Stock Update with an annotated graph appeared on 4/5/2011. Click here.
View all notes |
Alert me of new notes |
CANSLIM.net Company Profile |
SEC |
Zacks Reports |
StockTalk |
News |
Chart |
Request a new note
C
A N
S L
I M


|
BIDU
-
NASDAQ
Baidu Inc Ads
INTERNET - Internet Information Providers
|
$141.65
|
-1.46
-1.02% |
$143.48
|
5,824,176
83.68% of 50 DAV
50 DAV is 6,960,300
|
$143.11
-1.02%
|
3/17/2011
|
$121.97
|
PP = $131.73
|
|
MB = $138.32
|
Most Recent Note - 4/4/2011 2:00:17 PM
G - Up today for a 5th consecutive gain and another new all-time high. Color code was changed to green after getting extended from its prior base, rising above its "max buy" level. Market conditions (M criteria) have recognizably improved in terms of leadership (new 52-week highs) in recent weeks without a strictly defined follow-through day. Prior high near $131 defines initial chart support to watch.
>>> The latest Featured Stock Update with an annotated graph appeared on 3/9/2011. Click here.
View all notes |
Alert me of new notes |
CANSLIM.net Company Profile |
SEC |
Zacks Reports |
StockTalk |
News |
Chart |
Request a new note
C
A N
S L
I M
|
CMG
-
NYSE
Chipotle Mexican Grill
LEISURE - Restaurants
|
$278.02
|
+4.11
1.50% |
$280.58
|
918,644
84.30% of 50 DAV
50 DAV is 1,089,700
|
$278.00
0.01%
|
4/1/2011
|
$274.00
|
PP = $275.10
|
|
MB = $288.86
|
Most Recent Note - 4/5/2011 2:02:36 PM
Y - Rising quietly to a new all-time high today without great volume conviction behind its gain above the new pivot point cited based on its prior high plus 10 cents after an orderly 7-week base pattern. Disciplined investors know to watch for confirming gains with well above average volume to trigger a new (or add-on) technical buy signal.
>>> The latest Featured Stock Update with an annotated graph appeared on 3/14/2011. Click here.
View all notes |
Alert me of new notes |
CANSLIM.net Company Profile |
SEC |
Zacks Reports |
StockTalk |
News |
Chart |
Request a new note
C
A N
S L
I M
|
CTCT
-
NASDAQ
Constant Contact Inc
MEDIA - Advertising Services
|
$34.97
|
-0.34
-0.96% |
$35.61
|
669,361
159.60% of 50 DAV
50 DAV is 419,400
|
$36.33
-3.74%
|
3/22/2011
|
$33.59
|
PP = $32.49
|
|
MB = $34.11
|
Most Recent Note - 4/5/2011 7:01:17 PM
G - Churned above average volume today and closed in the red, enduring distributional pressure. Prior highs in the $32 area define support to watch above its 50 DMA line.
>>> The latest Featured Stock Update with an annotated graph appeared on 3/22/2011. Click here.
View all notes |
Alert me of new notes |
CANSLIM.net Company Profile |
SEC |
Zacks Reports |
StockTalk |
News |
Chart |
Request a new note
C
A N
S L
I M
|
CTSH
-
NASDAQ
Cognizant Tech Sol Cl A
COMPUTER SOFTWARE and SERVICES - Business Software and Services
|
$82.01
|
-0.34
-0.41% |
$82.59
|
1,848,338
79.16% of 50 DAV
50 DAV is 2,335,000
|
$82.86
-1.03%
|
2/7/2011
|
$75.09
|
PP = $76.46
|
|
MB = $80.28
|
Most Recent Note - 4/5/2011 2:06:01 PM
G - Hovering at its 52-week high in a tight range since noted last week while wedging higher with gains on light volume. No resistance remains due to overhead supply. Prior highs in the $77-78 area define chart support to watch above its 50 DMA line.
>>> The latest Featured Stock Update with an annotated graph appeared on 3/17/2011. Click here.
View all notes |
Alert me of new notes |
CANSLIM.net Company Profile |
SEC |
Zacks Reports |
StockTalk |
News |
Chart |
Request a new note
C
A N
S L
I M
|
Symbol/Exchange
Company Name
Industry Group |
PRICE |
CHANGE
(%Change) |
Day High |
Volume
(% DAV)
(% 50 day avg vol) |
52 Wk Hi
% From Hi |
Featured
Date |
Price
Featured |
Pivot Featured |
|
Max Buy |
DECK
-
NASDAQ
Deckers Outdoor Corp
CONSUMER NON-DURABLES - Textile - Apparel Footwear
|
$90.58
|
+1.50
1.68% |
$91.50
|
861,479
62.29% of 50 DAV
50 DAV is 1,383,000
|
$94.70
-4.35%
|
2/3/2011
|
$79.61
|
PP = $82.67
|
|
MB = $86.80
|
Most Recent Note - 4/5/2011 1:45:20 PM
G - Today's gain has it poised for a best-ever close, but its choppy consolidation in recent weeks is not recognized as a sound base pattern. Its 50 DMA line defines initial chart support to watch.
>>> The latest Featured Stock Update with an annotated graph appeared on 3/3/2011. Click here.
View all notes |
Alert me of new notes |
CANSLIM.net Company Profile |
SEC |
Zacks Reports |
StockTalk |
News |
Chart |
Request a new note
C
A N
S L
I M
|
EZPW
-
NASDAQ
Ezcorp Inc Cl A
SPECIALTY RETAIL - Specialty Retail, Other
|
$32.61
|
+0.64
2.00% |
$32.87
|
440,413
122.64% of 50 DAV
50 DAV is 359,100
|
$32.13
1.49%
|
2/18/2011
|
$27.94
|
PP = $30.04
|
|
MB = $31.54
|
Most Recent Note - 4/5/2011 1:47:33 PM
G - Up again today, hitting new all-time highs and getting extended from its latest base. Prior highs in the $29-30 area define support to watch on pullbacks.
>>> The latest Featured Stock Update with an annotated graph appeared on 3/10/2011. Click here.
View all notes |
Alert me of new notes |
CANSLIM.net Company Profile |
SEC |
Zacks Reports |
StockTalk |
News |
Chart |
Request a new note
C
A N
S L
I M
|
FOSL
-
NASDAQ
Fossil Inc
CONSUMER DURABLES - Recreational Goods, Other
|
$93.62
|
+0.10
0.11% |
$94.12
|
626,839
64.52% of 50 DAV
50 DAV is 971,500
|
$94.77
-1.21%
|
2/1/2011
|
$73.30
|
PP = $74.44
|
|
MB = $78.16
|
Most Recent Note - 4/4/2011 4:04:40 PM
G - Holding its ground at all-time highs, extended from any sound base. Prior highs in the $83-85 area define chart support to watch above its 50 DMA line.
>>> The latest Featured Stock Update with an annotated graph appeared on 3/30/2011. Click here.
View all notes |
Alert me of new notes |
CANSLIM.net Company Profile |
SEC |
Zacks Reports |
StockTalk |
News |
Chart |
Request a new note
C
A N
S L
I M
|
HMSY
-
NASDAQ
H M S Holdings Corp
COMPUTER SOFTWARE and SERVICES - Healthcare Information Service
|
$83.63
|
-0.12
-0.14% |
$83.99
|
98,540
59.11% of 50 DAV
50 DAV is 166,700
|
$83.98
-0.42%
|
11/19/2010
|
$61.89
|
PP = $63.01
|
|
MB = $66.16
|
Most Recent Note - 4/4/2011 4:05:58 PM
G - Up again today with light volume for another best-ever close. It is extended from any sound base pattern and its 50 DMA line defines support to watch on pullbacks.
>>> The latest Featured Stock Update with an annotated graph appeared on 3/25/2011. Click here.
View all notes |
Alert me of new notes |
CANSLIM.net Company Profile |
SEC |
Zacks Reports |
StockTalk |
News |
Chart |
Request a new note
C
A N
S L
I M
|
HS
-
NYSE
Healthspring Inc
HEALTH SERVICES - Health Care Plans
|
$39.97
|
-0.13
-0.32% |
$40.69
|
1,102,810
139.47% of 50 DAV
50 DAV is 790,700
|
$40.78
-1.99%
|
3/22/2011
|
$38.29
|
PP = $38.85
|
|
MB = $40.79
|
Most Recent Note - 4/5/2011 12:33:35 PM
Y - Up today for a 7th consecutive gain, trading nearly +5% above its pivot point. Its 4/01/11 gain with above average volume cleared the previously cited pivot point triggering a new (or add-on) technical buy signal. The new Public Offering completed on 3/25/11 may hinder its upward progress for the near-term, however it has been attracting top-rated funds as owners (I criteria).
>>> The latest Featured Stock Update with an annotated graph appeared on 3/23/2011. Click here.
View all notes |
Alert me of new notes |
CANSLIM.net Company Profile |
SEC |
Zacks Reports |
StockTalk |
News |
Chart |
Request a new note
C
A N
S L
I M
|
Symbol/Exchange
Company Name
Industry Group |
PRICE |
CHANGE
(%Change) |
Day High |
Volume
(% DAV)
(% 50 day avg vol) |
52 Wk Hi
% From Hi |
Featured
Date |
Price
Featured |
Pivot Featured |
|
Max Buy |
INFA
-
NASDAQ
Informatica Corp
COMPUTER SOFTWARE and SERVICES - Business Software and Services
|
$52.39
|
+0.38
0.73% |
$52.40
|
995,944
106.12% of 50 DAV
50 DAV is 938,500
|
$52.96
-1.08%
|
3/24/2011
|
$50.04
|
PP = $49.86
|
|
MB = $52.35
|
Most Recent Note - 4/4/2011 4:27:25 PM
Y - Consolidating near its "max buy" level with volume totals recently cooling. Prior highs in the $49 area define initial support to watch.
>>> The latest Featured Stock Update with an annotated graph appeared on 3/28/2011. Click here.
View all notes |
Alert me of new notes |
CANSLIM.net Company Profile |
SEC |
Zacks Reports |
StockTalk |
News |
Chart |
Request a new note
C
A N
S L
I M
|
LULU
-
NASDAQ
Lululemon Athletica
MANUFACTURING - Textile Manufacturing
|
$93.49
|
+2.55
2.80% |
$94.29
|
2,800,406
124.91% of 50 DAV
50 DAV is 2,241,900
|
$91.00
2.74%
|
3/28/2011
|
$68.11
|
PP = $85.38
|
|
MB = $89.65
|
Most Recent Note - 4/5/2011 12:50:20 PM
G - Up again today with higher volume for a new all-time high, getting more extended from its latest sound base pattern. Prior highs in the $85 area define initial chart support to watch.
>>> The latest Featured Stock Update with an annotated graph appeared on 3/31/2011. Click here.
View all notes |
Alert me of new notes |
CANSLIM.net Company Profile |
SEC |
Zacks Reports |
StockTalk |
News |
Chart |
Request a new note
C
A N
S L
I M
|
MG
-
NYSE
Mistras Group Inc
DIVERSIFIED SERVICES - Bulding and Faci;ity Management Services
|
$16.88
|
+0.03
0.18% |
$16.99
|
111,049
102.73% of 50 DAV
50 DAV is 108,100
|
$17.33
-2.60%
|
3/15/2011
|
$15.48
|
PP = $15.90
|
|
MB = $16.70
|
Most Recent Note - 4/4/2011 4:20:35 PM
G - Its small gap down today with slightly above average volume completed an "island reversal" pattern following an earlier 3/21/11 gap up gain, raising some concerns. Repeatedly noted as extended from a sound base pattern. Prior highs and its 50 DMA line define important support to watch on pullbacks.
>>> The latest Featured Stock Update with an annotated graph appeared on 3/15/2011. Click here.
View all notes |
Alert me of new notes |
CANSLIM.net Company Profile |
SEC |
Zacks Reports |
StockTalk |
News |
Chart |
Request a new note
C
A N
S L
I M
|
MWIV
-
NASDAQ
M W I Veterinary Supply
HEALTH SERVICES - Medical Instruments and; Supplies
|
$79.43
|
+0.41
0.52% |
$79.77
|
61,349
64.24% of 50 DAV
50 DAV is 95,500
|
$80.86
-1.77%
|
11/4/2010
|
$61.79
|
PP = $59.60
|
|
MB = $62.58
|
Most Recent Note - 4/4/2011 4:22:54 PM
G - Perched near all-time highs, consolidating above its recently noted tight trading range. It has been repeatedly noted - "Extended from any sound base pattern."
>>> The latest Featured Stock Update with an annotated graph appeared on 3/8/2011. Click here.
View all notes |
Alert me of new notes |
CANSLIM.net Company Profile |
SEC |
Zacks Reports |
StockTalk |
News |
Chart |
Request a new note
C
A N
S L
I M
|
OPEN
-
NASDAQ
Opentable Inc
INTERNET - Internet Software and Services
|
$109.63
|
+0.76
0.70% |
$109.93
|
1,232,104
102.27% of 50 DAV
50 DAV is 1,204,700
|
$109.06
0.52%
|
3/17/2011
|
$90.71
|
PP = $96.07
|
|
MB = $100.87
|
Most Recent Note - 4/4/2011 4:23:51 PM
G - Gain today with average volume for a new all-time high, getting more extended from its recently noted base. Its prior high near $96 defines initial support to watch on pullbacks following its latest technical breakout.
>>> The latest Featured Stock Update with an annotated graph appeared on 3/24/2011. Click here.
View all notes |
Alert me of new notes |
CANSLIM.net Company Profile |
SEC |
Zacks Reports |
StockTalk |
News |
Chart |
Request a new note
C
A N
S L
I M
|
Symbol/Exchange
Company Name
Industry Group |
PRICE |
CHANGE
(%Change) |
Day High |
Volume
(% DAV)
(% 50 day avg vol) |
52 Wk Hi
% From Hi |
Featured
Date |
Price
Featured |
Pivot Featured |
|
Max Buy |
PAY
-
NYSE
Verifone Systems Inc
COMPUTER HARDWARE - Transaction Automation Systems
|
$55.77
|
+0.95
1.73% |
$56.48
|
4,108,326
209.68% of 50 DAV
50 DAV is 1,959,300
|
$58.88
-5.28%
|
1/27/2011
|
$41.77
|
PP = $44.97
|
|
MB = $47.22
|
Most Recent Note - 4/5/2011 1:49:39 PM
G - Consolidating near its all-time highs, recently enduring some distributional pressure. Repeatedly noted - "No resistance remains due to overhead supply, but it is extended from a sound base pattern. Its 50 DMA line defines chart support to watch."
>>> The latest Featured Stock Update with an annotated graph appeared on 4/4/2011. Click here.
View all notes |
Alert me of new notes |
CANSLIM.net Company Profile |
SEC |
Zacks Reports |
StockTalk |
News |
Chart |
Request a new note
C
A N
S L
I M
|
PCLN
-
NASDAQ
Priceline.Com Inc
INTERNET - Internet Software and Services
|
$516.94
|
-1.65
-0.32% |
$522.00
|
710,584
59.68% of 50 DAV
50 DAV is 1,190,700
|
$518.68
-0.34%
|
1/3/2011
|
$399.55
|
PP = $428.20
|
|
MB = $449.61
|
Most Recent Note - 4/4/2011 4:07:29 PM
G - Rose to another new 52-week high with below average volume behind today's 5th consecutive gain, getting extended from any sound base pattern. Its 50 DMA line has defined support throughout its advance.
>>> The latest Featured Stock Update with an annotated graph appeared on 3/21/2011. Click here.
View all notes |
Alert me of new notes |
CANSLIM.net Company Profile |
SEC |
Zacks Reports |
StockTalk |
News |
Chart |
Request a new note
C
A N
S L
I M
|
RAX
-
NYSE
Rackspace Hosting Inc
INTERNET - Internet Software and; Services
|
$42.96
|
+0.21
0.49% |
$43.34
|
1,603,509
88.89% of 50 DAV
50 DAV is 1,804,000
|
$44.19
-2.78%
|
3/16/2011
|
$36.28
|
PP = $40.72
|
|
MB = $42.76
|
Most Recent Note - 4/4/2011 4:12:33 PM
G - Holding its ground in a tight range near its all-time high, extended from its orderly 7-week flat base. Prior high near $40 defines chart support to watch on pullbacks. Disciplined investors avoid chasing extended stocks.
>>> The latest Featured Stock Update with an annotated graph appeared on 3/16/2011. Click here.
View all notes |
Alert me of new notes |
CANSLIM.net Company Profile |
SEC |
Zacks Reports |
StockTalk |
News |
Chart |
Request a new note
C
A N
S L
I M
|
TIBX
-
NASDAQ
Tibco Software Inc
COMPUTER SOFTWARE and SERVICES - Business Software and Services
|
$27.57
|
-0.02
-0.07% |
$27.82
|
1,831,876
73.68% of 50 DAV
50 DAV is 2,486,200
|
$28.31
-2.60%
|
3/18/2011
|
$23.88
|
PP = $26.04
|
|
MB = $27.34
|
Most Recent Note - 4/4/2011 4:14:26 PM
G - Inched higher today with light volume for a 5th consecutive gain and a new high close. Extended from its prior base after a spurt of gains last week with above average volume, its color code was changed to green. Prior highs in the $25-26 area define support to watch on pullbacks.
>>> The latest Featured Stock Update with an annotated graph appeared on 3/18/2011. Click here.
View all notes |
Alert me of new notes |
CANSLIM.net Company Profile |
SEC |
Zacks Reports |
StockTalk |
News |
Chart |
Request a new note
C
A N
S L
I M
|
UA
-
NYSE
Under Armour Inc Cl A
CONSUMER NON-DURABLES - Textile - Apparel Clothing
|
$76.05
|
+1.50
2.01% |
$76.85
|
864,054
100.83% of 50 DAV
50 DAV is 856,900
|
$75.00
1.40%
|
3/31/2011
|
$68.04
|
PP = $70.79
|
|
MB = $74.33
|
Most Recent Note - 4/5/2011 7:03:40 PM
G - Hit another new all-time high today with a 3rd consecutive gain, rising further above its 2007 all-time high ($73.40) and getting extended from its base-on-base pattern. Prior highs in the $70 area define support to watch.
>>> The latest Featured Stock Update with an annotated graph appeared on 4/1/2011. Click here.
View all notes |
Alert me of new notes |
CANSLIM.net Company Profile |
SEC |
Zacks Reports |
StockTalk |
News |
Chart |
Request a new note
C
A N
S L
I M
|
Symbol/Exchange
Company Name
Industry Group |
PRICE |
CHANGE
(%Change) |
Day High |
Volume
(% DAV)
(% 50 day avg vol) |
52 Wk Hi
% From Hi |
Featured
Date |
Price
Featured |
Pivot Featured |
|
Max Buy |
ULTA
-
NASDAQ
Ulta Salon Cosm & Frag
SPECIALTY RETAIL - Specialty Retail, Other
|
$49.81
|
+1.53
3.17% |
$49.95
|
621,979
102.33% of 50 DAV
50 DAV is 607,800
|
$48.88
1.90%
|
1/6/2011
|
$36.12
|
PP = $37.34
|
|
MB = $39.21
|
Most Recent Note - 4/5/2011 11:24:07 AM
G - Up today for another new all-time high, yet in recent weeks it has been wedging higher without great volume conviction. Prior highs and its 50 DMA line define chart support to watch near the $44 level on pullbacks.
>>> The latest Featured Stock Update with an annotated graph appeared on 3/29/2011. Click here.
View all notes |
Alert me of new notes |
CANSLIM.net Company Profile |
SEC |
Zacks Reports |
StockTalk |
News |
Chart |
Request a new note
C
A N
S L
I M
|