***Last / Change / Volume data in this table is the closing quote data***
Symbol/Exchange
Company Name
Industry Group |
PRICE |
CHANGE
(%Change) |
Day High |
Volume
(% DAV)
(% 50 day avg vol) |
52 Wk Hi
% From Hi |
Featured
Date |
Price
Featured |
Pivot Featured |
|
Max Buy |
AIXG
-
NASDAQ
Aixtron Se
ELECTRONICS - Semiconductor Equipment andamp; Mate
|
$43.98
|
-0.04
-0.09% |
$44.09
|
188,946
75.82% of 50 DAV
50 DAV is 249,200
|
$44.96
-2.18%
|
4/5/2011
|
$44.14
|
PP = $44.64
|
|
MB = $46.87
|
Most Recent Note - 4/5/2011 7:06:27 PM
Y - Pulled back today with higher volume while perched near its high after building a base above prior resistance in the $38 area. Color code was changed to yellow when featured in today's mid-day report with pivot point cited based on its 3/03/11 high after an 8-week double bottom base pattern. Volume driven gains above its pivot point may trigger a technical buy signal, but disciplined investors will watch for proof of institutional buying demand and avoid the urge to get in "early". See the latest FSU analysis for details and an annotated graph.
>>> The latest Featured Stock Update with an annotated graph appeared on 4/5/2011. Click here.
View all notes |
Alert me of new notes |
CANSLIM.net Company Profile |
SEC |
Zacks Reports |
StockTalk |
News |
Chart |
Request a new note
C
A N
S L
I M


|
BIDU
-
NASDAQ
Baidu Inc Ads
INTERNET - Internet Information Providers
|
$137.25
|
-4.40
-3.11% |
$142.95
|
8,909,625
129.11% of 50 DAV
50 DAV is 6,901,000
|
$143.48
-4.34%
|
3/17/2011
|
$121.97
|
PP = $131.73
|
|
MB = $138.32
|
 Most Recent Note - 4/6/2011 1:42:18 PM
Y - Color code is changed to yellow after consolidating back within 5% of its pivot point. Prior high near $131 defines initial chart support to watch.
>>> The latest Featured Stock Update with an annotated graph appeared on 3/9/2011. Click here.
View all notes |
Alert me of new notes |
CANSLIM.net Company Profile |
SEC |
Zacks Reports |
StockTalk |
News |
Chart |
Request a new note
C
A N
S L
I M
|
CMG
-
NYSE
Chipotle Mexican Grill
LEISURE - Restaurants
|
$275.76
|
-2.26
-0.81% |
$282.00
|
846,015
76.90% of 50 DAV
50 DAV is 1,100,200
|
$280.58
-1.72%
|
4/1/2011
|
$274.00
|
PP = $275.10
|
|
MB = $288.86
|
Most Recent Note - 4/5/2011 2:02:36 PM
Y - Rising quietly to a new all-time high today without great volume conviction behind its gain above the new pivot point cited based on its prior high plus 10 cents after an orderly 7-week base pattern. Disciplined investors know to watch for confirming gains with well above average volume to trigger a new (or add-on) technical buy signal.
>>> The latest Featured Stock Update with an annotated graph appeared on 3/14/2011. Click here.
View all notes |
Alert me of new notes |
CANSLIM.net Company Profile |
SEC |
Zacks Reports |
StockTalk |
News |
Chart |
Request a new note
C
A N
S L
I M
|
CTCT
-
NASDAQ
Constant Contact Inc
MEDIA - Advertising Services
|
$35.60
|
+0.63
1.80% |
$35.72
|
315,175
72.86% of 50 DAV
50 DAV is 432,600
|
$36.33
-2.01%
|
3/22/2011
|
$33.59
|
PP = $32.49
|
|
MB = $34.11
|
Most Recent Note - 4/5/2011 7:01:17 PM
G - Churned above average volume today and closed in the red, enduring distributional pressure. Prior highs in the $32 area define support to watch above its 50 DMA line.
>>> The latest Featured Stock Update with an annotated graph appeared on 3/22/2011. Click here.
View all notes |
Alert me of new notes |
CANSLIM.net Company Profile |
SEC |
Zacks Reports |
StockTalk |
News |
Chart |
Request a new note
C
A N
S L
I M
|
CTSH
-
NASDAQ
Cognizant Tech Sol Cl A
COMPUTER SOFTWARE and SERVICES - Business Software and Services
|
$81.39
|
-0.62
-0.76% |
$82.72
|
1,589,136
68.71% of 50 DAV
50 DAV is 2,312,900
|
$82.86
-1.77%
|
2/7/2011
|
$75.09
|
PP = $76.46
|
|
MB = $80.28
|
Most Recent Note - 4/5/2011 2:06:01 PM
G - Hovering at its 52-week high in a tight range since noted last week while wedging higher with gains on light volume. No resistance remains due to overhead supply. Prior highs in the $77-78 area define chart support to watch above its 50 DMA line.
>>> The latest Featured Stock Update with an annotated graph appeared on 3/17/2011. Click here.
View all notes |
Alert me of new notes |
CANSLIM.net Company Profile |
SEC |
Zacks Reports |
StockTalk |
News |
Chart |
Request a new note
C
A N
S L
I M
|
Symbol/Exchange
Company Name
Industry Group |
PRICE |
CHANGE
(%Change) |
Day High |
Volume
(% DAV)
(% 50 day avg vol) |
52 Wk Hi
% From Hi |
Featured
Date |
Price
Featured |
Pivot Featured |
|
Max Buy |
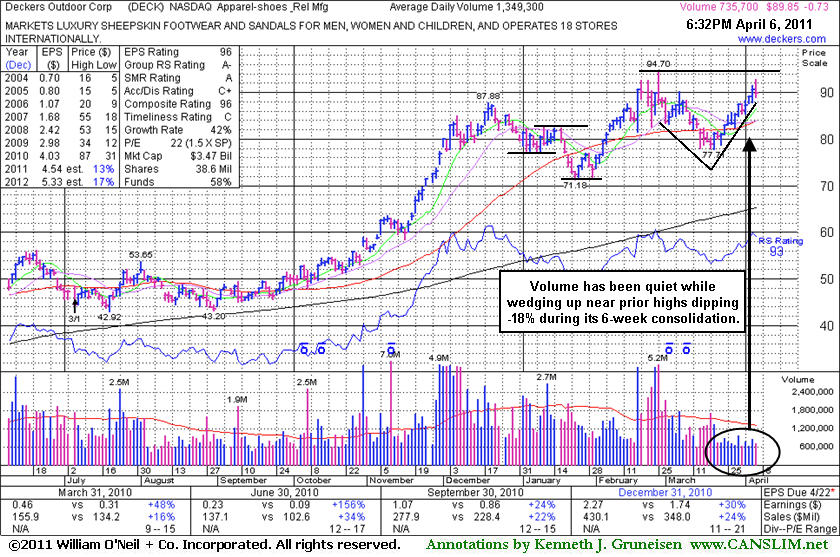
DECK
-
NASDAQ
Deckers Outdoor Corp
CONSUMER NON-DURABLES - Textile - Apparel Footwear
|
$89.85
|
-0.73
-0.81% |
$92.77
|
736,606
54.59% of 50 DAV
50 DAV is 1,349,300
|
$94.70
-5.12%
|
2/3/2011
|
$79.61
|
PP = $82.67
|
|
MB = $86.80
|
Most Recent Note - 4/6/2011 6:49:47 PM
G - Its choppy consolidation in recent weeks is not recognized as a sound base pattern. Its 50 DMA line defines initial chart support to watch. See the latest FSU analysis for more details and a new annotated graph.
>>> The latest Featured Stock Update with an annotated graph appeared on 4/6/2011. Click here.
View all notes |
Alert me of new notes |
CANSLIM.net Company Profile |
SEC |
Zacks Reports |
StockTalk |
News |
Chart |
Request a new note
C
A N
S L
I M
|
EZPW
-
NASDAQ
Ezcorp Inc Cl A
SPECIALTY RETAIL - Specialty Retail, Other
|
$32.03
|
-0.58
-1.78% |
$33.08
|
383,814
111.93% of 50 DAV
50 DAV is 342,900
|
$32.87
-2.56%
|
2/18/2011
|
$27.94
|
PP = $30.04
|
|
MB = $31.54
|
Most Recent Note - 4/5/2011 1:47:33 PM
G - Up again today, hitting new all-time highs and getting extended from its latest base. Prior highs in the $29-30 area define support to watch on pullbacks.
>>> The latest Featured Stock Update with an annotated graph appeared on 3/10/2011. Click here.
View all notes |
Alert me of new notes |
CANSLIM.net Company Profile |
SEC |
Zacks Reports |
StockTalk |
News |
Chart |
Request a new note
C
A N
S L
I M
|
FOSL
-
NASDAQ
Fossil Inc
CONSUMER DURABLES - Recreational Goods, Other
|
$91.60
|
-2.02
-2.16% |
$94.71
|
736,232
75.40% of 50 DAV
50 DAV is 976,400
|
$94.77
-3.34%
|
2/1/2011
|
$73.30
|
PP = $74.44
|
|
MB = $78.16
|
Most Recent Note - 4/6/2011 1:49:55 PM
G - Pulling back from all-time highs today. It could produce more climactic gains but has been repeatedly noted - "Extended from any sound base. Prior highs in the $83-85 area define chart support to watch above its 50 DMA line."
>>> The latest Featured Stock Update with an annotated graph appeared on 3/30/2011. Click here.
View all notes |
Alert me of new notes |
CANSLIM.net Company Profile |
SEC |
Zacks Reports |
StockTalk |
News |
Chart |
Request a new note
C
A N
S L
I M
|
HMSY
-
NASDAQ
H M S Holdings Corp
COMPUTER SOFTWARE and SERVICES - Healthcare Information Service
|
$83.31
|
-0.32
-0.38% |
$84.82
|
79,816
48.31% of 50 DAV
50 DAV is 165,200
|
$83.99
-0.81%
|
11/19/2010
|
$61.89
|
PP = $63.01
|
|
MB = $66.16
|
Most Recent Note - 4/4/2011 4:05:58 PM
G - Up again today with light volume for another best-ever close. It is extended from any sound base pattern and its 50 DMA line defines support to watch on pullbacks.
>>> The latest Featured Stock Update with an annotated graph appeared on 3/25/2011. Click here.
View all notes |
Alert me of new notes |
CANSLIM.net Company Profile |
SEC |
Zacks Reports |
StockTalk |
News |
Chart |
Request a new note
C
A N
S L
I M
|
HS
-
NYSE
Healthspring Inc
HEALTH SERVICES - Health Care Plans
|
$38.79
|
-1.18
-2.95% |
$40.15
|
835,608
101.14% of 50 DAV
50 DAV is 826,200
|
$40.78
-4.88%
|
3/22/2011
|
$38.29
|
PP = $38.85
|
|
MB = $40.79
|
Most Recent Note - 4/6/2011 1:53:34 PM
Y - Pulling back from its all-time high hit this week, slumping near its pivot point today. Prior highs define support above its 50 DMA line and recent lows in the $35.50 area. The Public Offering completed on 3/25/11 may hinder its upward progress for the near-term, however it has been attracting top-rated funds as owners (I criteria).
>>> The latest Featured Stock Update with an annotated graph appeared on 3/23/2011. Click here.
View all notes |
Alert me of new notes |
CANSLIM.net Company Profile |
SEC |
Zacks Reports |
StockTalk |
News |
Chart |
Request a new note
C
A N
S L
I M
|
Symbol/Exchange
Company Name
Industry Group |
PRICE |
CHANGE
(%Change) |
Day High |
Volume
(% DAV)
(% 50 day avg vol) |
52 Wk Hi
% From Hi |
Featured
Date |
Price
Featured |
Pivot Featured |
|
Max Buy |
INFA
-
NASDAQ
Informatica Corp
COMPUTER SOFTWARE and SERVICES - Business Software and Services
|
$51.36
|
-1.03
-1.97% |
$52.69
|
554,342
60.08% of 50 DAV
50 DAV is 922,600
|
$52.96
-3.02%
|
3/24/2011
|
$50.04
|
PP = $49.86
|
|
MB = $52.35
|
Most Recent Note - 4/6/2011 1:44:36 PM
Y - Consolidating within 5% of its pivot point. Prior highs in the $49 area define initial support to watch above its 50 DMA line, where violations would raise concerns and may trigger technical sell signals.
>>> The latest Featured Stock Update with an annotated graph appeared on 3/28/2011. Click here.
View all notes |
Alert me of new notes |
CANSLIM.net Company Profile |
SEC |
Zacks Reports |
StockTalk |
News |
Chart |
Request a new note
C
A N
S L
I M
|
LULU
-
NASDAQ
Lululemon Athletica
MANUFACTURING - Textile Manufacturing
|
$92.08
|
-1.41
-1.51% |
$94.98
|
2,338,406
102.62% of 50 DAV
50 DAV is 2,278,600
|
$94.29
-2.34%
|
3/28/2011
|
$68.11
|
PP = $85.38
|
|
MB = $89.65
|
Most Recent Note - 4/5/2011 12:50:20 PM
G - Up again today with higher volume for a new all-time high, getting more extended from its latest sound base pattern. Prior highs in the $85 area define initial chart support to watch.
>>> The latest Featured Stock Update with an annotated graph appeared on 3/31/2011. Click here.
View all notes |
Alert me of new notes |
CANSLIM.net Company Profile |
SEC |
Zacks Reports |
StockTalk |
News |
Chart |
Request a new note
C
A N
S L
I M
|
MG
-
NYSE
Mistras Group Inc
DIVERSIFIED SERVICES - Bulding and Faci;ity Management Services
|
$16.78
|
-0.10
-0.59% |
$16.95
|
96,354
87.36% of 50 DAV
50 DAV is 110,300
|
$17.33
-3.17%
|
3/15/2011
|
$15.48
|
PP = $15.90
|
|
MB = $16.70
|
Most Recent Note - 4/4/2011 4:20:35 PM
G - Its small gap down today with slightly above average volume completed an "island reversal" pattern following an earlier 3/21/11 gap up gain, raising some concerns. Repeatedly noted as extended from a sound base pattern. Prior highs and its 50 DMA line define important support to watch on pullbacks.
>>> The latest Featured Stock Update with an annotated graph appeared on 3/15/2011. Click here.
View all notes |
Alert me of new notes |
CANSLIM.net Company Profile |
SEC |
Zacks Reports |
StockTalk |
News |
Chart |
Request a new note
C
A N
S L
I M
|
MWIV
-
NASDAQ
M W I Veterinary Supply
HEALTH SERVICES - Medical Instruments and; Supplies
|
$79.23
|
-0.20
-0.25% |
$79.99
|
67,422
69.94% of 50 DAV
50 DAV is 96,400
|
$80.86
-2.02%
|
11/4/2010
|
$61.79
|
PP = $59.60
|
|
MB = $62.58
|
Most Recent Note - 4/4/2011 4:22:54 PM
G - Perched near all-time highs, consolidating above its recently noted tight trading range. It has been repeatedly noted - "Extended from any sound base pattern."
>>> The latest Featured Stock Update with an annotated graph appeared on 3/8/2011. Click here.
View all notes |
Alert me of new notes |
CANSLIM.net Company Profile |
SEC |
Zacks Reports |
StockTalk |
News |
Chart |
Request a new note
C
A N
S L
I M
|
OPEN
-
NASDAQ
Opentable Inc
INTERNET - Internet Software and Services
|
$105.71
|
-3.92
-3.58% |
$112.78
|
2,476,195
203.33% of 50 DAV
50 DAV is 1,217,800
|
$109.93
-3.84%
|
3/17/2011
|
$90.71
|
PP = $96.07
|
|
MB = $100.87
|
Most Recent Note - 4/6/2011 12:58:43 PM
G - Gapped up today and then negatively reversed after initially trading to a new all-time high. It is extended from its latest base, and prior highs near $96 define initial support to watch on pullbacks.
>>> The latest Featured Stock Update with an annotated graph appeared on 3/24/2011. Click here.
View all notes |
Alert me of new notes |
CANSLIM.net Company Profile |
SEC |
Zacks Reports |
StockTalk |
News |
Chart |
Request a new note
C
A N
S L
I M
|
Symbol/Exchange
Company Name
Industry Group |
PRICE |
CHANGE
(%Change) |
Day High |
Volume
(% DAV)
(% 50 day avg vol) |
52 Wk Hi
% From Hi |
Featured
Date |
Price
Featured |
Pivot Featured |
|
Max Buy |
PAY
-
NYSE
Verifone Systems Inc
COMPUTER HARDWARE - Transaction Automation Systems
|
$53.77
|
-2.00
-3.59% |
$56.35
|
3,774,328
182.87% of 50 DAV
50 DAV is 2,063,900
|
$58.88
-8.68%
|
1/27/2011
|
$41.77
|
PP = $44.97
|
|
MB = $47.22
|
Most Recent Note - 4/6/2011 1:47:27 PM
G - Pulling back from all-time highs, enduring more distributional pressure with above average volume behind another loss today. Its 50 DMA line ($48.39 now) defines important chart support to watch.
>>> The latest Featured Stock Update with an annotated graph appeared on 4/4/2011. Click here.
View all notes |
Alert me of new notes |
CANSLIM.net Company Profile |
SEC |
Zacks Reports |
StockTalk |
News |
Chart |
Request a new note
C
A N
S L
I M
|
PCLN
-
NASDAQ
Priceline.Com Inc
INTERNET - Internet Software and Services
|
$506.27
|
-10.67
-2.06% |
$521.00
|
1,306,846
110.22% of 50 DAV
50 DAV is 1,185,700
|
$522.00
-3.01%
|
1/3/2011
|
$399.55
|
PP = $428.20
|
|
MB = $449.61
|
Most Recent Note - 4/4/2011 4:07:29 PM
G - Rose to another new 52-week high with below average volume behind today's 5th consecutive gain, getting extended from any sound base pattern. Its 50 DMA line has defined support throughout its advance.
>>> The latest Featured Stock Update with an annotated graph appeared on 3/21/2011. Click here.
View all notes |
Alert me of new notes |
CANSLIM.net Company Profile |
SEC |
Zacks Reports |
StockTalk |
News |
Chart |
Request a new note
C
A N
S L
I M
|
RAX
-
NYSE
Rackspace Hosting Inc
INTERNET - Internet Software and; Services
|
$42.07
|
-0.89
-2.07% |
$43.38
|
2,242,551
125.77% of 50 DAV
50 DAV is 1,783,000
|
$44.19
-4.80%
|
3/16/2011
|
$36.28
|
PP = $40.72
|
|
MB = $42.76
|
Most Recent Note - 4/6/2011 1:40:02 PM
Y - Color code is changed to yellow while consolidating back within 5% of its pivot point. Approximately 40% of successful breakouts pullback and test support at prior resistance before continuing higher. As previously noted, "Prior high near $40 defines chart support to watch on pullbacks."
>>> The latest Featured Stock Update with an annotated graph appeared on 3/16/2011. Click here.
View all notes |
Alert me of new notes |
CANSLIM.net Company Profile |
SEC |
Zacks Reports |
StockTalk |
News |
Chart |
Request a new note
C
A N
S L
I M
|
TIBX
-
NASDAQ
Tibco Software Inc
COMPUTER SOFTWARE and SERVICES - Business Software and Services
|
$27.55
|
-0.02
-0.07% |
$27.93
|
2,200,266
89.75% of 50 DAV
50 DAV is 2,451,600
|
$28.31
-2.67%
|
3/18/2011
|
$23.88
|
PP = $26.04
|
|
MB = $27.34
|
Most Recent Note - 4/4/2011 4:14:26 PM
G - Inched higher today with light volume for a 5th consecutive gain and a new high close. Extended from its prior base after a spurt of gains last week with above average volume, its color code was changed to green. Prior highs in the $25-26 area define support to watch on pullbacks.
>>> The latest Featured Stock Update with an annotated graph appeared on 3/18/2011. Click here.
View all notes |
Alert me of new notes |
CANSLIM.net Company Profile |
SEC |
Zacks Reports |
StockTalk |
News |
Chart |
Request a new note
C
A N
S L
I M
|
UA
-
NYSE
Under Armour Inc Cl A
CONSUMER NON-DURABLES - Textile - Apparel Clothing
|
$73.90
|
-2.15
-2.83% |
$76.66
|
894,826
104.55% of 50 DAV
50 DAV is 855,900
|
$76.85
-3.84%
|
3/31/2011
|
$68.04
|
PP = $70.79
|
|
MB = $74.33
|
Most Recent Note - 4/6/2011 1:55:52 PM
Y - Color code is changed to yellow while consolidating back within 5% of its pivot point today following 3 consecutive volume-driven gains into new all-time high territory. Prior highs in the $70 area define support to watch.
>>> The latest Featured Stock Update with an annotated graph appeared on 4/1/2011. Click here.
View all notes |
Alert me of new notes |
CANSLIM.net Company Profile |
SEC |
Zacks Reports |
StockTalk |
News |
Chart |
Request a new note
C
A N
S L
I M
|
Symbol/Exchange
Company Name
Industry Group |
PRICE |
CHANGE
(%Change) |
Day High |
Volume
(% DAV)
(% 50 day avg vol) |
52 Wk Hi
% From Hi |
Featured
Date |
Price
Featured |
Pivot Featured |
|
Max Buy |
ULTA
-
NASDAQ
Ulta Salon Cosm & Frag
SPECIALTY RETAIL - Specialty Retail, Other
|
$49.85
|
+0.04
0.08% |
$50.15
|
344,790
56.16% of 50 DAV
50 DAV is 613,900
|
$49.95
-0.20%
|
1/6/2011
|
$36.12
|
PP = $37.34
|
|
MB = $39.21
|
Most Recent Note - 4/5/2011 11:24:07 AM
G - Up today for another new all-time high, yet in recent weeks it has been wedging higher without great volume conviction. Prior highs and its 50 DMA line define chart support to watch near the $44 level on pullbacks.
>>> The latest Featured Stock Update with an annotated graph appeared on 3/29/2011. Click here.
View all notes |
Alert me of new notes |
CANSLIM.net Company Profile |
SEC |
Zacks Reports |
StockTalk |
News |
Chart |
Request a new note
C
A N
S L
I M
|