***Last / Change / Volume data in this table is the closing quote data***
Symbol/Exchange
Company Name
Industry Group |
PRICE |
CHANGE
(%Change) |
Day High |
Volume
(% DAV)
(% 50 day avg vol) |
52 Wk Hi
% From Hi |
Featured
Date |
Price
Featured |
Pivot Featured |
|
Max Buy |
BIDU
-
NASDAQ
Baidu Inc Ads
INTERNET - Internet Information Providers
|
$143.11
|
+4.28
3.08% |
$143.11
|
8,110,121
116.52% of 50 DAV
50 DAV is 6,960,300
|
$139.44
2.63%
|
3/17/2011
|
$121.97
|
PP = $131.73
|
|
MB = $138.32
|
 Most Recent Note - 4/4/2011 2:00:17 PM
G - Up today for a 5th consecutive gain and another new all-time high. Color code was changed to green after getting extended from its prior base, rising above its "max buy" level. Market conditions (M criteria) have recognizably improved in terms of leadership (new 52-week highs) in recent weeks without a strictly defined follow-through day. Prior high near $131 defines initial chart support to watch.
>>> The latest Featured Stock Update with an annotated graph appeared on 3/9/2011. Click here.
View all notes |
Alert me of new notes |
CANSLIM.net Company Profile |
SEC |
Zacks Reports |
StockTalk |
News |
Chart |
Request a new note
C
A N
S L
I M


|
CMG
-
NYSE
Chipotle Mexican Grill
LEISURE - Restaurants
|
$273.91
|
-0.09
-0.03% |
$277.77
|
662,543
60.80% of 50 DAV
50 DAV is 1,089,700
|
$278.00
-1.47%
|
4/1/2011
|
$274.00
|
PP = $275.10
|
|
MB = $288.86
|
Most Recent Note - 4/1/2011 9:07:55 PM
Y - Touched a new all-time high today with average volume behind its 8th consecutive gain, steadily rising from support at its 50 DMA line. Color code is changed to yellow with new pivot point cited based on its prior high plus 10 cents after an orderly 7-week base pattern. Disciplined investors know to watch for confirming gains with above average volume to trigger a new (or add-on) technical buy signal.
>>> The latest Featured Stock Update with an annotated graph appeared on 3/14/2011. Click here.
View all notes |
Alert me of new notes |
CANSLIM.net Company Profile |
SEC |
Zacks Reports |
StockTalk |
News |
Chart |
Request a new note
C
A N
S L
I M
|
CTCT
-
NASDAQ
Constant Contact Inc
MEDIA - Advertising Services
|
$35.31
|
-0.06
-0.17% |
$36.33
|
393,309
93.78% of 50 DAV
50 DAV is 419,400
|
$36.13
-2.27%
|
3/22/2011
|
$33.59
|
PP = $32.49
|
|
MB = $34.11
|
Most Recent Note - 4/4/2011 3:29:37 PM
G - Hit another new high today then reversed into the red. Color code was changed to green while getting extended from its prior base. Prior highs in the $32 area define support to watch above its 50 DMA line. Approximately 40% of successful winners pull back and test support at their prior resistance level before continuing higher. Disciplined investors always limit losses if a stock falls more than -7% from their purchase price.
>>> The latest Featured Stock Update with an annotated graph appeared on 3/22/2011. Click here.
View all notes |
Alert me of new notes |
CANSLIM.net Company Profile |
SEC |
Zacks Reports |
StockTalk |
News |
Chart |
Request a new note
C
A N
S L
I M
|
CTSH
-
NASDAQ
Cognizant Tech Sol Cl A
COMPUTER SOFTWARE and SERVICES - Business Software and Services
|
$82.35
|
-0.06
-0.07% |
$82.76
|
1,361,241
58.30% of 50 DAV
50 DAV is 2,335,000
|
$82.86
-0.62%
|
2/7/2011
|
$75.09
|
PP = $76.46
|
|
MB = $80.28
|
Most Recent Note - 4/1/2011 2:19:47 PM
G - Hit new 52-week highs (N criteria) this week, wedging higher with gains on light volume. No resistance remains due to overhead supply. Color code was changed to green after gains above its "max buy" level without heavy enough volume to trigger a proper technical buy signal. Market conditions (M criteria) have recognizably improved in terms of leadership (new 52-week highs) in recent weeks without a strictly defined follow-through day.
>>> The latest Featured Stock Update with an annotated graph appeared on 3/17/2011. Click here.
View all notes |
Alert me of new notes |
CANSLIM.net Company Profile |
SEC |
Zacks Reports |
StockTalk |
News |
Chart |
Request a new note
C
A N
S L
I M
|
DECK
-
NASDAQ
Deckers Outdoor Corp
CONSUMER NON-DURABLES - Textile - Apparel Footwear
|
$89.08
|
+1.74
1.99% |
$89.28
|
656,394
47.46% of 50 DAV
50 DAV is 1,383,000
|
$94.70
-5.93%
|
2/3/2011
|
$79.61
|
PP = $82.67
|
|
MB = $86.80
|
Most Recent Note - 4/4/2011 4:02:31 PM
G - Today's gain with light volume has it -6.0% off its 52-week high. Color code was changed to green after rallying back above the previously cited "max buy" level after an earlier double bottom pattern noted. Its recent low ($77.71 on 3/21/11) defines the next important chart support level.
>>> The latest Featured Stock Update with an annotated graph appeared on 3/3/2011. Click here.
View all notes |
Alert me of new notes |
CANSLIM.net Company Profile |
SEC |
Zacks Reports |
StockTalk |
News |
Chart |
Request a new note
C
A N
S L
I M
|
Symbol/Exchange
Company Name
Industry Group |
PRICE |
CHANGE
(%Change) |
Day High |
Volume
(% DAV)
(% 50 day avg vol) |
52 Wk Hi
% From Hi |
Featured
Date |
Price
Featured |
Pivot Featured |
|
Max Buy |
EZPW
-
NASDAQ
Ezcorp Inc Cl A
SPECIALTY RETAIL - Specialty Retail, Other
|
$31.97
|
+0.89
2.85% |
$32.13
|
322,251
89.74% of 50 DAV
50 DAV is 359,100
|
$31.80
0.53%
|
2/18/2011
|
$27.94
|
PP = $30.04
|
|
MB = $31.54
|
Most Recent Note - 4/4/2011 1:58:11 PM
G - Gapped up today, and its color code is changed to green while volume is below average and it has rallied above its "max buy" level. Market conditions (M criteria) have recognizably improved in terms of leadership (new 52-week highs) in recent weeks without a strictly defined follow-through day.
>>> The latest Featured Stock Update with an annotated graph appeared on 3/10/2011. Click here.
View all notes |
Alert me of new notes |
CANSLIM.net Company Profile |
SEC |
Zacks Reports |
StockTalk |
News |
Chart |
Request a new note
C
A N
S L
I M
|
FOSL
-
NASDAQ
Fossil Inc
CONSUMER DURABLES - Recreational Goods, Other
|
$93.52
|
-0.09
-0.10% |
$94.22
|
746,819
76.87% of 50 DAV
50 DAV is 971,500
|
$94.77
-1.32%
|
2/1/2011
|
$73.30
|
PP = $74.44
|
|
MB = $78.16
|
Most Recent Note - 4/4/2011 4:04:40 PM
G - Holding its ground at all-time highs, extended from any sound base. Prior highs in the $83-85 area define chart support to watch above its 50 DMA line.
>>> The latest Featured Stock Update with an annotated graph appeared on 3/30/2011. Click here.
View all notes |
Alert me of new notes |
CANSLIM.net Company Profile |
SEC |
Zacks Reports |
StockTalk |
News |
Chart |
Request a new note
C
A N
S L
I M
|
HMSY
-
NASDAQ
H M S Holdings Corp
COMPUTER SOFTWARE and SERVICES - Healthcare Information Service
|
$83.75
|
+1.06
1.28% |
$83.83
|
121,674
72.99% of 50 DAV
50 DAV is 166,700
|
$83.98
-0.27%
|
11/19/2010
|
$61.89
|
PP = $63.01
|
|
MB = $66.16
|
Most Recent Note - 4/4/2011 4:05:58 PM
G - Up again today with light volume for another best-ever close. It is extended from any sound base pattern and its 50 DMA line defines support to watch on pullbacks.
>>> The latest Featured Stock Update with an annotated graph appeared on 3/25/2011. Click here.
View all notes |
Alert me of new notes |
CANSLIM.net Company Profile |
SEC |
Zacks Reports |
StockTalk |
News |
Chart |
Request a new note
C
A N
S L
I M
|
HS
-
NYSE
Healthspring Inc
HEALTH SERVICES - Health Care Plans
|
$40.10
|
+1.08
2.77% |
$40.78
|
1,620,264
204.92% of 50 DAV
50 DAV is 790,700
|
$39.58
1.31%
|
3/22/2011
|
$38.29
|
PP = $38.85
|
|
MB = $40.79
|
Most Recent Note - 4/4/2011 12:41:13 PM
Y - Gapped up today, hitting new highs near its "max buy" level. The prior gain with above average volume cleared the previously cited pivot point triggering a new (or add-on) technical buy signal. The new Public Offering completed on 3/25/11 may hinder its upward progress for the near-term, however it has been attracting top-rated funds as owners (I criteria).
>>> The latest Featured Stock Update with an annotated graph appeared on 3/23/2011. Click here.
View all notes |
Alert me of new notes |
CANSLIM.net Company Profile |
SEC |
Zacks Reports |
StockTalk |
News |
Chart |
Request a new note
C
A N
S L
I M
|
INFA
-
NASDAQ
Informatica Corp
COMPUTER SOFTWARE and SERVICES - Business Software and Services
|
$52.01
|
-0.18
-0.34% |
$52.70
|
695,226
74.08% of 50 DAV
50 DAV is 938,500
|
$52.96
-1.79%
|
3/24/2011
|
$50.04
|
PP = $49.86
|
|
MB = $52.35
|
Most Recent Note - 4/4/2011 4:27:25 PM
Y - Consolidating near its "max buy" level with volume totals recently cooling. Prior highs in the $49 area define initial support to watch.
>>> The latest Featured Stock Update with an annotated graph appeared on 3/28/2011. Click here.
View all notes |
Alert me of new notes |
CANSLIM.net Company Profile |
SEC |
Zacks Reports |
StockTalk |
News |
Chart |
Request a new note
C
A N
S L
I M
|
Symbol/Exchange
Company Name
Industry Group |
PRICE |
CHANGE
(%Change) |
Day High |
Volume
(% DAV)
(% 50 day avg vol) |
52 Wk Hi
% From Hi |
Featured
Date |
Price
Featured |
Pivot Featured |
|
Max Buy |
LULU
-
NASDAQ
Lululemon Athletica
MANUFACTURING - Textile Manufacturing
|
$90.94
|
+1.81
2.03% |
$91.00
|
1,693,515
75.54% of 50 DAV
50 DAV is 2,241,900
|
$90.97
-0.03%
|
3/28/2011
|
$68.11
|
PP = $85.38
|
|
MB = $89.65
|
Most Recent Note - 4/4/2011 2:02:33 PM
G - Rising above its "max buy" level again today and its color code is changed to green again. Technically it broke out last week with considerable volume-driven gains from a new base-on-base pattern. Prior highs in the $85 area define initial chart support to watch.
>>> The latest Featured Stock Update with an annotated graph appeared on 3/31/2011. Click here.
View all notes |
Alert me of new notes |
CANSLIM.net Company Profile |
SEC |
Zacks Reports |
StockTalk |
News |
Chart |
Request a new note
C
A N
S L
I M
|
MG
-
NYSE
Mistras Group Inc
DIVERSIFIED SERVICES - Bulding and Faci;ity Management Services
|
$16.85
|
-0.25
-1.46% |
$17.08
|
135,045
124.93% of 50 DAV
50 DAV is 108,100
|
$17.33
-2.77%
|
3/15/2011
|
$15.48
|
PP = $15.90
|
|
MB = $16.70
|
Most Recent Note - 4/4/2011 4:20:35 PM
G - Its small gap down today with slightly above average volume completed an "island reversal" pattern following an earlier 3/21/11 gap up gain, raising some concerns. Repeatedly noted as extended from a sound base pattern. Prior highs and its 50 DMA line define important support to watch on pullbacks.
>>> The latest Featured Stock Update with an annotated graph appeared on 3/15/2011. Click here.
View all notes |
Alert me of new notes |
CANSLIM.net Company Profile |
SEC |
Zacks Reports |
StockTalk |
News |
Chart |
Request a new note
C
A N
S L
I M
|
MWIV
-
NASDAQ
M W I Veterinary Supply
HEALTH SERVICES - Medical Instruments and; Supplies
|
$79.02
|
+0.05
0.06% |
$79.50
|
140,413
147.03% of 50 DAV
50 DAV is 95,500
|
$80.86
-2.28%
|
11/4/2010
|
$61.79
|
PP = $59.60
|
|
MB = $62.58
|
Most Recent Note - 4/4/2011 4:22:54 PM
G - Perched near all-time highs, consolidating above its recently noted tight trading range. It has been repeatedly noted - "Extended from any sound base pattern."
>>> The latest Featured Stock Update with an annotated graph appeared on 3/8/2011. Click here.
View all notes |
Alert me of new notes |
CANSLIM.net Company Profile |
SEC |
Zacks Reports |
StockTalk |
News |
Chart |
Request a new note
C
A N
S L
I M
|
OPEN
-
NASDAQ
Opentable Inc
INTERNET - Internet Software and Services
|
$108.87
|
+2.65
2.49% |
$109.06
|
1,239,984
102.93% of 50 DAV
50 DAV is 1,204,700
|
$107.47
1.30%
|
3/17/2011
|
$90.71
|
PP = $96.07
|
|
MB = $100.87
|
Most Recent Note - 4/4/2011 4:23:51 PM
G - Gain today with average volume for a new all-time high, getting more extended from its recently noted base. Its prior high near $96 defines initial support to watch on pullbacks following its latest technical breakout.
>>> The latest Featured Stock Update with an annotated graph appeared on 3/24/2011. Click here.
View all notes |
Alert me of new notes |
CANSLIM.net Company Profile |
SEC |
Zacks Reports |
StockTalk |
News |
Chart |
Request a new note
C
A N
S L
I M
|
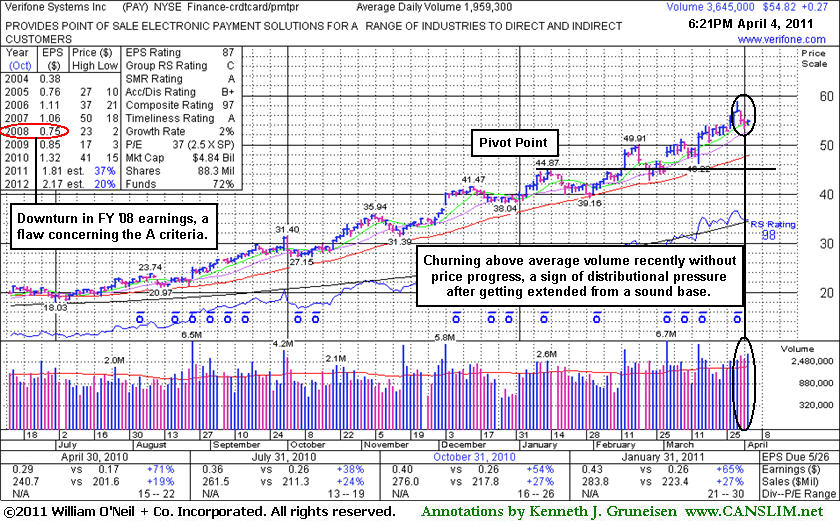
PAY
-
NYSE
Verifone Systems Inc
COMPUTER HARDWARE - Transaction Automation Systems
|
$54.82
|
+0.27
0.49% |
$55.08
|
3,648,687
186.22% of 50 DAV
50 DAV is 1,959,300
|
$58.88
-6.90%
|
1/27/2011
|
$41.77
|
PP = $44.97
|
|
MB = $47.22
|
Most Recent Note - 4/4/2011 4:25:56 PM
G - Perched near its all-time high, holding its ground while enduring some distributional pressure. Repeatedly noted - "No resistance remains due to overhead supply, but it is extended from a sound base pattern. Its 50 DMA line defines chart support to watch."
>>> The latest Featured Stock Update with an annotated graph appeared on 4/4/2011. Click here.
View all notes |
Alert me of new notes |
CANSLIM.net Company Profile |
SEC |
Zacks Reports |
StockTalk |
News |
Chart |
Request a new note
C
A N
S L
I M
|
Symbol/Exchange
Company Name
Industry Group |
PRICE |
CHANGE
(%Change) |
Day High |
Volume
(% DAV)
(% 50 day avg vol) |
52 Wk Hi
% From Hi |
Featured
Date |
Price
Featured |
Pivot Featured |
|
Max Buy |
PCLN
-
NASDAQ
Priceline.Com Inc
INTERNET - Internet Software and Services
|
$518.59
|
+4.74
0.92% |
$518.68
|
884,064
74.25% of 50 DAV
50 DAV is 1,190,700
|
$515.64
0.57%
|
1/3/2011
|
$399.55
|
PP = $428.20
|
|
MB = $449.61
|
Most Recent Note - 4/4/2011 4:07:29 PM
G - Rose to another new 52-week high with below average volume behind today's 5th consecutive gain, getting extended from any sound base pattern. Its 50 DMA line has defined support throughout its advance.
>>> The latest Featured Stock Update with an annotated graph appeared on 3/21/2011. Click here.
View all notes |
Alert me of new notes |
CANSLIM.net Company Profile |
SEC |
Zacks Reports |
StockTalk |
News |
Chart |
Request a new note
C
A N
S L
I M
|
RAX
-
NYSE
Rackspace Hosting Inc
INTERNET - Internet Software and; Services
|
$42.75
|
-0.39
-0.90% |
$43.48
|
1,732,612
96.04% of 50 DAV
50 DAV is 1,804,000
|
$44.19
-3.26%
|
3/16/2011
|
$36.28
|
PP = $40.72
|
|
MB = $42.76
|
Most Recent Note - 4/4/2011 4:12:33 PM
G - Holding its ground in a tight range near its all-time high, extended from its orderly 7-week flat base. Prior high near $40 defines chart support to watch on pullbacks. Disciplined investors avoid chasing extended stocks.
>>> The latest Featured Stock Update with an annotated graph appeared on 3/16/2011. Click here.
View all notes |
Alert me of new notes |
CANSLIM.net Company Profile |
SEC |
Zacks Reports |
StockTalk |
News |
Chart |
Request a new note
C
A N
S L
I M
|
TIBX
-
NASDAQ
Tibco Software Inc
COMPUTER SOFTWARE and SERVICES - Business Software and Services
|
$27.59
|
-0.01
-0.04% |
$27.93
|
2,010,734
80.88% of 50 DAV
50 DAV is 2,486,200
|
$28.31
-2.53%
|
3/18/2011
|
$23.88
|
PP = $26.04
|
|
MB = $27.34
|
Most Recent Note - 4/4/2011 4:14:26 PM
G - Inched higher today with light volume for a 5th consecutive gain and a new high close. Extended from its prior base after a spurt of gains last week with above average volume, its color code was changed to green. Prior highs in the $25-26 area define support to watch on pullbacks.
>>> The latest Featured Stock Update with an annotated graph appeared on 3/18/2011. Click here.
View all notes |
Alert me of new notes |
CANSLIM.net Company Profile |
SEC |
Zacks Reports |
StockTalk |
News |
Chart |
Request a new note
C
A N
S L
I M
|
UA
-
NYSE
Under Armour Inc Cl A
CONSUMER NON-DURABLES - Textile - Apparel Clothing
|
$74.55
|
+1.32
1.80% |
$75.00
|
1,156,844
135.00% of 50 DAV
50 DAV is 856,900
|
$74.12
0.58%
|
3/31/2011
|
$68.04
|
PP = $70.79
|
|
MB = $74.33
|
Most Recent Note - 4/4/2011 4:17:34 PM
G - Hit another new all-time high today, rising further above its 2007 all-time high ($73.40), and its color code is changed to green. A volume-driven gain above its pivot point triggered a new (or add-on) technical buy signal on 4/01/11 as it rose from a base-on-base type pattern. See the latest FSU analysis for more details and a new annotated graph.
>>> The latest Featured Stock Update with an annotated graph appeared on 4/1/2011. Click here.
View all notes |
Alert me of new notes |
CANSLIM.net Company Profile |
SEC |
Zacks Reports |
StockTalk |
News |
Chart |
Request a new note
C
A N
S L
I M
|
ULTA
-
NASDAQ
Ulta Salon Cosm & Frag
SPECIALTY RETAIL - Specialty Retail, Other
|
$48.28
|
-0.17
-0.35% |
$48.78
|
290,723
47.83% of 50 DAV
50 DAV is 607,800
|
$48.88
-1.23%
|
1/6/2011
|
$36.12
|
PP = $37.34
|
|
MB = $39.21
|
Most Recent Note - 4/1/2011 9:11:14 PM
G - Perched at its all-time high, stubbornly holding its ground after a spurt of volume-driven gains. Prior highs and its 50 DMA line define chart support near the $44 level.
>>> The latest Featured Stock Update with an annotated graph appeared on 3/29/2011. Click here.
View all notes |
Alert me of new notes |
CANSLIM.net Company Profile |
SEC |
Zacks Reports |
StockTalk |
News |
Chart |
Request a new note
C
A N
S L
I M
|
Symbol/Exchange
Company Name
Industry Group |
PRICE |
CHANGE
(%Change) |
Day High |
Volume
(% DAV)
(% 50 day avg vol) |
52 Wk Hi
% From Hi |
Featured
Date |
Price
Featured |
Pivot Featured |
|
Max Buy |