You are not logged in.
This means you
CAN ONLY VIEW reports that were published prior to Tuesday, July 9, 2024.
You
MUST UPGRADE YOUR MEMBERSHIP if you want to see any current reports.
AFTER MARKET UPDATE - WEDNESDAY, APRIL 3RD, 2024
Previous After Market Report Next After Market Report >>>
|
|
|
|
DOW |
-43.10 |
39,127.14 |
-0.11% |
|
Volume |
939,016,065 |
-9% |
|
Volume |
5,263,039,300 |
+10% |
|
NASDAQ |
+37.01 |
16,277.46 |
+0.23% |
|
Advancers |
1,632 |
59% |
|
Advancers |
2,344 |
55% |
|
S&P 500 |
+5.68 |
5,211.49 |
+0.11% |
|
Decliners |
1,131 |
41% |
|
Decliners |
1,902 |
45% |
|
Russell 2000 |
+11.17 |
2,076.20 |
+0.54% |
|
52 Wk Highs |
151 |
|
|
52 Wk Highs |
119 |
|
|
S&P 600 |
+6.80 |
1,314.65 |
+0.52% |
|
52 Wk Lows |
35 |
|
|
52 Wk Lows |
131 |
|
|
 |
Leadership Improved as Major Indices Ended Mixed
Kenneth J. Gruneisen - Passed the CAN SLIM® Master's Exam
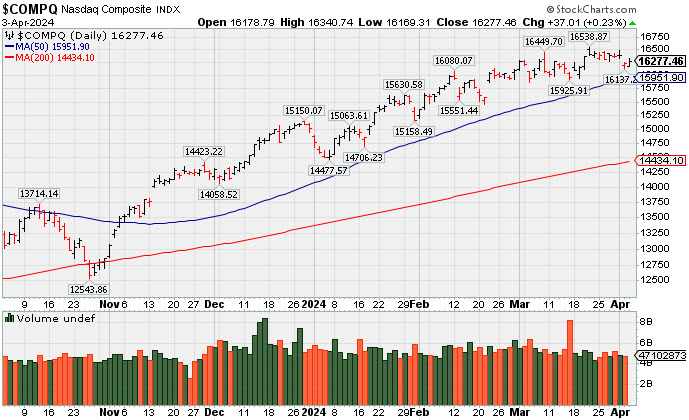
The major indices ended mixed and little changed on Wednesday. Volume reported was mixed, lighter than the prior session total on the NYSE and higher on the Nasdaq exchange. Breadth was slightly positive as advancers led decliners by a 4-3 margin on the NYSE and by a 6-5 margin on the Nasdaq exchange. Leadership improved as there were 57 high-ranked companies from the Leaders List that hit new 52-week highs and were listed on the BreakOuts Page, versus the total of 23 on the prior session. New 52-week highs outnumbered new 52-week lows on the NYSE, but new lows still slightly outnumbered new highs on the Nasdaq exchange. The major indices are in a confirmed uptrend (M criteria). New buying efforts should be only made in stocks fitting all key criteria of the fact-based investment system.
PICTURED: The Nasdaq Composite Index pulled back near its 50-day moving average immediately after touching a new 2024 high.
Intel (INTC -8.22%) was a notable decliner after outlining a new financial reporting structure to reflect the transition to a foundry operating model. Its operating losses are expected to peak in 2024. Paramount Global (PARA +14.97%), Dell Technologies Inc. (DELL +8.56%), and Spotify Technology S.A. (SPOT +8.23%) were standout gainers.
Four of the S&P 500 sectors lost ground while seven ended higher. The energy sector was among the outperformers, rising alongside oil prices. WTI crude oil futures extended recent gains ($85.44/bbl, +0.26, +0.3%) based upon increased geopolitical tensions in the Middle East.
A softer than expected report came in for the ISM Services PMI for March. The 10-yr note yield settled at 4.36%, one basis point lower. The 2-yr note yield settled at 4.68%, down two basis points.
|
 Kenneth J. Gruneisen started out as a licensed stockbroker in August 1987, a couple of months prior to the historic stock market crash that took the Dow Jones Industrial Average down -22.6% in a single day. He has published daily fact-based fundamental and technical analysis on high-ranked stocks online for two decades. Through FACTBASEDINVESTING.COM, Kenneth provides educational articles, news, market commentary, and other information regarding proven investment systems that work in good times and bad.
Comments contained in the body of this report are technical opinions only and are not necessarily those of Gruneisen Growth Corp. The material herein has been obtained from sources believed to be reliable and accurate, however, its accuracy and completeness cannot be guaranteed. Our firm, employees, and customers may effect transactions, including transactions contrary to any recommendation herein, or have positions in the securities mentioned herein or options with respect thereto. Any recommendation contained in this report may not be suitable for all investors and it is not to be deemed an offer or solicitation on our part with respect to the purchase or sale of any securities. |
|
 |
Commodity-Linked Groups Posted Standout Gains Again
Kenneth J. Gruneisen - Passed the CAN SLIM® Master's Exam
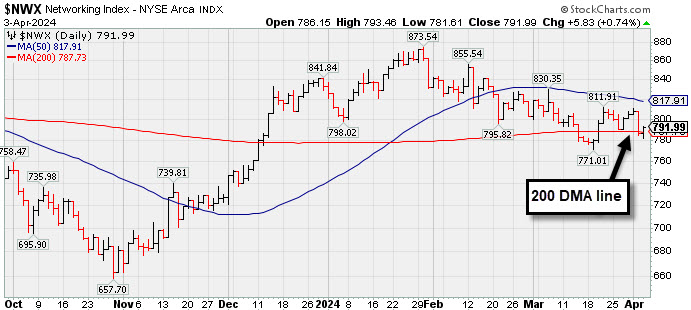
The Broker/Dealer Index ($XBD +0.80%) posted a solid gain while the Bank Index ($BKX -0.08%) and the Retail Index ($RLX +0.05%) both were little changed. The tech sector had a slightly positive bias as the Networking Index ($NWX +0.74%) and Semiconductor Index ($SOX +0.34%) both outpaced the Biotech Index ($BTK +0.05%). Commodity-linked groups again had a positive bias as the Gold & Silver Index ($XAU +2.87%), Integrated Oil Index ($XOI +1.14%), and the Oil Services Index ($OSX +1.57%) posted unanimous gains.
![]() PICTURED: The Networking Index ($NWX +0.74%) is sputtering near its 200-day moving average (DMA) line.
| Oil Services |
$OSX |
95.25 |
+1.48 |
+1.57% |
+13.55% |
| Integrated Oil |
$XOI |
2,236.19 |
+25.19 |
+1.14% |
+20.07% |
| Semiconductor |
$SOX |
4,903.50 |
+16.56 |
+0.34% |
+17.44% |
| Networking |
$NWX |
791.99 |
+5.83 |
+0.74% |
-4.90% |
| Broker/Dealer |
$XBD |
608.56 |
+4.85 |
+0.80% |
+9.20% |
| Retail |
$RLX |
4,462.58 |
+2.04 |
+0.05% |
+14.76% |
| Gold & Silver |
$XAU |
134.33 |
+3.75 |
+2.87% |
+6.87% |
| Bank |
$BKX |
102.59 |
-0.08 |
-0.08% |
+6.84% |
| Biotech |
$BTK |
5,219.78 |
+2.67 |
+0.05% |
-3.67% |
|
|
|
 |
Volume Cools While Consolidating Above 50-Day Moving Average Line
Kenneth J. Gruneisen - Passed the CAN SLIM® Master's Exam
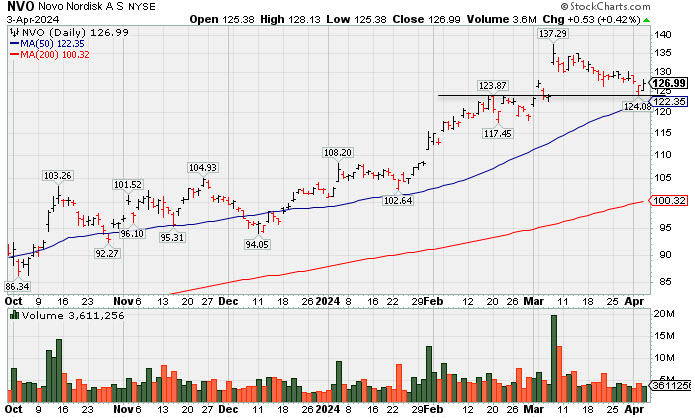
Novo Nordisk (NVO +$0.69 or +0.55% to $127.15) halted its slide with a small gain today backed by light volume. It has been pulling back with recent losses backed by below-average volume. Its 50-day moving average (DMA) line ($123.08) defines near-term support above prior lows in the $118 area. Its color code was changed to yellow while testing near the pivot point of the previously noted "3-weeks tight" base.
This Denmark-based Medical - Ethical Drugs firm's shares split 2-1 on 9/20/23. NVO reported Dec '23 quarterly earnings +68% on +41% sales revenues versus the year-ago period, its 4th strong quarter well above the +25% minimum earnings guideline (C criteria). Annual earnings growth has been strong and steady. It has a 98 Earnings Per Share Rating, well above the 80+ minimum for buy candidates.
The number of top-rated funds owning its shares rose from 372 in Dec '22 to 527 in Dec '23, a reassuring sign concerning the I criteria. Its current Up/Down Volume Ratio of 1.0 is an unbiased indication its shares have been neutral concerning accumulation/distribution over the past 50 days. It has a Timeliness Rating of B and an Accumulation/Distribution Rating of B+. |
|
|
Color Codes Explained :
Y - Better candidates highlighted by our
staff of experts.
G - Previously featured
in past reports as yellow but may no longer be buyable under the
guidelines.
***Last / Change / Volume data in this table is the closing quote data***
Symbol/Exchange
Company Name
Industry Group |
PRICE |
CHANGE
(%Change) |
Day High |
Volume
(% DAV)
(% 50 day avg vol) |
52 Wk Hi
% From Hi |
Featured
Date |
Price
Featured |
Pivot Featured |
|
Max Buy |
 ANET
-
NYSE
ANET
-
NYSE
Arista Networks
Computer-Networking
|
$298.79
|
+7.94
2.73% |
$301.49
|
1,788,452
65.75% of 50 DAV
50 DAV is 2,720,000
|
$307.74
-2.91%
|
3/18/2024
|
$188.84
|
PP = $292.76
|
|
MB = $307.40
|
Most Recent Note - 4/2/2024 11:47:23 AM
Y - Gapped down today, pulling back after rebounding near its all-time high with gains lacking great volume conviction. Found support near prior highs in the $292 area and additional near-term support to watch is its 50 DMA line ($277) and an upward trendline connecting its October-March lows.
>>> FEATURED STOCK ARTICLE : Consolidating Abover Recent Highs and Above 50-Day Average - 3/26/2024 |
View all notes |
Set NEW NOTE alert |
Company Profile |
SEC
News |
Chart |
Request a new note
C
A
S
I |
NVO
-
NYSE
Novo Nordisk ADR
Medical-Ethical Drugs
|
$126.99
|
+0.53
0.42% |
$128.13
|
3,611,252
65.87% of 50 DAV
50 DAV is 5,482,000
|
$138.28
-8.16%
|
3/1/2024
|
$124.23
|
PP = $124.97
|
|
MB = $131.22
|
 Most Recent Note - 4/3/2024 5:30:26 PM
Y - Posted a small gain today with light volume. It has been pulling back with recent losses backed by below-average volume, testing near the pivot point of the previously noted "3-weeks tight" base. Its 50 DMA line ($123) defines near-term support above prior lows in the $118 area. See the latest FSU analysis for more details and a new annotated graph.
>>> FEATURED STOCK ARTICLE : Volume Cools While Consolidating Above 50-Day Moving Average Line - 4/3/2024 |
View all notes |
Set NEW NOTE alert |
Company Profile |
SEC
News |
Chart |
Request a new note
C
A
S
I |
AXON
-
NASDAQ
Axon Enterprise
Security/Sfty
|
$309.20
|
-0.17
-0.05% |
$311.68
|
344,734
69.50% of 50 DAV
50 DAV is 496,000
|
$325.63
-5.05%
|
11/8/2023
|
$220.13
|
PP = $223.30
|
|
MB = $234.47
|
Most Recent Note - 4/1/2024 9:16:28 PM
G - Pulled back for a 3rd consecutive small loss, still hovering in a tight range near its all-time high. Its 50-day moving average (DMA) line ($285.44) defines near-term support to watch. Fundamentals remain strong.
>>> FEATURED STOCK ARTICLE : Hovering Near All-Time High; Spiked Higher Following Earnings - 3/14/2024 |
View all notes |
Set NEW NOTE alert |
Company Profile |
SEC
News |
Chart |
Request a new note
C
A
S
I |
TDG
-
NYSE
TransDigm Group
Aerospace/Defense
|
$1,228.51
|
+24.69
2.05% |
$1,234.95
|
222,965
103.22% of 50 DAV
50 DAV is 216,000
|
$1,238.95
-0.84%
|
12/12/2023
|
$1,000.39
|
PP = $1,013.18
|
|
MB = $1,063.84
|
Most Recent Note - 4/1/2024 9:21:15 PM
G - Volume totals have still been cooling while stubbornly holding its ground after wedging to a new all-time high. Its 50 DMA line ($1,156) defines near-term support to watch.
>>> FEATURED STOCK ARTICLE : Perched in Tight Range Encountering Distribtion Near All-Time High - 3/15/2024 |
View all notes |
Set NEW NOTE alert |
Company Profile |
SEC
News |
Chart |
Request a new note
C
A
S
I |
CRWD
-
NASDAQ
CrowdStrike Holdings
Computer Sftwr-Security
|
$320.02
|
+0.47
0.15% |
$323.55
|
2,008,420
49.63% of 50 DAV
50 DAV is 4,047,000
|
$365.00
-12.32%
|
1/2/2024
|
$246.42
|
PP = $261.91
|
|
MB = $275.01
|
Most Recent Note - 4/1/2024 9:17:54 PM
G - Testing its 50 DMA ($315.63) which recently acted as support. It has not formed a sound base of sufficient length. Fundamentals remain strong after it reported Jan '24 quarterly earnings +102% on +33% sales revenues versus the year-ago period. See the latest FSU analysis for more details and a new annotated graph.
>>> FEATURED STOCK ARTICLE : 50-Day Moving Average Line Support Being Tested - 4/1/2024 |
View all notes |
Set NEW NOTE alert |
Company Profile |
SEC
News |
Chart |
Request a new note
C
A
S
I |
Symbol/Exchange
Company Name
Industry Group |
PRICE |
CHANGE
(%Change) |
Day High |
Volume
(% DAV)
(% 50 day avg vol) |
52 Wk Hi
% From Hi |
Featured
Date |
Price
Featured |
Pivot Featured |
|
Max Buy |
ELF
-
NYSE
e.l.f. Beauty
Cosmetics/Personal Care
|
$163.77
|
-22.16
-11.92% |
$179.75
|
4,080,850
265.51% of 50 DAV
50 DAV is 1,537,000
|
$221.83
-26.17%
|
1/2/2024
|
$138.23
|
PP = $153.63
|
|
MB = $161.31
|
Most Recent Note - 4/3/2024 5:34:53 PM
Suffered a big volume-driven loss today, its 8th consecutive loss. Violated its 50 DMA line ($185) line on the prior session triggering a technical sell signal. It will be dropped from the Featured Stocks list tonight.
>>> FEATURED STOCK ARTICLE : ELF Consolidating Above 50-Day Moving Average Line - 3/28/2024 |
View all notes |
Set NEW NOTE alert |
Company Profile |
SEC
News |
Chart |
Request a new note
C
A
S
I |
PCAR
-
NASDAQ
Paccar
Trucks and Parts-Hvy Duty
|
$120.43
|
-1.17
-0.96% |
$121.34
|
3,740,127
163.83% of 50 DAV
50 DAV is 2,283,000
|
$125.50
-4.04%
|
1/23/2024
|
$100.35
|
PP = $98.57
|
|
MB = $103.50
|
Most Recent Note - 4/3/2024 12:36:20 PM
G - Pulling back from its all-time high with today's 7th loss in the span of 8 sessions after getting very extended from any sound base. Its 50 DMA line ($111.80) defines near-term support to watch. Fundamentals remain strong.
>>> FEATURED STOCK ARTICLE : Hit New High With 5th Consecutive Gain - 3/21/2024 |
View all notes |
Set NEW NOTE alert |
Company Profile |
SEC
News |
Chart |
Request a new note
C
A
S
I |
HUBB
-
NYSE
Hubbell
Electrical-Power/Equipmt
|
$424.40
|
+8.86
2.13% |
$426.72
|
428,768
97.67% of 50 DAV
50 DAV is 439,000
|
$419.65
1.13%
|
1/30/2024
|
$343.26
|
PP = $336.83
|
|
MB = $353.67
|
Most Recent Note - 4/2/2024 11:49:08 AM
G - Stubbornly holding its ground near its all-time high with volume totals cooling. It is very extended from the previously noted base. Its 50 DMA line ($374) defines important support to watch on pullbacks.
>>> FEATURED STOCK ARTICLE : Hubbell Perched at All-Time High After 5 Weekly Gains - 3/22/2024 |
View all notes |
Set NEW NOTE alert |
Company Profile |
SEC
News |
Chart |
Request a new note
C
A
S
I |
MANH
-
NASDAQ
Manhattan Associates
Computer Sftwr-Enterprse
|
$241.70
|
-1.06
-0.44% |
$244.80
|
388,859
102.60% of 50 DAV
50 DAV is 379,000
|
$266.94
-9.46%
|
1/31/2024
|
$240.57
|
PP = $230.71
|
|
MB = $242.25
|
Most Recent Note - 4/1/2024 9:18:56 PM
G - Down today and volume totals have been cooling while consolidating above its 50 DMA line ($245.59) which defines near-term support.
>>> FEATURED STOCK ARTICLE : Manhattan Associates Consolidating Above 50-Day Moving Average - 3/25/2024 |
View all notes |
Set NEW NOTE alert |
Company Profile |
SEC
News |
Chart |
Request a new note
C
A
S
I |
USLM
-
NASDAQ
U.S. Lime & Minerals
Bldg-Cement/Concrt/Ag
|
$301.04
|
+6.26
2.12% |
$304.00
|
29,577
123.24% of 50 DAV
50 DAV is 24,000
|
$307.48
-2.09%
|
2/9/2024
|
$254.68
|
PP = $265.09
|
|
MB = $278.34
|
Most Recent Note - 4/3/2024 12:41:57 PM
G - Posting a gain today while still hovering near its all-time high, extended from the previously noted base. Its 50 DMA line ($270) defines near-term support to watch above prior highs in the $265-266 area.
>>> FEATURED STOCK ARTICLE : Hit New All Time High With Light Volume Behind 5th Straight Gain - 3/13/2024 |
View all notes |
Set NEW NOTE alert |
Company Profile |
SEC
News |
Chart |
Request a new note
C
A
S
I |
Symbol/Exchange
Company Name
Industry Group |
PRICE |
CHANGE
(%Change) |
Day High |
Volume
(% DAV)
(% 50 day avg vol) |
52 Wk Hi
% From Hi |
Featured
Date |
Price
Featured |
Pivot Featured |
|
Max Buy |
NOW
-
NYSE
ServiceNow
Computer Sftwr-Enterprse
|
$759.16
|
+2.16
0.29% |
$764.70
|
564,109
44.31% of 50 DAV
50 DAV is 1,273,000
|
$815.32
-6.89%
|
2/22/2024
|
$771.75
|
PP = $815.32
|
|
MB = $856.09
|
Most Recent Note - 4/1/2024 9:20:33 PM
Y - Posted another small gain today with lighter volume, quietly consolidating near its 50 DMA line ($770). Prior lows in the $730 area define the next important near-term support to watch.
>>> FEATURED STOCK ARTICLE : NOW Quietly Rebounded Above 50-Day Moving Average Line - 3/20/2024 |
View all notes |
Set NEW NOTE alert |
Company Profile |
SEC
News |
Chart |
Request a new note
C
A
S
I |
SNPS
-
NASDAQ
Synopsys
Computer Sftwr-Design
|
$579.17
|
+9.35
1.64% |
$580.83
|
758,247
64.92% of 50 DAV
50 DAV is 1,168,000
|
$629.38
-7.98%
|
2/22/2024
|
$600.65
|
PP = $582.85
|
|
MB = $611.99
|
Most Recent Note - 4/2/2024 11:51:34 AM
Y - Consolidating just above near-term support to watch at its 50 DMA line ($564.48). More damaging losses would raise concerns and trigger a technical sell signal. Previously noted - " A strong volume-driven gain and close above the pivot point is needed to clinch a proper technical buy signal."
>>> FEATURED STOCK ARTICLE : Rallying From Support at 50-Day Moving Average Line - 3/19/2024 |
View all notes |
Set NEW NOTE alert |
Company Profile |
SEC
News |
Chart |
Request a new note
C
A
S
I |
PAY
-
NYSE
Paymentus Holdings
Finance-CrdtCard/PmtPr
|
$21.28
|
-0.59
-2.70% |
$21.81
|
458,018
132.38% of 50 DAV
50 DAV is 346,000
|
$25.21
-15.59%
|
3/5/2024
|
$19.97
|
PP = $18.89
|
|
MB = $19.83
|
Most Recent Note - 4/3/2024 5:32:13 PM
G - Suffered a 3rd consecutive loss today with above-average volume. It is extended from the previously noted base. Its 50 DMA line ($18.52) coincides with prior highs in the $18 range defining important support to watch on pullbacks.
>>> FEATURED STOCK ARTICLE : Consolidating After Powerful Breakout and Volume-Driven Gains - 3/27/2024 |
View all notes |
Set NEW NOTE alert |
Company Profile |
SEC
News |
Chart |
Request a new note
C
A
S
I |
|
|
|
THESE ARE NOT BUY RECOMMENDATIONS!
Comments contained in the body of this report are technical
opinions only. The material herein has been obtained
from sources believed to be reliable and accurate, however,
its accuracy and completeness cannot be guaranteed.
This site is not an investment advisor, hence it does
not endorse or recommend any securities or other investments.
Any recommendation contained in this report may not
be suitable for all investors and it is not to be deemed
an offer or solicitation on our part with respect to
the purchase or sale of any securities. All trademarks,
service marks and trade names appearing in this report
are the property of their respective owners, and are
likewise used for identification purposes only.
This report is a service available
only to active Paid Premium Members.
You may opt-out of receiving report notifications
at any time. Questions or comments may be submitted
by writing to Premium Membership Services 665 S.E. 10 Street, Suite 201 Deerfield Beach, FL 33441-5634 or by calling 1-800-965-8307
or 954-785-1121.
|
|
|