You are not logged in.
This means you
CAN ONLY VIEW reports that were published prior to Wednesday, April 16, 2025.
You
MUST UPGRADE YOUR MEMBERSHIP if you want to see any current reports.
AFTER MARKET UPDATE - TUESDAY, APRIL 2ND, 2024
Previous After Market Report Next After Market Report >>>
|
|
|
|
DOW |
-396.61 |
39,170.24 |
-1.00% |
|
Volume |
1,026,935,295 |
+26% |
|
Volume |
4,783,526,900 |
-1% |
|
NASDAQ |
-156.38 |
16,240.45 |
-0.95% |
|
Advancers |
693 |
25% |
|
Advancers |
1,188 |
28% |
|
S&P 500 |
-37.96 |
5,205.81 |
-0.72% |
|
Decliners |
2,083 |
75% |
|
Decliners |
3,068 |
72% |
|
Russell 2000 |
-37.80 |
2,065.04 |
-1.80% |
|
52 Wk Highs |
84 |
|
|
52 Wk Highs |
70 |
|
|
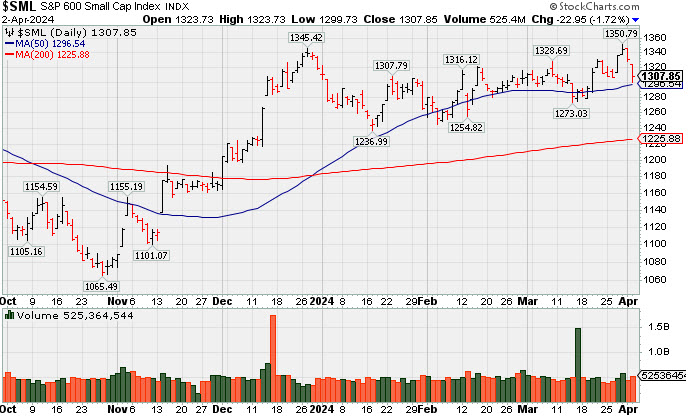
S&P 600 |
-22.95 |
1,307.85 |
-1.72% |
|
52 Wk Lows |
37 |
|
|
52 Wk Lows |
137 |
|
|
 |
Breadth Negative as Major Indices Fell
Kenneth J. Gruneisen - Passed the CAN SLIM® Master's Exam
The S&P 500 (-0.7%), Dow Jones Industrial Average (-1.0%), Russell 2000 (-1.8%) and the Nasdaq Composite (-1.0%) each fell. Volume reported was mixed, higher than the prior session total on the NYSE and lighter on the Nasdaq exchange. Breadth was clearly negative as decliners led advancers by a 3-1 margin on the NYSE and by nearly 3-1 on the Nasdaq exchange. Leadership waned as there were 23 high-ranked companies from the Leaders List that hit new 52-week highs and were listed on the BreakOuts Page, versus the total of 67 on the prior session. New 52-week highs totals contracted and but still outnumbered new 52-week lows on the NYSE, but new lows outnumbered new highs on the Nasdaq exchange. The major indices are in a confirmed uptrend (M criteria). New buying efforts should be only made in stocks fitting all key criteria of the fact-based investment system.
PICTURED: The S&P 600 Small cap Index pulled back near its 50-day moving average immediately after touching a new 2024 high.
Outsized losses in health insurers contributed to the negative bias. Humana (HUM -13.4%), CVS Health (CVS -7.2%), and UnitedHealth (UNH -6.4%) were the worst performing stocks in the S&P 500. Retailers were another weak area in the market. Disappointing quarterly results from PVH Corp (PVH -22.2%) stirred uncertainty about consumer spending.
The S&P 500 health care (-1.6%) and consumer discretionary (-1.3%) sectors were the worst performers. The energy sector outperformed, jumping 1.3%. This action was related to commodity prices. WTI crude oil futures climbed 1.7% to $85.18/bbl amid geopolitical tension in the Middle East. The 10-yr note yield rose another four basis points today to 4.37%.
|
 Kenneth J. Gruneisen started out as a licensed stockbroker in August 1987, a couple of months prior to the historic stock market crash that took the Dow Jones Industrial Average down -22.6% in a single day. He has published daily fact-based fundamental and technical analysis on high-ranked stocks online for two decades. Through FACTBASEDINVESTING.COM, Kenneth provides educational articles, news, market commentary, and other information regarding proven investment systems that work in good times and bad.
Comments contained in the body of this report are technical opinions only and are not necessarily those of Gruneisen Growth Corp. The material herein has been obtained from sources believed to be reliable and accurate, however, its accuracy and completeness cannot be guaranteed. Our firm, employees, and customers may effect transactions, including transactions contrary to any recommendation herein, or have positions in the securities mentioned herein or options with respect thereto. Any recommendation contained in this report may not be suitable for all investors and it is not to be deemed an offer or solicitation on our part with respect to the purchase or sale of any securities. |
|
 |
Commodity-Liniked Groups Posted Standout Gains
Kenneth J. Gruneisen - Passed the CAN SLIM® Master's Exam
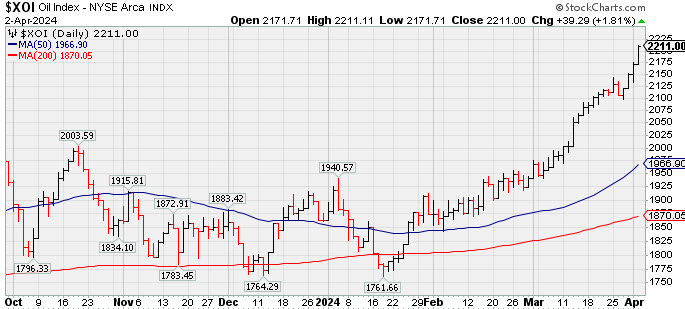
The Broker/Dealer Index ($XBD -0.53%), Bank Index ($BKX -0.94%), and the Retail Index ($RLX -0.49%) suffered small losses. The tech sector had a negative bias as the Semiconductor Index ($SOX -1.51%), Networking Index ($NWX -2.72%), and the Biotech Index ($BTK -1.45%) suffered unanimous losses. Commodity-linked groups again had a positive bias as the Gold & Silver Index ($XAU +1.38%), Integrated Oil Index ($XOI +1.81%), and the Oil Services Index ($OSX +2.14%) posted unanimous gains.
![]() PICTURED: The Integrated Oil Index ($XOI +1.81%) has posted gains in 18 of the past 20 sessions while surging to new record highs.
| Oil Services |
$OSX |
93.77 |
+1.97 |
+2.14% |
+11.79% |
| Integrated Oil |
$XOI |
2,211.00 |
+39.29 |
+1.81% |
+18.71% |
| Semiconductor |
$SOX |
4,886.94 |
-75.16 |
-1.51% |
+17.04% |
| Networking |
$NWX |
786.15 |
-22.00 |
-2.72% |
-5.60% |
| Broker/Dealer |
$XBD |
603.71 |
-3.23 |
-0.53% |
+8.33% |
| Retail |
$RLX |
4,460.54 |
-22.14 |
-0.49% |
+14.70% |
| Gold & Silver |
$XAU |
130.58 |
+1.77 |
+1.38% |
+3.89% |
| Bank |
$BKX |
102.67 |
-0.97 |
-0.94% |
+6.92% |
| Biotech |
$BTK |
5,217.11 |
-78.80 |
-1.49% |
-3.72% |
|
|
|
 |
Featured Stocks
Kenneth J. Gruneisen - Passed the CAN SLIM® Master's Exam
Symbol/Exchange
Company Name
Industry Group | PRICE | CHANGE
(%Change) | Day High | Volume
(% DAV)
(% 50 day avg vol) | 52 Wk Hi
% From Hi | Featured
Date | Price
Featured | Pivot Featured | | Max Buy |  ANET - NYSE ANET - NYSE
Arista Networks
Computer-Networking | $290.85 | -8.90
-2.97% | $293.74 | 2,123,879
78.26% of 50 DAV
50 DAV is 2,714,000 | $307.74
-5.49%
| 3/18/2024 | $188.84 | PP = $292.76 | | MB = $307.40 |  Most Recent Note - 4/2/2024 11:47:23 AM Most Recent Note - 4/2/2024 11:47:23 AM
Y - Gapped down today, pulling back after rebounding near its all-time high with gains lacking great volume conviction. Found support near prior highs in the $292 area and additional near-term support to watch is its 50 DMA line ($277) and an upward trendline connecting its October-March lows.
>>> FEATURED STOCK ARTICLE : Consolidating Abover Recent Highs and Above 50-Day Average - 3/26/2024 | View all notes | Set NEW NOTE alert | Company Profile | SEC News | Chart | Request a new note C A S I | NVO - NYSE
Novo Nordisk ADR
Medical-Ethical Drugs | $126.46 | -1.09
-0.85% | $126.68 | 4,295,957
78.57% of 50 DAV
50 DAV is 5,468,000 | $138.28
-8.55%
| 3/1/2024 | $124.23 | PP = $124.97 | | MB = $131.22 | Most Recent Note - 4/2/2024 11:54:56 AM
Y - Pulling back with recent losses backed by below-average volume. Color code is changed to yellow while testing near the pivot point of the previously noted "3-weeks tight" base. Its 50 DMA line ($122.63) defines near-term support above prior lows in the $118 area.
>>> FEATURED STOCK ARTICLE : Perched at All-Time High After Rallying from Advanced "3-Weeks Tight" - 3/12/2024 | View all notes | Set NEW NOTE alert | Company Profile | SEC News | Chart | Request a new note C A S I | AXON - NASDAQ
Axon Enterprise
Security/Sfty | $309.43 | -1.94
-0.62% | $310.12 | 324,664
65.46% of 50 DAV
50 DAV is 496,000 | $325.63
-4.97%
| 11/8/2023 | $220.13 | PP = $223.30 | | MB = $234.47 | Most Recent Note - 4/1/2024 9:16:28 PM
G - Pulled back for a 3rd consecutive small loss, still hovering in a tight range near its all-time high. Its 50-day moving average (DMA) line ($285.44) defines near-term support to watch. Fundamentals remain strong.
>>> FEATURED STOCK ARTICLE : Hovering Near All-Time High; Spiked Higher Following Earnings - 3/14/2024 | View all notes | Set NEW NOTE alert | Company Profile | SEC News | Chart | Request a new note C A S I | TDG - NYSE
TransDigm Group
Aerospace/Defense | $1,203.82 | -10.12
-0.83% | $1,209.30 | 228,850
106.44% of 50 DAV
50 DAV is 215,000 | $1,238.95
-2.84%
| 12/12/2023 | $1,000.39 | PP = $1,013.18 | | MB = $1,063.84 | Most Recent Note - 4/1/2024 9:21:15 PM
G - Volume totals have still been cooling while stubbornly holding its ground after wedging to a new all-time high. Its 50 DMA line ($1,156) defines near-term support to watch.
>>> FEATURED STOCK ARTICLE : Perched in Tight Range Encountering Distribtion Near All-Time High - 3/15/2024 | View all notes | Set NEW NOTE alert | Company Profile | SEC News | Chart | Request a new note C A S I | CRWD - NASDAQ
CrowdStrike Holdings
Computer Sftwr-Security | $319.55 | -0.04
-0.01% | $319.71 | 2,085,028
51.29% of 50 DAV
50 DAV is 4,065,000 | $365.00
-12.45%
| 1/2/2024 | $246.42 | PP = $261.91 | | MB = $275.01 | Most Recent Note - 4/1/2024 9:17:54 PM
G - Testing its 50 DMA ($315.63) which recently acted as support. It has not formed a sound base of sufficient length. Fundamentals remain strong after it reported Jan ''24 quarterly earnings +102% on +33% sales revenues versus the year-ago period. See the latest FSU analysis for more details and a new annotated graph.
>>> FEATURED STOCK ARTICLE : 50-Day Moving Average Line Support Being Tested - 4/1/2024 | View all notes | Set NEW NOTE alert | Company Profile | SEC News | Chart | Request a new note C A S I | Symbol/Exchange
Company Name
Industry Group | PRICE | CHANGE
(%Change) | Day High | Volume
(% DAV)
(% 50 day avg vol) | 52 Wk Hi
% From Hi | Featured
Date | Price
Featured | Pivot Featured | | Max Buy | ELF - NYSE
e.l.f. Beauty
Cosmetics/Personal Care | $185.93 | -6.04
-3.15% | $186.46 | 1,704,976
110.86% of 50 DAV
50 DAV is 1,538,000 | $221.83
-16.18%
| 1/2/2024 | $138.23 | PP = $153.63 | | MB = $161.31 | Most Recent Note - 4/2/2024 11:45:43 AM
G - Today''s 7th consecutive loss is violating its 50 DMA line ($185) triggering a technical sell signal. Only a prompt rebound above the 50 DMA line would help its outlook improve.
>>> FEATURED STOCK ARTICLE : ELF Consolidating Above 50-Day Moving Average Line - 3/28/2024 | View all notes | Set NEW NOTE alert | Company Profile | SEC News | Chart | Request a new note C A S I | PCAR - NASDAQ
Paccar
Trucks and Parts-Hvy Duty | $121.60 | -1.50
-1.22% | $122.74 | 2,339,501
101.67% of 50 DAV
50 DAV is 2,301,000 | $125.50
-3.11%
| 1/23/2024 | $100.35 | PP = $98.57 | | MB = $103.50 | Most Recent Note - 4/2/2024 11:50:19 AM
G - Stubbornly holding its ground near its all-time high, extended from any sound base. Its 50 DMA line ($111) defines near-term support to watch. Fundamentals remain strong.
>>> FEATURED STOCK ARTICLE : Hit New High With 5th Consecutive Gain - 3/21/2024 | View all notes | Set NEW NOTE alert | Company Profile | SEC News | Chart | Request a new note C A S I | HUBB - NYSE
Hubbell
Electrical-Power/Equipmt | $415.54 | -1.26
-0.30% | $416.24 | 348,775
79.09% of 50 DAV
50 DAV is 441,000 | $419.65
-0.98%
| 1/30/2024 | $343.26 | PP = $336.83 | | MB = $353.67 | Most Recent Note - 4/2/2024 11:49:08 AM
G - Stubbornly holding its ground near its all-time high with volume totals cooling. It is very extended from the previously noted base. Its 50 DMA line ($374) defines important support to watch on pullbacks.
>>> FEATURED STOCK ARTICLE : Hubbell Perched at All-Time High After 5 Weekly Gains - 3/22/2024 | View all notes | Set NEW NOTE alert | Company Profile | SEC News | Chart | Request a new note C A S I | MANH - NASDAQ
Manhattan Associates
Computer Sftwr-Enterprse | $242.76 | -4.91
-1.98% | $245.71 | 430,563
114.82% of 50 DAV
50 DAV is 375,000 | $266.94
-9.06%
| 1/31/2024 | $240.57 | PP = $230.71 | | MB = $242.25 | Most Recent Note - 4/1/2024 9:18:56 PM
G - Down today and volume totals have been cooling while consolidating above its 50 DMA line ($245.59) which defines near-term support.
>>> FEATURED STOCK ARTICLE : Manhattan Associates Consolidating Above 50-Day Moving Average - 3/25/2024 | View all notes | Set NEW NOTE alert | Company Profile | SEC News | Chart | Request a new note C A S I | USLM - NASDAQ
U.S. Lime & Minerals
Bldg-Cement/Concrt/Ag | $293.37 | -3.88
-1.30% | $296.11 | 29,736
123.90% of 50 DAV
50 DAV is 24,000 | $307.48
-4.59%
| 2/9/2024 | $254.68 | PP = $265.09 | | MB = $278.34 | Most Recent Note - 4/2/2024 12:22:09 PM
G - Still hovering near its all-time high, extended from the previously noted base. Its 50 DMA line ($268.55) defines near-term support to watch above prior highs in the $265-266 area.
>>> FEATURED STOCK ARTICLE : Hit New All Time High With Light Volume Behind 5th Straight Gain - 3/13/2024 | View all notes | Set NEW NOTE alert | Company Profile | SEC News | Chart | Request a new note C A S I | Symbol/Exchange
Company Name
Industry Group | PRICE | CHANGE
(%Change) | Day High | Volume
(% DAV)
(% 50 day avg vol) | 52 Wk Hi
% From Hi | Featured
Date | Price
Featured | Pivot Featured | | Max Buy | NOW - NYSE
ServiceNow
Computer Sftwr-Enterprse | $757.00 | -11.37
-1.48% | $759.66 | 756,790
58.89% of 50 DAV
50 DAV is 1,285,000 | $815.32
-7.15%
| 2/22/2024 | $771.75 | PP = $815.32 | | MB = $856.09 | Most Recent Note - 4/1/2024 9:20:33 PM
Y - Posted another small gain today with lighter volume, quietly consolidating near its 50 DMA line ($770). Prior lows in the $730 area define the next important near-term support to watch.
>>> FEATURED STOCK ARTICLE : NOW Quietly Rebounded Above 50-Day Moving Average Line - 3/20/2024 | View all notes | Set NEW NOTE alert | Company Profile | SEC News | Chart | Request a new note C A S I | SNPS - NASDAQ
Synopsys
Computer Sftwr-Design | $569.82 | -7.07
-1.23% | $571.91 | 729,501
60.44% of 50 DAV
50 DAV is 1,207,000 | $629.38
-9.46%
| 2/22/2024 | $600.65 | PP = $582.85 | | MB = $611.99 | Most Recent Note - 4/2/2024 11:51:34 AM
Y - Consolidating just above near-term support to watch at its 50 DMA line ($564.48). More damaging losses would raise concerns and trigger a technical sell signal. Previously noted - " A strong volume-driven gain and close above the pivot point is needed to clinch a proper technical buy signal."
>>> FEATURED STOCK ARTICLE : Rallying From Support at 50-Day Moving Average Line - 3/19/2024 | View all notes | Set NEW NOTE alert | Company Profile | SEC News | Chart | Request a new note C A S I | PAY - NYSE
Paymentus Holdings
Finance-CrdtCard/PmtPr | $21.87 | -0.22
-1.00% | $22.00 | 396,512
115.60% of 50 DAV
50 DAV is 343,000 | $25.21
-13.25%
| 3/5/2024 | $19.97 | PP = $18.89 | | MB = $19.83 | Most Recent Note - 4/1/2024 9:43:30 PM
G - Volume totals have been cooling while consolidating after quickly getting extended from the previously noted base. Its 50 DMA line ($18.32) coincides with prior highs in the $18 range defining important support to watch on pullbacks.
>>> FEATURED STOCK ARTICLE : Consolidating After Powerful Breakout and Volume-Driven Gains - 3/27/2024 | View all notes | Set NEW NOTE alert | Company Profile | SEC News | Chart | Request a new note C A S I |
|
|
|
Color Codes Explained :
Y - Better candidates highlighted by our
staff of experts.
G - Previously featured
in past reports as yellow but may no longer be buyable under the
guidelines.
***Last / Change / Volume data in this table is the closing quote data***
|
|
|
THESE ARE NOT BUY RECOMMENDATIONS!
Comments contained in the body of this report are technical
opinions only. The material herein has been obtained
from sources believed to be reliable and accurate, however,
its accuracy and completeness cannot be guaranteed.
This site is not an investment advisor, hence it does
not endorse or recommend any securities or other investments.
Any recommendation contained in this report may not
be suitable for all investors and it is not to be deemed
an offer or solicitation on our part with respect to
the purchase or sale of any securities. All trademarks,
service marks and trade names appearing in this report
are the property of their respective owners, and are
likewise used for identification purposes only.
This report is a service available
only to active Paid Premium Members.
You may opt-out of receiving report notifications
at any time. Questions or comments may be submitted
by writing to Premium Membership Services 665 S.E. 10 Street, Suite 201 Deerfield Beach, FL 33441-5634 or by calling 1-800-965-8307
or 954-785-1121.
|
|
|