You are not logged in.
This means you
CAN ONLY VIEW reports that were published prior to Tuesday, July 9, 2024.
You
MUST UPGRADE YOUR MEMBERSHIP if you want to see any current reports.
AFTER MARKET UPDATE - MONDAY, APRIL 1ST, 2024
Previous After Market Report Next After Market Report >>>
|
|
|
|
DOW |
-240.52 |
39,566.85 |
-0.60% |
|
Volume |
815,215,742 |
-31% |
|
Volume |
4,825,415,400 |
-7% |
|
NASDAQ |
+17.37 |
16,396.83 |
+0.11% |
|
Advancers |
977 |
35% |
|
Advancers |
1,651 |
38% |
|
S&P 500 |
-10.58 |
5,243.77 |
-0.20% |
|
Decliners |
1,808 |
65% |
|
Decliners |
2,683 |
62% |
|
Russell 2000 |
-21.71 |
2,102.84 |
-1.02% |
|
52 Wk Highs |
183 |
|
|
52 Wk Highs |
168 |
|
|
S&P 600 |
-13.86 |
1,330.80 |
-1.03% |
|
52 Wk Lows |
23 |
|
|
52 Wk Lows |
84 |
|
|
 |
Major Indices Ended Weak After Erasing Early Gains
Kenneth J. Gruneisen - Passed the CAN SLIM® Master's Exam
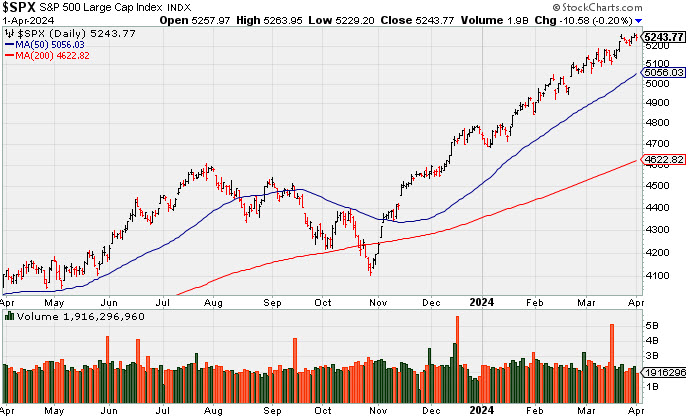
The first trading day of the new quarter saw a -1.0% drop for the Russell 2000 while the S&P 500 and Dow Jones Industrial Average fell 0.2% and 0.6%, respectively. The Nasdaq Composite eked out a 0.1% gain. Volume reported was lighter that the prior session total on the NYSE and on the Nasdaq exchange. Breadth was negative as decliners led advancers by a 2-1 margin on the NYSE and by a 5-3 margin on the Nasdaq exchange. There were 67 high-ranked companies from the Leaders List that hit new 52-week highs and were listed on the BreakOuts Page, versus the total of 110 on the prior session. New 52-week highs totals contracted and but still solidly outnumbered new 52-week lows on the NYSE and on the Nasdaq exchange. The major indices are in a confirmed uptrend (M criteria). New buying efforts should be only made in stocks fitting all key criteria of the fact-based investment system.
PICTURED: The S&P 500 Index is perched near its all-time high.
The 10-yr note yield jumped 12 basis points to 4.33% and the 2-yr note yield rose 10 basis points to 4.72%. Treasuries were reacting to some economic data that didn't exactly corroborate the market's thinking in terms of rate cuts by the FOMC. The latest ISM Manufacturing data was stronger than expected. This data followed the February Personal Spending and Income report, released Friday, containing sticky inflation figures.
Eight of the 11 S&P 500 sectors settled with losses, but only one sector fell more than 1.0%. Meta Platforms (META +1.19%) and Alphabet (GOOG +2.78%) helped propel the communication services sector to a +1.5% gain. The rate-sensitive real estate sector lagged, dropping 1.8% in response to the activity in Treasuries. The energy sector gained +0.8%. Chevron (CVX +0.85%) and Exxon Mobil (XOM +0.65%) rose along with commodity prices. WTI crude oil futures settled +0.8% higher at $83.94/bbl and natural gas futures jumped +5.1% to $1.85/mmbtu.
|
 Kenneth J. Gruneisen started out as a licensed stockbroker in August 1987, a couple of months prior to the historic stock market crash that took the Dow Jones Industrial Average down -22.6% in a single day. He has published daily fact-based fundamental and technical analysis on high-ranked stocks online for two decades. Through FACTBASEDINVESTING.COM, Kenneth provides educational articles, news, market commentary, and other information regarding proven investment systems that work in good times and bad.
Comments contained in the body of this report are technical opinions only and are not necessarily those of Gruneisen Growth Corp. The material herein has been obtained from sources believed to be reliable and accurate, however, its accuracy and completeness cannot be guaranteed. Our firm, employees, and customers may effect transactions, including transactions contrary to any recommendation herein, or have positions in the securities mentioned herein or options with respect thereto. Any recommendation contained in this report may not be suitable for all investors and it is not to be deemed an offer or solicitation on our part with respect to the purchase or sale of any securities. |
|
 |
Tech and Commodity-Linked Indexes Rose
Kenneth J. Gruneisen - Passed the CAN SLIM® Master's Exam
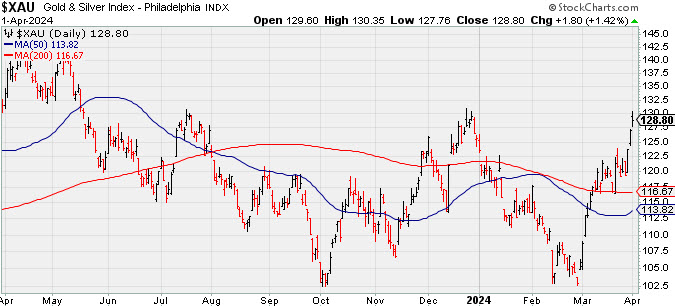
The Broker/Dealer Index ($XBD -1.05%) and the Bank Index ($BKX -1.15%) both lost ground while the Retail Index ($RLX -0.62%) suffered a smaller loss. The tech sector had a positive bias as the Semiconductor Index ($SOX +1.16%) outpaced the Networking Index ($NWX +0.35%) and the Biotech Index ($BTK +0.22%). Commodity-linked groups had a positive bias as the Gold & Silver Index ($XAU +1.42%), Integrated Oil Index ($XOI +1.03%), and the Oil Services Index ($OSX +0.73%) posted unanimous gains.
![]() PICTURED: The Gold & Silver Index ($XAU +1.42%) is challenging its December 2023 high.
| Oil Services |
$OSX |
91.80 |
+0.67 |
+0.73% |
+9.45% |
| Integrated Oil |
$XOI |
2,171.71 |
+22.14 |
+1.03% |
+16.60% |
| Semiconductor |
$SOX |
4,962.10 |
+56.89 |
+1.16% |
+18.84% |
| Networking |
$NWX |
808.15 |
+2.79 |
+0.35% |
-2.96% |
| Broker/Dealer |
$XBD |
606.95 |
-6.44 |
-1.05% |
+8.91% |
| Retail |
$RLX |
4,482.70 |
-28.15 |
-0.62% |
+15.27% |
| Gold & Silver |
$XAU |
128.80 |
+1.80 |
+1.42% |
+2.48% |
| Bank |
$BKX |
103.64 |
-1.21 |
-1.15% |
+7.94% |
| Biotech |
$BTK |
5,295.91 |
+11.49 |
+0.22% |
-2.27% |
|
|
|
 |
50-Day Moving Average Line Support Being Tested
Kenneth J. Gruneisen - Passed the CAN SLIM® Master's Exam
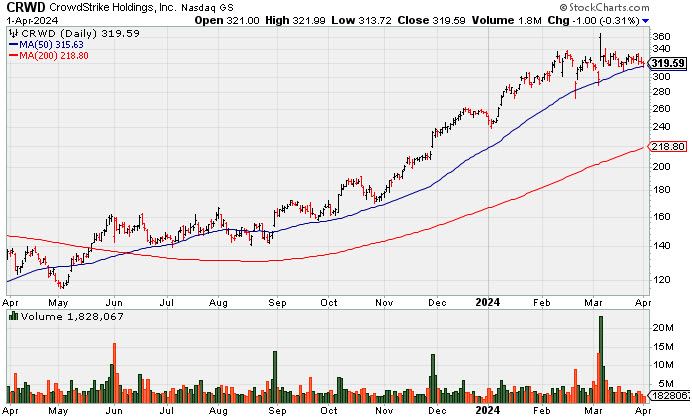
CrowdStrike Holdings (CRWD -$1.03 or -0.32% to $319.56) has seen its volume totals cooling while consolidating above its 50-day moving average (DMA) line ($315.63) which recently acted as support. It has not formed a sound base of sufficient length.
Fundamentals remain strong after it reported Jan '24 quarterly earnings +102% on +33% sales revenues versus the year-ago period, extending its streak of strong earnings increases well above the +25% minimum guideline (C criteria) in quarterly comparisons. CRWD was last shown in detail in this FSU section on 3/11/24 with an annotated graph under the headline "Encountered Distributional Pressure After Spiking to New High". It has a highest possible 99 Earnings Per Share rating. Its annual earnings (A criteria) history has been strong.
CRWD completed its $34 IPO on 6/12/19. The number of top-rated funds owning its shares rose from 1,880 in Jun 23 to 2,265 in Dec '23, a reassuring sign concerning the I criteria. Its current Up/Down Volume Ratio of 1.2 is an unbiased indication its shares have been under accumulation over the past 50 days. |
|
|
Color Codes Explained :
Y - Better candidates highlighted by our
staff of experts.
G - Previously featured
in past reports as yellow but may no longer be buyable under the
guidelines.
***Last / Change / Volume data in this table is the closing quote data***
Symbol/Exchange
Company Name
Industry Group |
PRICE |
CHANGE
(%Change) |
Day High |
Volume
(% DAV)
(% 50 day avg vol) |
52 Wk Hi
% From Hi |
Featured
Date |
Price
Featured |
Pivot Featured |
|
Max Buy |
 ANET
-
NYSE
ANET
-
NYSE
Arista Networks
Computer-Networking
|
$299.75
|
+9.77
3.37% |
$299.79
|
1,514,189
55.69% of 50 DAV
50 DAV is 2,719,000
|
$307.74
-2.60%
|
3/18/2024
|
$188.84
|
PP = $292.76
|
|
MB = $307.40
|
 Most Recent Note - 4/1/2024 9:36:33 PM
Y - Posted a gain today with light volume, rebounding toward its all-time high. Found support near prior highs in the $292 area and additional near-term support to watch is its 50 DMA line ($276.62) and an upward trendline connecting its October-March lows. See the latest FSU analysis for more details and an annotated graph.
>>> FEATURED STOCK ARTICLE : Consolidating Abover Recent Highs and Above 50-Day Average - 3/26/2024 |
View all notes |
Set NEW NOTE alert |
Company Profile |
SEC
News |
Chart |
Request a new note
C
A
S
I |
NVO
-
NYSE
Novo Nordisk ADR
Medical-Ethical Drugs
|
$127.56
|
-0.84
-0.65% |
$129.11
|
2,858,950
52.23% of 50 DAV
50 DAV is 5,474,000
|
$138.28
-7.75%
|
3/1/2024
|
$124.23
|
PP = $124.97
|
|
MB = $131.22
|
Most Recent Note - 3/28/2024 4:47:51 PM
G - Posted a small gain with light volume today. Volume totals have been cooling while consolidating after rallying from a noted new advanced "3-weeks tight" base with big volume-driven gains. Its 50 DMA line ($121.86) defines near-term support above prior lows in the $118 area.
>>> FEATURED STOCK ARTICLE : Perched at All-Time High After Rallying from Advanced "3-Weeks Tight" - 3/12/2024 |
View all notes |
Set NEW NOTE alert |
Company Profile |
SEC
News |
Chart |
Request a new note
C
A
S
I |
AXON
-
NASDAQ
Axon Enterprise
Security/Sfty
|
$311.26
|
-1.62
-0.52% |
$314.77
|
298,857
60.50% of 50 DAV
50 DAV is 494,000
|
$325.63
-4.41%
|
11/8/2023
|
$220.13
|
PP = $223.30
|
|
MB = $234.47
|
Most Recent Note - 4/1/2024 9:16:28 PM
G - Pulled back for a 3rd consecutive small loss, still hovering in a tight range near its all-time high. Its 50-day moving average (DMA) line ($285.44) defines near-term support to watch. Fundamentals remain strong.
>>> FEATURED STOCK ARTICLE : Hovering Near All-Time High; Spiked Higher Following Earnings - 3/14/2024 |
View all notes |
Set NEW NOTE alert |
Company Profile |
SEC
News |
Chart |
Request a new note
C
A
S
I |
TDG
-
NYSE
TransDigm Group
Aerospace/Defense
|
$1,213.94
|
-17.66
-1.43% |
$1,229.77
|
141,593
65.55% of 50 DAV
50 DAV is 216,000
|
$1,238.95
-2.02%
|
12/12/2023
|
$1,000.39
|
PP = $1,013.18
|
|
MB = $1,063.84
|
Most Recent Note - 4/1/2024 9:21:15 PM
G - Volume totals have still been cooling while stubbornly holding its ground after wedging to a new all-time high. Its 50 DMA line ($1,156) defines near-term support to watch.
>>> FEATURED STOCK ARTICLE : Perched in Tight Range Encountering Distribtion Near All-Time High - 3/15/2024 |
View all notes |
Set NEW NOTE alert |
Company Profile |
SEC
News |
Chart |
Request a new note
C
A
S
I |
CRWD
-
NASDAQ
CrowdStrike Holdings
Computer Sftwr-Security
|
$319.56
|
-1.03
-0.32% |
$321.99
|
1,730,393
42.38% of 50 DAV
50 DAV is 4,083,000
|
$365.00
-12.45%
|
1/2/2024
|
$246.42
|
PP = $261.91
|
|
MB = $275.01
|
Most Recent Note - 4/1/2024 9:17:54 PM
G - Testing its 50 DMA ($315.63) which recently acted as support. It has not formed a sound base of sufficient length. Fundamentals remain strong after it reported Jan '24 quarterly earnings +102% on +33% sales revenues versus the year-ago period. See the latest FSU analysis for more details and a new annotated graph.
>>> FEATURED STOCK ARTICLE : 50-Day Moving Average Line Support Being Tested - 4/1/2024 |
View all notes |
Set NEW NOTE alert |
Company Profile |
SEC
News |
Chart |
Request a new note
C
A
S
I |
Symbol/Exchange
Company Name
Industry Group |
PRICE |
CHANGE
(%Change) |
Day High |
Volume
(% DAV)
(% 50 day avg vol) |
52 Wk Hi
% From Hi |
Featured
Date |
Price
Featured |
Pivot Featured |
|
Max Buy |
ELF
-
NYSE
e.l.f. Beauty
Cosmetics/Personal Care
|
$191.97
|
-4.06
-2.07% |
$196.36
|
1,698,866
109.25% of 50 DAV
50 DAV is 1,555,000
|
$221.83
-13.46%
|
1/2/2024
|
$138.23
|
PP = $153.63
|
|
MB = $161.31
|
Most Recent Note - 3/28/2024 4:46:43 PM
G - Pulled back today for a 5th consecutive small loss with light volume, consolidating well above its 50 DMA line ($183.67) which defines important near-term support to watch. Fundamentals remain strong. See the latest FSU analysis for more details and a new annotated graph.
>>> FEATURED STOCK ARTICLE : ELF Consolidating Above 50-Day Moving Average Line - 3/28/2024 |
View all notes |
Set NEW NOTE alert |
Company Profile |
SEC
News |
Chart |
Request a new note
C
A
S
I |
PCAR
-
NASDAQ
Paccar
Trucks and Parts-Hvy Duty
|
$123.10
|
-0.79
-0.64% |
$124.39
|
1,347,258
58.02% of 50 DAV
50 DAV is 2,322,000
|
$125.50
-1.91%
|
1/23/2024
|
$100.35
|
PP = $98.57
|
|
MB = $103.50
|
Most Recent Note - 3/26/2024 5:24:17 PM
G - Pulled back from its all-time high with today's 3rd consecutive loss with below-average volume. Its 50 DMA line ($109) defines near-term support to watch. Fundamentals remain strong.
>>> FEATURED STOCK ARTICLE : Hit New High With 5th Consecutive Gain - 3/21/2024 |
View all notes |
Set NEW NOTE alert |
Company Profile |
SEC
News |
Chart |
Request a new note
C
A
S
I |
HUBB
-
NYSE
Hubbell
Electrical-Power/Equipmt
|
$416.80
|
+1.75
0.42% |
$418.40
|
263,613
60.05% of 50 DAV
50 DAV is 439,000
|
$419.65
-0.68%
|
1/30/2024
|
$343.26
|
PP = $336.83
|
|
MB = $353.67
|
Most Recent Note - 3/26/2024 5:38:18 PM
G - Perched at its all-time high, very extended from the previously noted base. Its 50 DMA line ($366.73) defines important support to watch on pullbacks.
>>> FEATURED STOCK ARTICLE : Hubbell Perched at All-Time High After 5 Weekly Gains - 3/22/2024 |
View all notes |
Set NEW NOTE alert |
Company Profile |
SEC
News |
Chart |
Request a new note
C
A
S
I |
MANH
-
NASDAQ
Manhattan Associates
Computer Sftwr-Enterprse
|
$247.67
|
-2.56
-1.02% |
$251.31
|
254,850
67.78% of 50 DAV
50 DAV is 376,000
|
$266.94
-7.22%
|
1/31/2024
|
$240.57
|
PP = $230.71
|
|
MB = $242.25
|
Most Recent Note - 4/1/2024 9:18:56 PM
G - Down today and volume totals have been cooling while consolidating above its 50 DMA line ($245.59) which defines near-term support.
>>> FEATURED STOCK ARTICLE : Manhattan Associates Consolidating Above 50-Day Moving Average - 3/25/2024 |
View all notes |
Set NEW NOTE alert |
Company Profile |
SEC
News |
Chart |
Request a new note
C
A
S
I |
USLM
-
NASDAQ
U.S. Lime & Minerals
Bldg-Cement/Concrt/Ag
|
$294.99
|
-3.15
-1.06% |
$299.96
|
33,168
144.21% of 50 DAV
50 DAV is 23,000
|
$307.48
-4.06%
|
2/9/2024
|
$254.68
|
PP = $265.09
|
|
MB = $278.34
|
Most Recent Note - 4/1/2024 9:23:07 PM
G - Churned higher volume today while still hovering near its all-time high, very extended from the previously noted base. Its 50 DMA line ($267.24) and prior highs in the $265-266 area define important near-term support to watch on pullbacks.
>>> FEATURED STOCK ARTICLE : Hit New All Time High With Light Volume Behind 5th Straight Gain - 3/13/2024 |
View all notes |
Set NEW NOTE alert |
Company Profile |
SEC
News |
Chart |
Request a new note
C
A
S
I |
Symbol/Exchange
Company Name
Industry Group |
PRICE |
CHANGE
(%Change) |
Day High |
Volume
(% DAV)
(% 50 day avg vol) |
52 Wk Hi
% From Hi |
Featured
Date |
Price
Featured |
Pivot Featured |
|
Max Buy |
NOW
-
NYSE
ServiceNow
Computer Sftwr-Enterprse
|
$767.80
|
+5.40
0.71% |
$773.09
|
635,749
49.05% of 50 DAV
50 DAV is 1,296,000
|
$815.32
-5.83%
|
2/22/2024
|
$771.75
|
PP = $815.32
|
|
MB = $856.09
|
Most Recent Note - 4/1/2024 9:20:33 PM
Y - Posted another small gain today with lighter volume, quietly consolidating near its 50 DMA line ($770). Prior lows in the $730 area define the next important near-term support to watch.
>>> FEATURED STOCK ARTICLE : NOW Quietly Rebounded Above 50-Day Moving Average Line - 3/20/2024 |
View all notes |
Set NEW NOTE alert |
Company Profile |
SEC
News |
Chart |
Request a new note
C
A
S
I |
SNPS
-
NASDAQ
Synopsys
Computer Sftwr-Design
|
$576.75
|
+5.25
0.92% |
$582.67
|
605,611
48.45% of 50 DAV
50 DAV is 1,250,000
|
$629.38
-8.36%
|
2/22/2024
|
$600.65
|
PP = $582.85
|
|
MB = $611.99
|
Most Recent Note - 3/26/2024 5:25:46 PM
Y - Perched within striking distance of its all-time high. Near-term support to watch is its 50 DMA line ($559). Previously noted - " A strong volume-driven gain and close above the pivot point is needed to clinch a proper technical buy signal."
>>> FEATURED STOCK ARTICLE : Rallying From Support at 50-Day Moving Average Line - 3/19/2024 |
View all notes |
Set NEW NOTE alert |
Company Profile |
SEC
News |
Chart |
Request a new note
C
A
S
I |
PAY
-
NYSE
Paymentus Holdings
Finance-CrdtCard/PmtPr
|
$22.09
|
-0.66
-2.90% |
$23.17
|
249,157
73.50% of 50 DAV
50 DAV is 339,000
|
$25.21
-12.38%
|
3/5/2024
|
$19.97
|
PP = $18.89
|
|
MB = $19.83
|
Most Recent Note - 4/1/2024 9:43:30 PM
G - Volume totals have been cooling while consolidating after quickly getting extended from the previously noted base. Its 50 DMA line ($18.32) coincides with prior highs in the $18 range defining important support to watch on pullbacks.
>>> FEATURED STOCK ARTICLE : Consolidating After Powerful Breakout and Volume-Driven Gains - 3/27/2024 |
View all notes |
Set NEW NOTE alert |
Company Profile |
SEC
News |
Chart |
Request a new note
C
A
S
I |
|
|
|
THESE ARE NOT BUY RECOMMENDATIONS!
Comments contained in the body of this report are technical
opinions only. The material herein has been obtained
from sources believed to be reliable and accurate, however,
its accuracy and completeness cannot be guaranteed.
This site is not an investment advisor, hence it does
not endorse or recommend any securities or other investments.
Any recommendation contained in this report may not
be suitable for all investors and it is not to be deemed
an offer or solicitation on our part with respect to
the purchase or sale of any securities. All trademarks,
service marks and trade names appearing in this report
are the property of their respective owners, and are
likewise used for identification purposes only.
This report is a service available
only to active Paid Premium Members.
You may opt-out of receiving report notifications
at any time. Questions or comments may be submitted
by writing to Premium Membership Services 665 S.E. 10 Street, Suite 201 Deerfield Beach, FL 33441-5634 or by calling 1-800-965-8307
or 954-785-1121.
|
|
|