***Last / Change / Volume data in this table is the closing quote data***
Symbol/Exchange
Company Name
Industry Group |
PRICE |
CHANGE
(%Change) |
Day High |
Volume
(% DAV)
(% 50 day avg vol) |
52 Wk Hi
% From Hi |
Featured
Date |
Price
Featured |
Pivot Featured |
|
Max Buy |
MLR
-
NYSE
Miller Industries Inc
AUTOMOTIVE - Auto Parts
|
$35.07
|
+0.79
2.30% |
$35.24
|
84,216
255.20% of 50 DAV
50 DAV is 33,000
|
$34.81
0.75%
|
11/30/2018
|
$28.35
|
PP = $29.50
|
|
MB = $30.98
|
 Most Recent Note - 3/4/2019 8:37:24 PM
G - Hit another new high with today's volume-driven gain adding to an impressive streak of gains. Prior highs and its 50 DMA line ($29.71) define near-term support to watch on pullbacks. See the latest FSU analysis for more details and an annotated graph.
>>> FEATURED STOCK ARTICLE : Extended From Prior Base After Impressive Streak of Gains - 3/1/2019 |
View all notes |
Set NEW NOTE alert |
Company Profile |
SEC
News |
Chart |
Request a new note
C
A
S
I |
NSP
-
NYSE
Insperity Inc
Comml Svcs-Outsourcing
|
$125.16
|
-2.63
-2.06% |
$128.52
|
312,115
85.04% of 50 DAV
50 DAV is 367,000
|
$132.50
-5.54%
|
2/11/2019
|
$127.91
|
PP = $121.25
|
|
MB = $127.31
|
Most Recent Note - 3/4/2019 8:27:52 PM
Y - Quietly consolidating below its "max buy" level. Prior highs in the $119-121 area define initial support to watch on pullbacks.
>>> FEATURED STOCK ARTICLE : Big Breakaway Gap Triggered Technical Buy Signal - 2/11/2019 |
View all notes |
Set NEW NOTE alert |
Company Profile |
SEC
News |
Chart |
Request a new note
C
A
S
I |
ZBRA
-
NASDAQ
Zebra Tech Corp Cl A
COMPUTER HARDWARE - Computer Peripherals
|
$201.73
|
-0.48
-0.24% |
$203.05
|
477,845
91.54% of 50 DAV
50 DAV is 522,000
|
$207.88
-2.96%
|
2/14/2019
|
$198.10
|
PP = $184.85
|
|
MB = $194.09
|
Most Recent Note - 2/28/2019 11:53:42 AM
G - Stubbornly holding its ground with volume totals cooling, extended from the prior base. Prior highs in the $184 area define initial support to watch on pullbacks.
>>> FEATURED STOCK ARTICLE : Big Volume-Driven Gain for New High - 2/14/2019 |
View all notes |
Set NEW NOTE alert |
Company Profile |
SEC
News |
Chart |
Request a new note
C
A
S
I |
SPSC
-
NASDAQ
S P S Commerce Inc
COMPUTER SOFTWARE and SERVICES - Application Software
|
$106.19
|
-1.83
-1.69% |
$108.31
|
139,817
83.22% of 50 DAV
50 DAV is 168,000
|
$113.31
-6.28%
|
2/13/2019
|
$104.30
|
PP = $100.78
|
|
MB = $105.82
|
Most Recent Note - 3/1/2019 6:09:45 PM
G - It is extended from the previously noted base, consolidating well above prior highs in the $100 area which define initial support to watch.
>>> FEATURED STOCK ARTICLE : Gap Up and Big Volume Driven Gain for New High - 2/13/2019 |
View all notes |
Set NEW NOTE alert |
Company Profile |
SEC
News |
Chart |
Request a new note
C
A
S
I |
SSNC
-
NASDAQ
S S & C Technologies
COMPUTER SOFTWARE and SERVICES - Application Software
|
$61.96
|
-0.49
-0.78% |
$64.36
|
1,801,671
91.50% of 50 DAV
50 DAV is 1,969,000
|
$62.94
-1.56%
|
2/15/2019
|
$59.73
|
PP = $61.07
|
|
MB = $64.12
|
Most Recent Note - 3/1/2019 6:03:11 PM
Y - Hit another new high with today's gain above its pivot point backed by +49% above average volume triggering a technical buy signal. Stubbornly held its ground after highlighted in yellow in the 2/15/19 mid-day report.
>>> FEATURED STOCK ARTICLE : Volume-Driven Gain for New High Close - 2/19/2019 |
View all notes |
Set NEW NOTE alert |
Company Profile |
SEC
News |
Chart |
Request a new note
C
A
S
I |
Symbol/Exchange
Company Name
Industry Group |
PRICE |
CHANGE
(%Change) |
Day High |
Volume
(% DAV)
(% 50 day avg vol) |
52 Wk Hi
% From Hi |
Featured
Date |
Price
Featured |
Pivot Featured |
|
Max Buy |
IRBT
-
NASDAQ
Irobot Corp
CONSUMER DURABLES - Electronic Equipment
|
$130.78
|
+1.22
0.94% |
$130.79
|
891,157
108.94% of 50 DAV
50 DAV is 818,000
|
$129.96
0.63%
|
2/8/2019
|
$104.92
|
PP = $103.63
|
|
MB = $108.81
|
Most Recent Note - 3/1/2019 5:59:07 PM
G - Hit another new all-time high with average volume behind today's 3rd consecutive gain. Recent gains have lacked great volume conviction. It is extended from the previously noted "double bottom" base. Prior high ($103) defines initial support to watch on pullbacks.
>>> FEATURED STOCK ARTICLE : Volume-Driven Gains Cleared Prior High After Double Bottom - 2/8/2019 |
View all notes |
Set NEW NOTE alert |
Company Profile |
SEC
News |
Chart |
Request a new note
C
A
S
I |
LHCG
-
NASDAQ
L H C Group Inc
HEALTH SERVICES - Home Health Care
|
$109.18
|
-0.25
-0.23% |
$110.09
|
247,059
92.53% of 50 DAV
50 DAV is 267,000
|
$114.22
-4.41%
|
1/23/2019
|
$107.29
|
PP = $107.61
|
|
MB = $112.99
|
Most Recent Note - 2/28/2019 12:48:04 PM
Y - Managed a "positive reversal" after a gap down today. Reported earnings +66% on +75% sales revenues for the Dec '18 quarter. Volume and volatility often increase near earnings news. Recent gains into new high territory lacked great volume conviction. A solid gain and close above the pivot point backed by at least +40% above average volume may help clinch a convincing technical buy signal.
>>> FEATURED STOCK ARTICLE : Recent Gains for New Highs Lacked Great Volume Conviction - 2/21/2019 |
View all notes |
Set NEW NOTE alert |
Company Profile |
SEC
News |
Chart |
Request a new note
C
A
S
I |
ENSG
-
NASDAQ
Ensign Group Inc
HEALTH SERVICES - Long-Term Care Facilities
|
$50.62
|
+0.50
1.00% |
$50.98
|
358,054
101.15% of 50 DAV
50 DAV is 354,000
|
$54.56
-7.22%
|
2/7/2019
|
$48.71
|
PP = $49.06
|
|
MB = $51.51
|
Most Recent Note - 3/1/2019 6:08:32 PM
Y - Volume totals have been cooling while consolidating above prior highs in the $48 area defining initial support to watch.
>>> FEATURED STOCK ARTICLE : Closed Near Pivot Point After Gap Up and Big Volume-Driven Gain - 2/7/2019 |
View all notes |
Set NEW NOTE alert |
Company Profile |
SEC
News |
Chart |
Request a new note
C
A
S
I |
NXST
-
NASDAQ
Nexstar Media Group Cl A
MEDIA - Broadcasting - TV
|
$100.73
|
-0.82
-0.81% |
$102.40
|
648,208
110.24% of 50 DAV
50 DAV is 588,000
|
$102.70
-1.92%
|
2/26/2019
|
$94.26
|
PP = $89.76
|
|
MB = $94.25
|
Most Recent Note - 3/1/2019 1:39:09 PM
G - Color code is changed to green after rallying above its "max buy"level with a 4th consecutive volume-driven gain. Recent quarterly comparisons through Dec '18 showed strong earnings increases above the +25% minimum guideline (C criteria) versus the year ago periods with encouraging sales revenues acceleration. See the latest FSU analysis for more details and an annotated graph.
>>> FEATURED STOCK ARTICLE : Twice Average Volume Behind Gain for New High - 2/26/2019 |
View all notes |
Set NEW NOTE alert |
Company Profile |
SEC
News |
Chart |
Request a new note
C
A
S
I |
BSTC
-
NASDAQ
Biospecifics Technologie
Medical-Biomed/Biotech
|
$71.12
|
+0.30
0.42% |
$72.83
|
42,289
93.98% of 50 DAV
50 DAV is 45,000
|
$73.31
-2.99%
|
1/18/2019
|
$67.40
|
PP = $66.31
|
|
MB = $69.63
|
Most Recent Note - 3/1/2019 6:01:17 PM
G - Color code is changed to green after rising above its "max buy" level with today's 3rd consecutive gain with lighter than average volume. Prior highs and its 50 DMA line define near-term support to watch on pullbacks.
>>> FEATURED STOCK ARTICLE : Reversed Into Red After Hitting a New High - 2/5/2019 |
View all notes |
Set NEW NOTE alert |
Company Profile |
SEC
News |
Chart |
Request a new note
C
A
S
I |
Symbol/Exchange
Company Name
Industry Group |
PRICE |
CHANGE
(%Change) |
Day High |
Volume
(% DAV)
(% 50 day avg vol) |
52 Wk Hi
% From Hi |
Featured
Date |
Price
Featured |
Pivot Featured |
|
Max Buy |
UBNT
-
NASDAQ
Ubiquiti Networks
TELECOMMUNICATIONS - Diversified Communication Serv
|
$143.86
|
-0.52
-0.36% |
$145.50
|
374,409
94.55% of 50 DAV
50 DAV is 396,000
|
$148.68
-3.24%
|
2/8/2019
|
$121.97
|
PP = $115.54
|
|
MB = $121.32
|
Most Recent Note - 3/4/2019 8:29:58 PM
G - Holding its ground perched near its all-time high, very extended from the prior base. Fundamentals remain strong. Prior high ($115) defines initial support to watch on pullbacks.
>>> FEATURED STOCK ARTICLE : Consolidating Above 50-Day Moving Average - 1/31/2019 |
View all notes |
Set NEW NOTE alert |
Company Profile |
SEC
News |
Chart |
Request a new note
C
A
S
I |
NOW
-
NYSE
Servicenow Inc
Computer Sftwr-Enterprse
|
$236.97
|
-6.55
-2.69% |
$245.33
|
4,415,461
200.52% of 50 DAV
50 DAV is 2,202,000
|
$244.35
-3.02%
|
1/31/2019
|
$218.14
|
PP = $206.40
|
|
MB = $216.72
|
Most Recent Note - 3/4/2019 12:26:26 PM
G - Reversed into the red today for a loss on higher volume after wedging to new all-time highs with recent gains lacking great volume. Prior high ($206) defines initial support to watch on pullbacks.
>>> FEATURED STOCK ARTICLE : Breakaway Gap Followed Strong Earnings Report - 2/1/2019 |
View all notes |
Set NEW NOTE alert |
Company Profile |
SEC
News |
Chart |
Request a new note
C
A
S
I |
PANW
-
NYSE
Palo Alto Networks
Computer Sftwr-Security
|
$242.54
|
-2.93
-1.19% |
$248.96
|
1,569,343
108.53% of 50 DAV
50 DAV is 1,446,000
|
$260.63
-6.94%
|
2/25/2019
|
$233.54
|
PP = $239.60
|
|
MB = $251.58
|
Most Recent Note - 2/28/2019 12:52:15 PM
Y - Pulling back today. Hit a new all-time high with a big "breakaway gap" on the prior session clinching a technical buy signal while rising from a 23-week cup shaped base. Prior high ($239) defines initial support to watch on pullbacks. Reported earnings +44% on +30% sales revenues for the Jan '19 quarter, continuing its strong earnings track record.
>>> FEATURED STOCK ARTICLE : Rebounded Near Prior High With Earnings News Due - 2/25/2019 |
View all notes |
Set NEW NOTE alert |
Company Profile |
SEC
News |
Chart |
Request a new note
C
A
S
I |
PAYC
-
NYSE
Paycom Software Inc
COMPUTER SOFTWARE and SERVICES - Application Software
|
$177.42
|
-4.38
-2.41% |
$183.38
|
902,772
140.62% of 50 DAV
50 DAV is 642,000
|
$186.00
-4.61%
|
2/6/2019
|
$171.66
|
PP = $164.18
|
|
MB = $172.39
|
Most Recent Note - 3/4/2019 12:27:33 PM
G - Pulling back today with higher volume, encountering distributional pressure. Volume totals had been cooling while hovering near its all-time high, extended from any sound base. Prior high ($164) defines initial support to watch above its 50 DMA line.
>>> FEATURED STOCK ARTICLE : Breakaway Gap Backed by Volume +388% Above Average - 2/6/2019 |
View all notes |
Set NEW NOTE alert |
Company Profile |
SEC
News |
Chart |
Request a new note
C
A
S
I |
PYPL
-
NASDAQ
Paypal Holdings Inc
Finance-CrdtCard/PmtPr
|
$96.57
|
-2.23
-2.26% |
$98.50
|
7,855,672
90.89% of 50 DAV
50 DAV is 8,643,000
|
$99.45
-2.90%
|
1/24/2019
|
$92.56
|
PP = $93.80
|
|
MB = $98.49
|
Most Recent Note - 3/4/2019 8:32:15 PM
Y - Pulled back today with higher (near average) volume. Recent gains into new high territory came with light volume, not indicative of great institutional buying demand. Prior highs in the $92 area define support above its 50 DMA line ($90.54).
>>> FEATURED STOCK ARTICLE : Wedging into New High Territory With Gains Lacking Volume - 2/22/2019 |
View all notes |
Set NEW NOTE alert |
Company Profile |
SEC
News |
Chart |
Request a new note
C
A
S
I |
Symbol/Exchange
Company Name
Industry Group |
PRICE |
CHANGE
(%Change) |
Day High |
Volume
(% DAV)
(% 50 day avg vol) |
52 Wk Hi
% From Hi |
Featured
Date |
Price
Featured |
Pivot Featured |
|
Max Buy |
ALRM
-
NASDAQ
Alarm.com Holdings Inc
Security/Sfty
|
$57.08
|
-2.23
-3.76% |
$59.67
|
1,605,431
294.57% of 50 DAV
50 DAV is 545,000
|
$65.85
-13.32%
|
1/22/2019
|
$60.52
|
PP = $60.30
|
|
MB = $63.32
|
Most Recent Note - 3/4/2019 8:35:52 PM
G - Violated its 50 DMA line ($58.62) with today's 2nd consecutive big volume-driven loss triggering a technical sell signal. Gapped down on the prior session undercutting prior highs. Weak action came after it reported earnings +12% on +25% sales revenues for the Dec '18 quarter, below the +25% minimum earnings guideline (C criteria), raising fundamental concerns.
>>> FEATURED STOCK ARTICLE : Volume Totals Cooling While Perched at All-Time High - 2/20/2019 |
View all notes |
Set NEW NOTE alert |
Company Profile |
SEC
News |
Chart |
Request a new note
C
A
S
I |
PLNT
-
NYSE
Planet Fitness Inc Cl A
Leisure-Services
|
$61.74
|
+0.57
0.93% |
$61.94
|
2,279,227
160.62% of 50 DAV
50 DAV is 1,419,000
|
$61.90
-0.26%
|
11/7/2018
|
$57.10
|
PP = $55.45
|
|
MB = $58.22
|
Most Recent Note - 3/1/2019 6:11:39 PM
G - Posted a 4th consecutive gain today with above average volume, rising further above its "max buy" level. Found support near its 50 DMA line ($56.78) and recent low. Reported earnings +42% on +30% sales revenues for the Dec '18 quarter. Volume and volatility often increase near earnings news. See the latest FSU analysis for additional details and an annotated graph.
>>> FEATURED STOCK ARTICLE : Met Distributional Pressure While Hitting New High After Earnings - 2/27/2019 |
View all notes |
Set NEW NOTE alert |
Company Profile |
SEC
News |
Chart |
Request a new note
C
A
S
I |
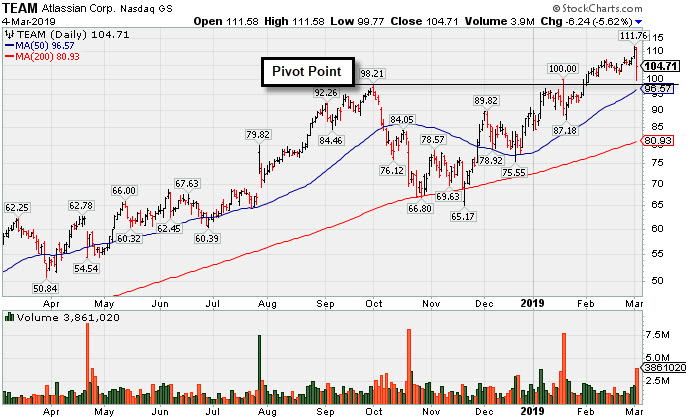
TEAM
-
NASDAQ
Atlassian Corp Plc Cl A
Comp Sftwr-Spec Enterprs
|
$104.71
|
-6.24
-5.62% |
$111.58
|
3,863,173
220.25% of 50 DAV
50 DAV is 1,754,000
|
$111.76
-6.31%
|
1/7/2019
|
$94.68
|
PP = $98.31
|
|
MB = $103.23
|
Most Recent Note - 3/4/2019 8:26:25 PM
G - Loss today came with above average volume after wedging to new all-time highs with recent gains lacking great volume conviction. Color code is changed to green after finishing the session back above its "max buy" level. Prior high ($98.21) and 50 DMA line ($96.57) define near-term support to watch on pullbacks. Fundamentals remain strong. See the latest FSU analysis for more details and a new annotated graph.
>>> FEATURED STOCK ARTICLE : Pullback on Higher Volume After Recent Gains With Less Volume - 3/4/2019 |
View all notes |
Set NEW NOTE alert |
Company Profile |
SEC
News |
Chart |
Request a new note
C
A
S
I |
GLOB
-
NYSE
Globant SA
Computer-Tech Services
|
$71.29
|
+0.71
1.01% |
$71.78
|
162,556
68.59% of 50 DAV
50 DAV is 237,000
|
$74.00
-3.66%
|
2/15/2019
|
$69.35
|
PP = $70.00
|
|
MB = $73.50
|
Most Recent Note - 3/1/2019 6:13:08 PM
Y - Sputtering since recently rallying from an advanced "3-weeks tight" base. Prior low ($65.73 on 2/08/19) defines near-term support above its 50 DMA line ($63.78).
>>> FEATURED STOCK ARTICLE : Volume-Driven Gain From Advanced "3-Weeks Tight" Base - 2/15/2019 |
View all notes |
Set NEW NOTE alert |
Company Profile |
SEC
News |
Chart |
Request a new note
C
A
S
I |
TTD
-
NASDAQ
The Trade Desk Inc Cl A
Comml Svcs-Advertising
|
$189.38
|
-5.74
-2.94% |
$197.71
|
2,164,673
160.35% of 50 DAV
50 DAV is 1,350,000
|
$202.30
-6.39%
|
2/6/2019
|
$148.65
|
PP = $149.00
|
|
MB = $156.45
|
Most Recent Note - 3/1/2019 6:07:23 PM
G - Still stubbornly holding its ground near its all-time high, above its "max buy" level. Bullish action on the prior session came after it reported earnings +102% on +56% sales revenues for the Dec '18 quarter. Prior high ($161) defines initial support to watch on pullbacks.
>>> FEATURED STOCK ARTICLE : Near High After Third Consecutive Gain with Light Volume - 2/12/2019 |
View all notes |
Set NEW NOTE alert |
Company Profile |
SEC
News |
Chart |
Request a new note
C
A
S
I |
Symbol/Exchange
Company Name
Industry Group |
PRICE |
CHANGE
(%Change) |
Day High |
Volume
(% DAV)
(% 50 day avg vol) |
52 Wk Hi
% From Hi |
Featured
Date |
Price
Featured |
Pivot Featured |
|
Max Buy |
MEDP
-
NASDAQ
Medpace Holdings Inc
Medical-Research Eqp/Svc
|
$54.99
|
+0.25
0.46% |
$55.22
|
917,243
101.80% of 50 DAV
50 DAV is 901,000
|
$71.66
-23.26%
|
1/30/2019
|
$64.10
|
PP = $65.19
|
|
MB = $68.45
|
Most Recent Note - 2/28/2019 12:00:15 PM
G - Sputtering near its 200 DMA line ($54.26). Gapped down on 2/26/19 following earnings news, negating the recent breakout and violating its 50 DMA line ($60) with a damaging volume-driven loss triggering a technical sell signal. Reported earnings +95% on +71% sales revenues for the Dec '18 quarter. continuing its strong earnings track record. A rebound above the 50 DMA line is needed for its outlook to improve.
>>> FEATURED STOCK ARTICLE : Damaging Gap Down Triggered Technical Sell Signal - 2/28/2019 |
View all notes |
Set NEW NOTE alert |
Company Profile |
SEC
News |
Chart |
Request a new note
C
A
S
I |