You are not logged in.
This means you
CAN ONLY VIEW reports that were published prior to Tuesday, March 11, 2025.
You
MUST UPGRADE YOUR MEMBERSHIP if you want to see any current reports.
AFTER MARKET UPDATE - WEDNESDAY, FEBRUARY 23RD, 2022
Previous After Market Report Next After Market Report >>>
|
|
|
|
DOW |
-464.85 |
33,131.76 |
-1.38% |
|
Volume |
1,012,566,084 |
-8% |
|
Volume |
4,568,775,900 |
-5% |
|
NASDAQ |
-344.03 |
13,037.49 |
-2.57% |
|
Advancers |
813 |
25% |
|
Advancers |
1,105 |
26% |
|
S&P 500 |
-79.26 |
4,225.50 |
-1.84% |
|
Decliners |
2,394 |
75% |
|
Decliners |
3,120 |
74% |
|
Russell 2000 |
-36.08 |
1,944.09 |
-1.82% |
|
52 Wk Highs |
23 |
|
|
52 Wk Highs |
28 |
|
|
S&P 600 |
-18.72 |
1,260.43 |
-1.46% |
|
52 Wk Lows |
394 |
|
|
52 Wk Lows |
728 |
|
|
The weakening major averages again signaled a market correction (M criteria). Losses on Wednesday led to new low closes for the year for all of the major averages. The fact-based investment system's rules say that new buying efforts should be avoided during market corrections.
|
 |
Correction Worsened After Major Averages Erased Early Gains
Kenneth J. Gruneisen - Passed the CAN SLIM® Master's Exam
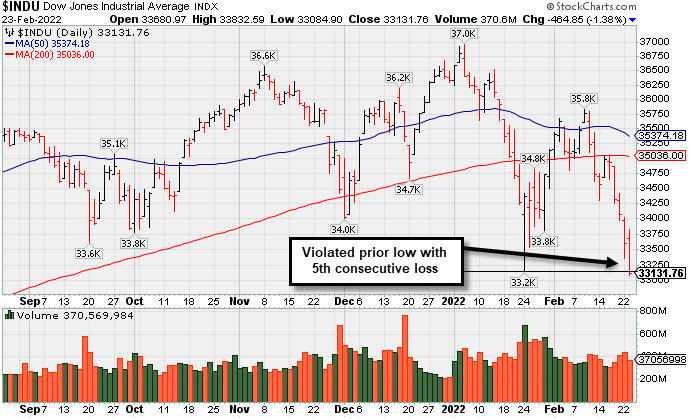
The S&P 500 fell 1.8%, and the Nasdaq Composite retreated 2.6%, now 18.8% below its November 19 record high. The Dow lost 464 points or 1.4%. Volume totals reported were lighter than the prior session totals on the NYSE and on the Nasdaq exchange, hinting that the selling was not coming from more institutional pressure. Breadth was clearly negative as decliners led advancers by almost a 3-1 margin on the NYSE and on the Nasdaq exchange. There were 7 high-ranked companies from the Leaders List that hit new 52-week highs and were listed on the BreakOuts Page, versus 8 on the prior session. New 52-week lows totals swelled and solidly outnumbered shrinking new 52-week highs totals on the NYSE and on the Nasdaq exchange. The market averages (M criteria) are weak and have signaled a more worrisome "correction" as the major indices all closed at new lows for the year.
 PICTURED: The Dow Jones Industrial Average has violated the its January low with a 5th consecutive loss, slumping well below Its 200-day moving average (DMA) line.
U.S. stocks finished firmly lower on Wednesday amid escalating geopolitical uncertainty. The benchmark S&P 500 Index is in correction territory (defined as a 10% drawdown from a recent peak) for the first time since the start of the pandemic. Treasuries weakened, with the 10-year note yield climbing five basis points (0.05%) to 1.98%.
President Biden imposed another round of sanctions on Russia that impacted the builder of the Nord Stream 2 gas pipeline and its corporate officers. These penalties followed initial sanctions on some Russian banks and individuals announced on Tuesday, and were in response to Russian President Putin recognizing two breakaway regions in eastern Ukraine as independent states, with “peacekeeping forces” being ordered into the separatist areas. Investors are closely monitoring the developments, assessing the possible economic implications of a potential all-out Russian invasion of Ukraine.
Ten of 11 S&P 500 sectors closed in negative territory, with Consumer Discretionary shares faring the worst amid weakness in retailers. Technology was also among the hardest hit groups following a cyberattack on a number of Ukraine government and bank websites. The FAANG complex of mega-cap stocks shed more than 2.4%. In earnings, shares of Lowe’s Cos Inc. (LOW +0.23%) ended little changed despite the home improvement retailer topping profit and sales estimates and providing a positive full-year outlook. Discount department store TJX Cos Inc. (TJX -4.21%) slid on disappointing earnings and revenue. Elsewhere, Caesars Entertainment Inc. (CZR +2.81%) rose following a smaller-than-anticipated quarterly loss. |
 Kenneth J. Gruneisen started out as a licensed stockbroker in August 1987, a couple of months prior to the historic stock market crash that took the Dow Jones Industrial Average down -22.6% in a single day. He has published daily fact-based fundamental and technical analysis on high-ranked stocks online for two decades. Through FACTBASEDINVESTING.COM, Kenneth provides educational articles, news, market commentary, and other information regarding proven investment systems that work in good times and bad.
Comments contained in the body of this report are technical opinions only and are not necessarily those of Gruneisen Growth Corp. The material herein has been obtained from sources believed to be reliable and accurate, however, its accuracy and completeness cannot be guaranteed. Our firm, employees, and customers may effect transactions, including transactions contrary to any recommendation herein, or have positions in the securities mentioned herein or options with respect thereto. Any recommendation contained in this report may not be suitable for all investors and it is not to be deemed an offer or solicitation on our part with respect to the purchase or sale of any securities. |
|
 |
Retail, Tech, and Financials Fell; Commodity-Linked Groups Rose
Kenneth J. Gruneisen - Passed the CAN SLIM® Master's Exam
The Retail Index ($RLX -3.09%) suffered a big loss and created a drag on the major averages while the Bank Index ($BKX -2.52%) and Broker/Dealer Index ($XBD -1.91%) also slumped. The tech sector clearly had a negative bias as the Semiconductor Index ($SOX -2.33%), Biotech Index ($BTK -2.20%), and Networking Index ($NWX -1.89%) suffered unanimous losses. Meanwhile, commodity-linked groups had a positive bias as the Gold & Silver Index ($XAU +2.32%) outpaced the Oil Services Index ($OSX +0.40%) and the Integrated Oil Index ($XOI +0.63%). PICTURED: The Bank Index ($BKX -2.52%) has been slumping below its 50-day moving average (DMA) toward its 200 DMA line.
| Oil Services |
$OSX |
66.52 |
+0.27 |
+0.40% |
+26.17% |
| Integrated Oil |
$XOI |
1,418.79 |
+8.87 |
+0.63% |
+20.42% |
| Semiconductor |
$SOX |
3,277.80 |
-78.26 |
-2.33% |
-16.94% |
| Networking |
$NWX |
836.81 |
-16.11 |
-1.89% |
-13.83% |
| Broker/Dealer |
$XBD |
474.51 |
-9.22 |
-1.91% |
-2.54% |
| Retail |
$RLX |
3,519.72 |
-112.11 |
-3.09% |
-16.72% |
| Gold & Silver |
$XAU |
143.26 |
+3.25 |
+2.32% |
+8.16% |
| Bank |
$BKX |
133.55 |
-3.45 |
-2.52% |
+1.01% |
| Biotech |
$BTK |
4,816.59 |
-108.24 |
-2.20% |
-12.72% |
|
|
|
 |
Featured Stocks
Kenneth J. Gruneisen - Passed the CAN SLIM® Master's Exam
|
|
|
Color Codes Explained :
Y - Better candidates highlighted by our
staff of experts.
G - Previously featured
in past reports as yellow but may no longer be buyable under the
guidelines.
***Last / Change / Volume data in this table is the closing quote data***
Symbol/Exchange
Company Name
Industry Group |
PRICE |
CHANGE
(%Change) |
Day High |
Volume
(% DAV)
(% 50 day avg vol) |
52 Wk Hi
% From Hi |
Featured
Date |
Price
Featured |
Pivot Featured |
|
Max Buy |
 REGN
-
NASDAQ
REGN
-
NASDAQ
Regeneron Pharmaceutical
DRUGS - Biotechnology
|
$608.98
|
+6.09
1.01% |
$625.00
|
861,450
108.77% of 50 DAV
50 DAV is 792,000
|
$686.62
-11.31%
|
12/13/2021
|
$647.95
|
PP = $686.72
|
|
MB = $721.06
|
 Most Recent Note - 2/23/2022 5:32:17 PM
G - Consolidating in a tight range below its 50 DMA line ($622) and nearly testing its 200 DMA line ($600), with prior lows in the $592-596 area defining very important near-term support.
>>> FEATURED STOCK ARTICLE : Earnings News Due While Consolidating Above 200 DMA Line - 2/1/2022 |
View all notes |
Set NEW NOTE alert |
Company Profile |
SEC
News |
Chart |
Request a new note
C
A
S
I |
SF
-
NYSE
Stifel Financial Corp
FINANCIAL SERVICES - Investment Brokerage - Regiona
|
$72.30
|
-1.36
-1.85% |
$74.60
|
516,811
84.58% of 50 DAV
50 DAV is 611,000
|
$83.28
-13.18%
|
1/27/2022
|
$74.17
|
PP = $76.23
|
|
MB = $80.04
|
Most Recent Note - 2/23/2022 5:29:21 PM
G - Suffered a 5th consecutive loss today raising concerns while slumping below its 50 DMA line ($73.04) and its color code is changed to green. Its 200 DMA line defines the next support ($70.05) to watch.
>>> FEATURED STOCK ARTICLE : Fourth Loss Following "Negative Reversal" at All-Time High - 2/14/2022 |
View all notes |
Set NEW NOTE alert |
Company Profile |
SEC
News |
Chart |
Request a new note
C
A
S
I |
TGH
-
NYSE
Textainer Group Holdings
TRANSPORTATION - Logistics
|
$35.77
|
-1.41
-3.79% |
$37.78
|
386,047
89.36% of 50 DAV
50 DAV is 432,000
|
$41.89
-14.61%
|
1/31/2022
|
$36.68
|
PP = $41.34
|
|
MB = $43.41
|
Most Recent Note - 2/23/2022 5:26:54 PM
G - Violated its 50 DMA line ($37.15) with today's 5th consecutive loss raising greater concerns and its color code is changed to green. Its 200 DMA line ($34.56) and prior lows define the next important support to watch. Recently reported Dec '21 quarterly earnings +80% on +23% sales revenues versus the year ago period. A rebound above the 50 DMA line is needed for its outlook to improve.
>>> FEATURED STOCK ARTICLE : Consolidating Near High Following Strong Earnings Report - 2/15/2022 |
View all notes |
Set NEW NOTE alert |
Company Profile |
SEC
News |
Chart |
Request a new note
C
A
S
I |
HWKN
-
NASDAQ
Hawkins Inc
CHEMICALS - Basic Chemicals
|
$43.59
|
+0.59
1.37% |
$43.95
|
58,416
104.31% of 50 DAV
50 DAV is 56,000
|
$43.96
-0.84%
|
2/3/2022
|
$39.81
|
PP = $41.07
|
|
MB = $43.12
|
Most Recent Note - 2/23/2022 5:24:12 PM
G - Perched near its all-time high stubbornly holding its ground, extended from the previously noted base. Prior highs in the $40 area define initial support above its 50 DMA line ($39.27).
>>> FEATURED STOCK ARTICLE : Extended From Prior Base After 6th Consecutive Gain - 2/18/2022 |
View all notes |
Set NEW NOTE alert |
Company Profile |
SEC
News |
Chart |
Request a new note
C
A
S
I |
|
|
|
THESE ARE NOT BUY RECOMMENDATIONS!
Comments contained in the body of this report are technical
opinions only. The material herein has been obtained
from sources believed to be reliable and accurate, however,
its accuracy and completeness cannot be guaranteed.
This site is not an investment advisor, hence it does
not endorse or recommend any securities or other investments.
Any recommendation contained in this report may not
be suitable for all investors and it is not to be deemed
an offer or solicitation on our part with respect to
the purchase or sale of any securities. All trademarks,
service marks and trade names appearing in this report
are the property of their respective owners, and are
likewise used for identification purposes only.
This report is a service available
only to active Paid Premium Members.
You may opt-out of receiving report notifications
at any time. Questions or comments may be submitted
by writing to Premium Membership Services 665 S.E. 10 Street, Suite 201 Deerfield Beach, FL 33441-5634 or by calling 1-800-965-8307
or 954-785-1121.
|
|
|