You are not logged in.
This means you
CAN ONLY VIEW reports that were published prior to Sunday, March 30, 2025.
You
MUST UPGRADE YOUR MEMBERSHIP if you want to see any current reports.
AFTER MARKET UPDATE - TUESDAY, FEBRUARY 1ST, 2022
Previous After Market Report Next After Market Report >>>
|
|
|
|
DOW |
+273.38 |
35,405.24 |
+0.78% |
|
Volume |
1,010,078,374 |
-28% |
|
Volume |
4,577,688,700 |
-10% |
|
NASDAQ |
+106.12 |
14,346.00 |
+0.75% |
|
Advancers |
2,433 |
73% |
|
Advancers |
3,338 |
73% |
|
S&P 500 |
+30.80 |
4,546.35 |
+0.68% |
|
Decliners |
892 |
27% |
|
Decliners |
1,207 |
27% |
|
Russell 2000 |
+22.29 |
2,050.74 |
+1.10% |
|
52 Wk Highs |
63 |
|
|
52 Wk Highs |
57 |
|
|
S&P 600 |
+9.80 |
1,309.03 |
+0.75% |
|
52 Wk Lows |
48 |
|
|
52 Wk Lows |
123 |
|
|
Disciplined investors will note Monday's follow-through day in the market (M criteria) confirmed a new uptrend. New buying efforts may be made in stocks fitting all key criteria of the fact-based investment system.
|
 |
Major Averages Posted Gains With Lighter Volume Totals
Kenneth J. Gruneisen - Passed the CAN SLIM® Master's Exam
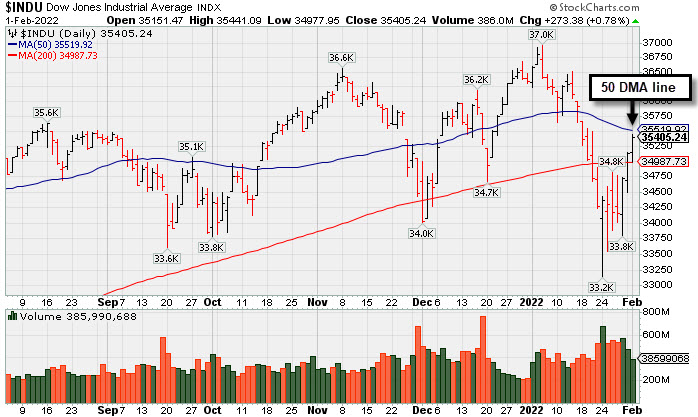
The S&P 500 climbed 0.7%, while the Nasdaq Composite jumped 0.8% as the two benchmarks aimed to recover from their biggest monthly drawdowns since March 2020. The S&P 500 advanced for a third consecutive session for the first time this year, with its three-day rally the strongest since the depths of the pandemic (+5%). The Dow gained 273 points, back within 3.8% of its January 4 record. Volume totals reported were lighter than the prior session on the NYSE and on the Nasdaq exchange, indicative of less buying demand coming from the institutional crowd. Advancers led decliners by almost a 3-1 margin on the NYSE and on the Nasdaq exchange. There were 14 high-ranked companies from the Leaders List that hit new 52-week highs and were listed on the BreakOuts Page, versus 11 on the prior session. New 52-week highs outnumbered new lows on the NYSE but new lows still outnumbered new highs on the Nasdaq exchange. Solid gains noted on Monday for the Nasdaq Composite (+3.4%) and S&P 500 Index (+1.9%) with higher volume coupled with greater leadership marked a follow-through day confirming a new uptrend for the market averages (M criteria). PICTURED: The Dow Jones Industrial Average quietly rose above its 200-day moving average (DMA) line toward its 50 DMA line with lighter volume behind the latest gains.
U.S. stocks finished higher on Tuesday as investors digested economic data and corporate earnings. On the data front, an update from the Institute for Supply Management showed U.S. manufacturing activity expanded at the slowest pace since November 2020 last month, while a component measuring input costs spiked. Separately, the Jobs Openings and Labor Turnover Survey (JOLTS) revealed the number of available positions unexpectedly increased in December to 10.9 million. Treasuries were little changed, with the yield on the 10-year note holding steady at 1.79%, on the heels of a 28-basis point (0.28%) increase in January. In commodities, West Texas Intermediate crude hovered at a seven-year high after logging its best month since February 2021 (+17.5%).
In earnings, United Parcel Service Inc. (UPS +14.08%) gapped up for a new all-time high following positive guidance and a boost to its dividend. Elsewhere, Exxon Mobil Corp. (XOM +6.41%) hit a new 52-week high after topping analyst profit estimates and announcing a new $10 billion share repurchase program. In other corporate news, AT&T Inc. (T -4.24%) slid after slashing its dividend by almost 50% and sharing plans to spin off its stake in WarnerMedia after a previously announced combination of the unit with Discovery Inc. (DISCA -2.65%). |
 Kenneth J. Gruneisen started out as a licensed stockbroker in August 1987, a couple of months prior to the historic stock market crash that took the Dow Jones Industrial Average down -22.6% in a single day. He has published daily fact-based fundamental and technical analysis on high-ranked stocks online for two decades. Through FACTBASEDINVESTING.COM, Kenneth provides educational articles, news, market commentary, and other information regarding proven investment systems that work in good times and bad.
Comments contained in the body of this report are technical opinions only and are not necessarily those of Gruneisen Growth Corp. The material herein has been obtained from sources believed to be reliable and accurate, however, its accuracy and completeness cannot be guaranteed. Our firm, employees, and customers may effect transactions, including transactions contrary to any recommendation herein, or have positions in the securities mentioned herein or options with respect thereto. Any recommendation contained in this report may not be suitable for all investors and it is not to be deemed an offer or solicitation on our part with respect to the purchase or sale of any securities. |
|
 |
Financial, Energy, and Biotech Indexes Led Group Gainers
Kenneth J. Gruneisen - Passed the CAN SLIM® Master's Exam
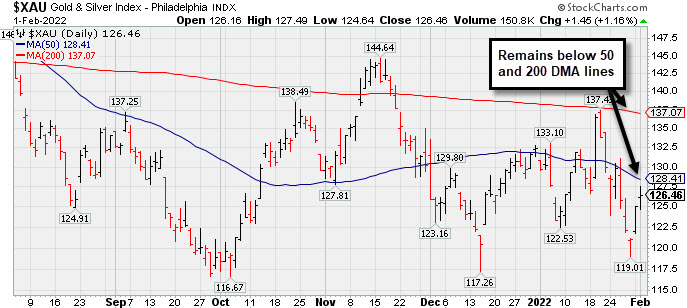
The Bank Index ($BKX +2.37%) and Broker/Dealer Index ($XBD +1.94%) both posted solid gains and the Retail Index ($RLX +0.81%) also edged higher. Energy-linked groups were standout gainers as the Oil Services Index ($OSX +4.23%) and Integrated Oil Index ($XOI +3.04%) both jumped higher. The Gold & Silver Index ($XAU +1.15%) posted a smaller gain. The Biotech Index ($BTK +1.91%) led the tech sector and the Semiconductor Index ($SOX +0.79%) posted a smaller gain, meanwhile, the Networking Index ($NWX -0.13%) ended slightly in the red. PICTURED: The Gold & Silver Index ($XAU +1.15%) remains below its 50-day and 200-day moving average (DMA) lines.
| Oil Services |
$OSX |
67.03 |
+2.72 |
+4.23% |
+27.14% |
| Integrated Oil |
$XOI |
1,427.83 |
+42.09 |
+3.04% |
+21.19% |
| Semiconductor |
$SOX |
3,510.86 |
+27.66 |
+0.79% |
-11.03% |
| Networking |
$NWX |
870.17 |
-1.14 |
-0.13% |
-10.39% |
| Broker/Dealer |
$XBD |
490.16 |
+9.31 |
+1.94% |
+0.68% |
| Retail |
$RLX |
3,834.06 |
+30.98 |
+0.81% |
-9.28% |
| Gold & Silver |
$XAU |
126.46 |
+1.44 |
+1.15% |
-4.53% |
| Bank |
$BKX |
138.18 |
+3.20 |
+2.37% |
+4.51% |
| Biotech |
$BTK |
5,174.06 |
+97.15 |
+1.91% |
-6.24% |
|
|
|
 |
Earnings News Due While Consolidating Above 200 DMA Line
Kenneth J. Gruneisen - Passed the CAN SLIM® Master's Exam
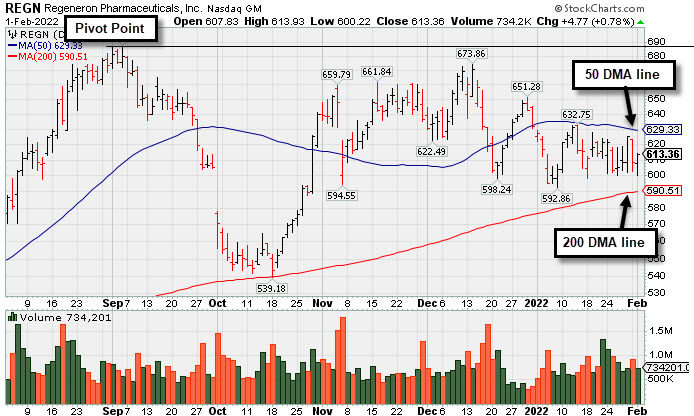
Regeneron Pharmaceutical (REGN +$4.77 or +0.78% to $613.36) has recently been holding its ground in a tight range above prior lows and above its 200-day moving average (DMA) line ($590.51) which define important near-term support. Keep in mind it is due to report Dec '21 quarterly results on Friday, 2/04/22. Volume and volatility often increase near earnings news. The lack of price progress with higher volume totals in recent weeks is action indicative of distributional pressure. Its Relative Strength rating is 85, still well above the 80+ minimum guideline for buy candidates. A rebound above the 50 DMA line ($629.33) is needed for its outlook to improve.
The high-ranked DRUGS - Biotechnology firm reported earnings +84% on +51% sales revenues for the Sep '21 quarter versus the year ago period. That marked its 5th quarterly comparison above the +25% minimum earnings guideline (C criteria) and with a strong sales revenues growth rate. Its annual earnings (A criteria) growth has been strong. It has a 99 Earnings Per Share Rating.
There are 2,733 top-rated funds that own its shares as of Dec '21, up from 2,376 in Dec '20, a reassuring sign concerning the I criteria. Its current Up/Down Volume Ratio of 1.1 is an unbiased indication its shares have been under slight acumulation over the past 50 days. REGN completed a Secondary Offering on 5/28/20. There are 96.2 million shares in the public float (S criteria) which can contribute to greater volatility in the event of institutional buying or selling.
|
|
|
Color Codes Explained :
Y - Better candidates highlighted by our
staff of experts.
G - Previously featured
in past reports as yellow but may no longer be buyable under the
guidelines.
***Last / Change / Volume data in this table is the closing quote data***
|
|
|
THESE ARE NOT BUY RECOMMENDATIONS!
Comments contained in the body of this report are technical
opinions only. The material herein has been obtained
from sources believed to be reliable and accurate, however,
its accuracy and completeness cannot be guaranteed.
This site is not an investment advisor, hence it does
not endorse or recommend any securities or other investments.
Any recommendation contained in this report may not
be suitable for all investors and it is not to be deemed
an offer or solicitation on our part with respect to
the purchase or sale of any securities. All trademarks,
service marks and trade names appearing in this report
are the property of their respective owners, and are
likewise used for identification purposes only.
This report is a service available
only to active Paid Premium Members.
You may opt-out of receiving report notifications
at any time. Questions or comments may be submitted
by writing to Premium Membership Services 665 S.E. 10 Street, Suite 201 Deerfield Beach, FL 33441-5634 or by calling 1-800-965-8307
or 954-785-1121.
|
|
|