You are not logged in.
This means you
CAN ONLY VIEW reports that were published prior to Wednesday, April 9, 2025.
You
MUST UPGRADE YOUR MEMBERSHIP if you want to see any current reports.
AFTER MARKET UPDATE - THURSDAY, FEBRUARY 24TH, 2022
Previous After Market Report Next After Market Report >>>
|
|
|
|
DOW |
+92.07 |
33,223.83 |
+0.28% |
|
Volume |
1,467,703,363 |
+45% |
|
Volume |
6,103,469,700 |
+34% |
|
NASDAQ |
+436.10 |
13,473.59 |
+3.34% |
|
Advancers |
1,860 |
57% |
|
Advancers |
2,486 |
60% |
|
S&P 500 |
+63.20 |
4,288.70 |
+1.50% |
|
Decliners |
1,383 |
43% |
|
Decliners |
1,681 |
40% |
|
Russell 2000 |
+51.26 |
1,995.35 |
+2.64% |
|
52 Wk Highs |
22 |
|
|
52 Wk Highs |
29 |
|
|
S&P 600 |
+21.69 |
1,282.12 |
+1.72% |
|
52 Wk Lows |
792 |
|
|
52 Wk Lows |
1,344 |
|
|
The weakening major averages signaled a market correction (M criteria) with this week's noted plunge to new lows for the year. The fact-based investment system's rules say that new buying efforts should be avoided during market corrections.
|
 |
Major Averages Managed "Positive Reversal" From New 2022 Lows
Kenneth J. Gruneisen - Passed the CAN SLIM® Master's Exam
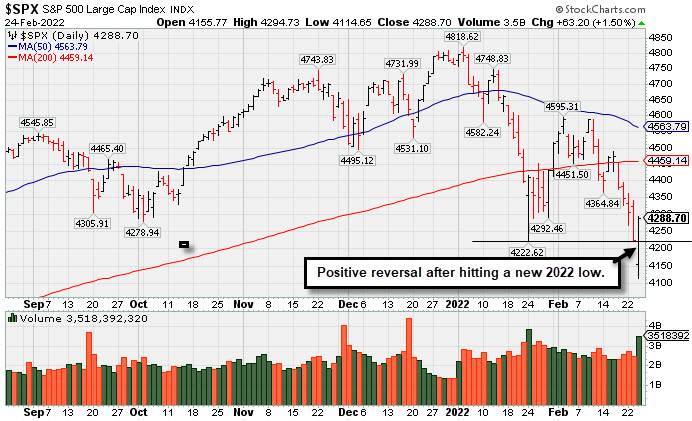
The Dow climbed 92 points, clawing back an earlier 800 point drop to avoid closing in correction territory (defined as a 10% drop from a recent all-time high). The S&P 500 and Nasdaq Composite each reversed steep early session drops to end 1.5% and 3.3% higher, respectively. Still, the broad benchmark is sitting 10.6% below its January 3 record, while the tech-heavy index is down 16% from its November 19 peak. Volume totals reported were higher than the prior session on the NYSE and on the Nasdaq exchange. Breadth was positive as advancers led decliners by a 9-7 margin on the NYSE and 4-3 on the Nasdaq exchange. There were 4 high-ranked companies from the Leaders List that hit new 52-week highs and were listed on the BreakOuts Page, versus 7 on the prior session. New 52-week lows totals swelled and solidly outnumbered new 52-week highs totals on the NYSE and on the Nasdaq exchange. The major indices all managed "positive reversals" on Thursday after plunging to new 2022 lows. The market averages (M criteria) are in a "correction" and disciplined investors are reminded to reduce exposure and raise cash.
 PICTURED: The S&P 500 Index managed a "positive reversal" on Thursday after violating its January low and slumping well below Its 200-day moving average (DMA) line.
U.S. stocks ended higher after a volatile session on Thursday, as dip buying of tech shares helped counter a perceived risk-off mood on Wall Street. Investors weighed the implications of Russia’s invasion of Ukraine and the subsequent sanctions announced by the U.S. and its allies. The new penalties placed limits on Russian financial intuitions and elites, as well as put export controls in place to restrict Russia’s access to semiconductors and other advance technologies.
In commodities, West Texas Intermediate crude gained 1.4% to $93.42/barrel, after briefly topping $100/barrel for the first time since 2014. Meanwhile, perceived safe haven assets caught a bid, with a gauge of the U.S. dollar jumping 0.8% and COMEX gold settling at its best level since January 2021, climbing 0.8% to $1,925.10/ounce. Treasuries advanced, with the yield on the 10-year note down two basis points (0.02%) to 1.96%.
Seven of 11 S&P 500 sectors closed in positive territory, with Technology and Communication Services pacing the gains. In earnings, Moderna Inc. (MRNA +15.03%) rose following robust sales and profit figures. Booking Holdings Inc. (BKNG -7.08%) slid as broader weakness in travel-related shares overshadowed a top and bottom line beat. |
 Kenneth J. Gruneisen started out as a licensed stockbroker in August 1987, a couple of months prior to the historic stock market crash that took the Dow Jones Industrial Average down -22.6% in a single day. He has published daily fact-based fundamental and technical analysis on high-ranked stocks online for two decades. Through FACTBASEDINVESTING.COM, Kenneth provides educational articles, news, market commentary, and other information regarding proven investment systems that work in good times and bad.
Comments contained in the body of this report are technical opinions only and are not necessarily those of Gruneisen Growth Corp. The material herein has been obtained from sources believed to be reliable and accurate, however, its accuracy and completeness cannot be guaranteed. Our firm, employees, and customers may effect transactions, including transactions contrary to any recommendation herein, or have positions in the securities mentioned herein or options with respect thereto. Any recommendation contained in this report may not be suitable for all investors and it is not to be deemed an offer or solicitation on our part with respect to the purchase or sale of any securities. |
|
 |
Retail and Tech Indices Led Market Bounce
Kenneth J. Gruneisen - Passed the CAN SLIM® Master's Exam
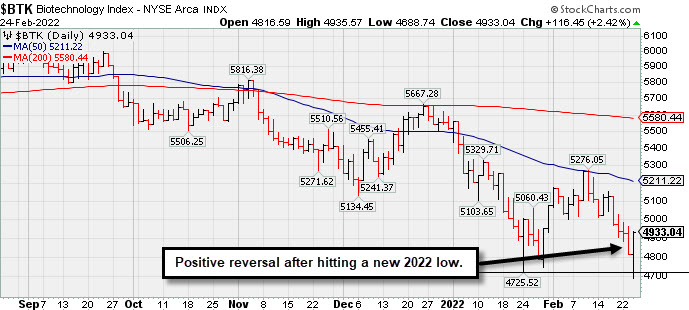
The Semiconductor Index ($SOX +3.70%), Networking Index ($NWX +3.08%), and Biotech Index ($BTK +2.42%) notched unanimous gains. The Retail Index ($RLX +3.20%) also was a positive influence with a solid gain. The Broker/Dealer Index ($XBD +0.27%) eked out a small gain while the Bank Index ($BKX -2.12%) fell. The Gold & Silver Index ($XAU -1.96%) and Integrated Oil Index ($XOI -1.05%) outpaced the Oil Services Index ($OSX -0.28%) to the downside. PICTURED: The Biotech Index ($BTK +2.42%) managed a "positive reversal" after slumping to a new 2022 low.
| Oil Services |
$OSX |
66.33 |
-0.19 |
-0.28% |
+25.81% |
| Integrated Oil |
$XOI |
1,403.86 |
-14.93 |
-1.05% |
+19.15% |
| Semiconductor |
$SOX |
3,399.16 |
+121.36 |
+3.70% |
-13.86% |
| Networking |
$NWX |
862.57 |
+25.76 |
+3.08% |
-11.17% |
| Broker/Dealer |
$XBD |
475.78 |
+1.28 |
+0.27% |
-2.28% |
| Retail |
$RLX |
3,632.31 |
+112.59 |
+3.20% |
-14.06% |
| Gold & Silver |
$XAU |
140.45 |
-2.80 |
-1.96% |
+6.04% |
| Bank |
$BKX |
130.71 |
-2.84 |
-2.12% |
-1.14% |
| Biotech |
$BTK |
4,933.00 |
+116.41 |
+2.42% |
-10.61% |
|
|
|
 |
Featured Stocks
Kenneth J. Gruneisen - Passed the CAN SLIM® Master's Exam
|
|
|
Color Codes Explained :
Y - Better candidates highlighted by our
staff of experts.
G - Previously featured
in past reports as yellow but may no longer be buyable under the
guidelines.
***Last / Change / Volume data in this table is the closing quote data***
Symbol/Exchange
Company Name
Industry Group |
PRICE |
CHANGE
(%Change) |
Day High |
Volume
(% DAV)
(% 50 day avg vol) |
52 Wk Hi
% From Hi |
Featured
Date |
Price
Featured |
Pivot Featured |
|
Max Buy |
 REGN
-
NASDAQ
REGN
-
NASDAQ
Regeneron Pharmaceutical
DRUGS - Biotechnology
|
$609.78
|
+0.80
0.13% |
$610.56
|
530,509
66.81% of 50 DAV
50 DAV is 794,000
|
$686.62
-11.19%
|
12/13/2021
|
$647.95
|
PP = $686.72
|
|
MB = $721.06
|
Most Recent Note - 2/23/2022 5:32:17 PM
G - Consolidating in a tight range below its 50 DMA line ($622) and nearly testing its 200 DMA line ($600), with prior lows in the $592-596 area defining very important near-term support.
>>> FEATURED STOCK ARTICLE : Earnings News Due While Consolidating Above 200 DMA Line - 2/1/2022 |
View all notes |
Set NEW NOTE alert |
Company Profile |
SEC
News |
Chart |
Request a new note
C
A
S
I |
SF
-
NYSE
Stifel Financial Corp
FINANCIAL SERVICES - Investment Brokerage - Regiona
|
$71.55
|
-0.75
-1.04% |
$71.84
|
730,093
119.49% of 50 DAV
50 DAV is 611,000
|
$83.28
-14.09%
|
1/27/2022
|
$74.17
|
PP = $76.23
|
|
MB = $80.04
|
 Most Recent Note - 2/24/2022 2:21:43 PM
G - Gapped down today on track for a 6th consecutive loss undercutting its 200 DMA line noted as the next support ($70.06). A rebound above the 50 DMA line ($73) is needed for its outlook to improve.
>>> FEATURED STOCK ARTICLE : Fourth Loss Following "Negative Reversal" at All-Time High - 2/14/2022 |
View all notes |
Set NEW NOTE alert |
Company Profile |
SEC
News |
Chart |
Request a new note
C
A
S
I |
TGH
-
NYSE
Textainer Group Holdings
TRANSPORTATION - Logistics
|
$36.07
|
+0.30
0.84% |
$36.21
|
408,731
93.96% of 50 DAV
50 DAV is 435,000
|
$41.89
-13.89%
|
1/31/2022
|
$36.68
|
PP = $41.34
|
|
MB = $43.41
|
Most Recent Note - 2/23/2022 5:26:54 PM
G - Violated its 50 DMA line ($37.15) with today's 5th consecutive loss raising greater concerns and its color code is changed to green. Its 200 DMA line ($34.56) and prior lows define the next important support to watch. Recently reported Dec '21 quarterly earnings +80% on +23% sales revenues versus the year ago period. A rebound above the 50 DMA line is needed for its outlook to improve.
>>> FEATURED STOCK ARTICLE : Consolidating Near High Following Strong Earnings Report - 2/15/2022 |
View all notes |
Set NEW NOTE alert |
Company Profile |
SEC
News |
Chart |
Request a new note
C
A
S
I |
HWKN
-
NASDAQ
Hawkins Inc
CHEMICALS - Basic Chemicals
|
$43.13
|
-0.46
-1.06% |
$43.24
|
127,711
228.06% of 50 DAV
50 DAV is 56,000
|
$43.96
-1.89%
|
2/3/2022
|
$39.81
|
PP = $41.07
|
|
MB = $43.12
|
Most Recent Note - 2/24/2022 2:19:10 PM
Y - Consolidating near its all-time high, its color code is changed to yellow after pulling back below its "max buy" level. Prior highs in the $40 area define initial support above its 50 DMA line ($39.37).
>>> FEATURED STOCK ARTICLE : Extended From Prior Base After 6th Consecutive Gain - 2/18/2022 |
View all notes |
Set NEW NOTE alert |
Company Profile |
SEC
News |
Chart |
Request a new note
C
A
S
I |
|
|
|
THESE ARE NOT BUY RECOMMENDATIONS!
Comments contained in the body of this report are technical
opinions only. The material herein has been obtained
from sources believed to be reliable and accurate, however,
its accuracy and completeness cannot be guaranteed.
This site is not an investment advisor, hence it does
not endorse or recommend any securities or other investments.
Any recommendation contained in this report may not
be suitable for all investors and it is not to be deemed
an offer or solicitation on our part with respect to
the purchase or sale of any securities. All trademarks,
service marks and trade names appearing in this report
are the property of their respective owners, and are
likewise used for identification purposes only.
This report is a service available
only to active Paid Premium Members.
You may opt-out of receiving report notifications
at any time. Questions or comments may be submitted
by writing to Premium Membership Services 665 S.E. 10 Street, Suite 201 Deerfield Beach, FL 33441-5634 or by calling 1-800-965-8307
or 954-785-1121.
|
|
|