You are not logged in.
This means you
CAN ONLY VIEW reports that were published prior to Sunday, March 30, 2025.
You
MUST UPGRADE YOUR MEMBERSHIP if you want to see any current reports.
AFTER MARKET UPDATE - TUESDAY, FEBRUARY 15TH, 2022
Previous After Market Report Next After Market Report >>>
|
|
|
|
DOW |
+422.67 |
34,988.84 |
+1.22% |
|
Volume |
919,198,978 |
-12% |
|
Volume |
4,336,441,300 |
+1% |
|
NASDAQ |
+348.84 |
14,139.76 |
+2.53% |
|
Advancers |
2,483 |
77% |
|
Advancers |
3,497 |
78% |
|
S&P 500 |
+69.40 |
4,471.07 |
+1.58% |
|
Decliners |
752 |
23% |
|
Decliners |
1,001 |
22% |
|
Russell 2000 |
+55.67 |
2,076.46 |
+2.76% |
|
52 Wk Highs |
34 |
|
|
52 Wk Highs |
52 |
|
|
S&P 600 |
+29.68 |
1,326.27 |
+2.29% |
|
52 Wk Lows |
181 |
|
|
52 Wk Lows |
191 |
|
|
Following the Monday, January 31st follow-through day in the market (M criteria) which confirmed a new uptrend the major averages have again come under noted pressure. New buying efforts may be made only in stocks fitting all key criteria of the fact-based investment system.
|
 |
Major Averages Were Led Higher by Tech Sector Rally
Kenneth J. Gruneisen - Passed the CAN SLIM® Master's Exam
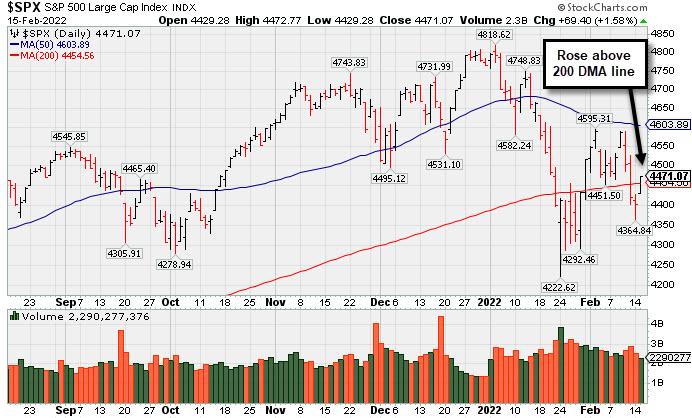
The Dow rose 422 points, while the S&P 500 advanced 1.6%. The Nasdaq Composite jumped 2.5%, with Technology shares leading the rebound. West Texas Intermediate crude slid 3.7% to $91.96/barrel. Volume totals reported were mixed, lighter than the prior session on the NYSE and higher on the Nasdaq exchange. Breadth was clearly positive as advancers led decliners by more than a 3-1 margin on the NYSE and on the Nasdaq exchange. There were 11 high-ranked companies from the Leaders List that hit new 52-week highs and were listed on the BreakOuts Page, versus 6 on the prior session. New 52-week lows totals still solidly outnumbered new highs totals on the NYSE and on the Nasdaq exchange. The market averages (M criteria) are in an uptrend under pressure. For any sustained rally there must be a healthy crop of stocks hitting new highs, so it remains critically important for leadership to improve. PICTURED: The S&P 500 Index rose above its 200-day moving average (DMA) line with Tuesday's gain on lighter volume than the 3 prior losses.
U.S. stocks snapped a three-day losing streak on Tuesday as signs of de-escalating geopolitical tensions in Ukraine helped fuel a relief rally. Russia reportedly returned some military units to their bases, while diplomatic talks are said to continue this week. Meanwhile, President Biden said that the U.S. is committed to diplomacy, but also warned of swift action if provoked as a Russian attack on Ukraine still remains a possibility.
Perceived safe havens retreated amid the apparent risk-on mood, with the U.S. dollar falling 0.4%. Treasuries weakened, with the yield on the 10-year note up five basis points (0.05%) to 2.05%. Inflation data also remained in focus. The Producer Price Index (PPI) climbed 1% in January, the most in eight months. The headline figure jumped 9.7% year-over-year, modestly below last month’s record 9.8% annual pace. Core PPI (excluding food and energy) came in at a hotter-than-expected 8.3% year-over-year. Separately, the empire manufacturing survey rebounded less than expected in February after slipping to the lowest level since May 2020 last month.
Nine of 11 S&P 500 sectors finished in positive territory, with Energy and Utilities the only laggards. Chipmakers were among the standouts, helped by merger and acquisition headlines. Tower Semiconductor Ltd. (TSEM +42.08%) rose after Intel Corp. (INTC +1.81%) said it would buy the Israeli company for $5.4 billion. Meanwhile, Constellation Brands Inc. (STZ -6.12%) fell amid speculation that merger talks with Monster Beverage Corp. (MNST +0.25%) are progressing. |
 Kenneth J. Gruneisen started out as a licensed stockbroker in August 1987, a couple of months prior to the historic stock market crash that took the Dow Jones Industrial Average down -22.6% in a single day. He has published daily fact-based fundamental and technical analysis on high-ranked stocks online for two decades. Through FACTBASEDINVESTING.COM, Kenneth provides educational articles, news, market commentary, and other information regarding proven investment systems that work in good times and bad.
Comments contained in the body of this report are technical opinions only and are not necessarily those of Gruneisen Growth Corp. The material herein has been obtained from sources believed to be reliable and accurate, however, its accuracy and completeness cannot be guaranteed. Our firm, employees, and customers may effect transactions, including transactions contrary to any recommendation herein, or have positions in the securities mentioned herein or options with respect thereto. Any recommendation contained in this report may not be suitable for all investors and it is not to be deemed an offer or solicitation on our part with respect to the purchase or sale of any securities. |
|
 |
Tech, Financial, and Retail Indexes Rose
Kenneth J. Gruneisen - Passed the CAN SLIM® Master's Exam
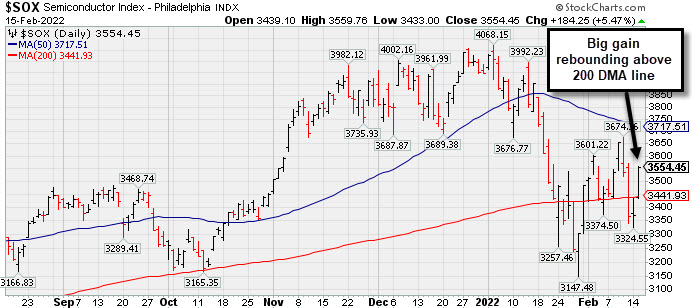
The Broker/Dealer Index ($XBD +2.35%) and Bank Index ($BKX +1.88%) both posted influential gains and they outpaced the Retail Index ($RLX +0.87%). The Semiconductor Index ($SOX +5.47%) led the tech sector rally while the Networking Index ($NWX +3.87%) followed and the Biotech Index ($BTK +1.96%) posted a smaller gain. The Oil Services Index ($OSX +1.23%) rose, meanwhile the Integrated Oil Index ($XOI -1.94%) and Gold & Silver Index ($XAU -1.05%) both lost ground. PICTURED: The Semiconductor Index ($SOX +5.47%) posted a big gain and rebounded above its 200-day moving average (DMA) line.
| Oil Services |
$OSX |
67.75 |
+0.82 |
+1.23% |
+28.51% |
| Integrated Oil |
$XOI |
1,427.25 |
-28.28 |
-1.94% |
+21.14% |
| Semiconductor |
$SOX |
3,554.45 |
+184.25 |
+5.47% |
-9.93% |
| Networking |
$NWX |
870.53 |
+32.42 |
+3.87% |
-10.35% |
| Broker/Dealer |
$XBD |
504.79 |
+11.59 |
+2.35% |
+3.68% |
| Retail |
$RLX |
3,845.08 |
+33.21 |
+0.87% |
-9.02% |
| Gold & Silver |
$XAU |
135.73 |
-1.44 |
-1.05% |
+2.47% |
| Bank |
$BKX |
142.66 |
+2.64 |
+1.88% |
+7.90% |
| Biotech |
$BTK |
5,121.06 |
+98.30 |
+1.96% |
-7.20% |
|
|
|
 |
Consolidating Near High Following Strong Earnings Report
Kenneth J. Gruneisen - Passed the CAN SLIM® Master's Exam
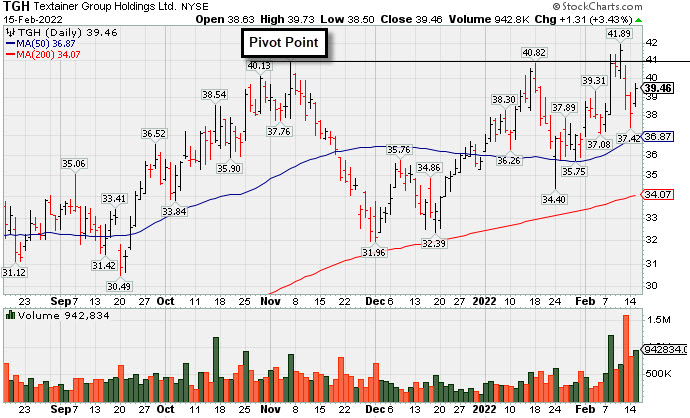
Textainer Group Holdings (TGH +$1.31 and +3.43% to $39.46) posted a solid volume-driven gain today. It recently found support at its 50-day moving average (DMA) line ($36.87) while consolidating. TGH was highlighted in yellow with pivot point cited based on its 11/05/21 high plus 10 cents in the 1/31/22 mid-day report (read here) and covered in greater detail that evening with an annotated graph under the headline, "Consolidating Above 50-Day Moving Average".
Fundamentals remain strong. TGH has the highest possible Earnings Per Share Rating of 99. It reported Dec '21 quarterly earnings +80% on +23% sales revenues versus the year ago period, its 7th strong earnings comparison. Sales revenues growth has been improving and accelerating in recent quarterly comparisons, a strong match with regard to the fact-based investment system's fundamental guidelines. Annual earnings (A criteria) history has been strong after a downturn and loss in FY '16.
It hails from the Commercial Services - Leasing industry group which is currently ranked 53rd on the 197 Industry Groups list (L criteria). There are 49.3 million shares outstanding (S criteria) which can contribute to greater price volatility in the event of institutional buying or selling. The number of top-rated funds owning its shares has risen from 294 in Dec '20 to 339 in Dec '21, a reassuring sign concerning the I criteria. It has a Timeliness rating of A and an Accumulation/Distribution rating of D. |
|
|
Color Codes Explained :
Y - Better candidates highlighted by our
staff of experts.
G - Previously featured
in past reports as yellow but may no longer be buyable under the
guidelines.
***Last / Change / Volume data in this table is the closing quote data***
|
|
|
THESE ARE NOT BUY RECOMMENDATIONS!
Comments contained in the body of this report are technical
opinions only. The material herein has been obtained
from sources believed to be reliable and accurate, however,
its accuracy and completeness cannot be guaranteed.
This site is not an investment advisor, hence it does
not endorse or recommend any securities or other investments.
Any recommendation contained in this report may not
be suitable for all investors and it is not to be deemed
an offer or solicitation on our part with respect to
the purchase or sale of any securities. All trademarks,
service marks and trade names appearing in this report
are the property of their respective owners, and are
likewise used for identification purposes only.
This report is a service available
only to active Paid Premium Members.
You may opt-out of receiving report notifications
at any time. Questions or comments may be submitted
by writing to Premium Membership Services 665 S.E. 10 Street, Suite 201 Deerfield Beach, FL 33441-5634 or by calling 1-800-965-8307
or 954-785-1121.
|
|
|